The features that separate good business reporting software from the rest, with a simple test you can run on each during a trial.
- Decide which report types you need: strategic, analytical and operational. Each serves a different audience, from executives tracking goals to managers watching daily operations.
- Test whether staff can build an ad hoc report without IT help. Questions change fast, and custom reports built on the fly keep decisions moving.
- Confirm the tool pulls data from your existing systems automatically. Bringing financial, operational and KPI data into one place saves time and cuts manual errors.
- Check encryption, access controls and compliance first in regulated sectors. Healthcare and government data needs protection from unauthorized access and breaches.
Choosing business reporting software matters most for organizations that want to improve their strategic planning and execution. The right tool makes operations more efficient and gives decision-makers clear answers. Below are the features worth checking, with a test you can run on each during a trial.
Start by deciding which reports you need. Strategic reports give executives a high-level view of performance against goals, including progress on key performance indicators (KPIs). Analytical reports break down data to show patterns and trends, and operational reports track daily work so managers can deal with issues quickly.
Features to Look for in Business Reporting Software
Interactive, Customizable Dashboards
Interactive dashboards let users watch data as it changes and see performance metrics and strategic results at a glance. Each team should be able to choose what its dashboard shows, and the same data should be presentable as charts and graphs for internal meetings or for external stakeholders. Test it by asking a non-technical user to rebuild one of your current reports as a dashboard.
ClearPoint dashboards, reports and metrics can be tailored to an organization's own strategic goals and to the needs of sectors such as healthcare and local government, so decision-makers see the KPIs, trends and areas for improvement that matter to them.
Southern Ohio Medical Center (SOMC), a 211-bed hospital, shows how layered dashboards work in practice. An overall summary dashboard gives a high-level view of performance across the organization, built around its “Big Five Strategic Values”: Safety, Quality, Service, Teamwork and Finance. Each department has its own dashboard linked to those values, with KPIs shown in graphs and charts for a quick assessment. The data is reachable through a link on SOMC’s intranet, so anyone from the CEO to frontline nursing staff can see it.
Data Integration from Your Existing Systems
Reports are only as good as the data behind them. The software should integrate data, pulling financial data, operational metrics and KPIs from your databases, cloud services and internal systems into one place, so nobody has to copy figures by hand. Test it by connecting one real data source during the trial and checking that the numbers match the original.
ClearPoint brings data from different sources into one reporting environment. That saves the time spent gathering figures and cuts manual errors, so everyone works from the same numbers.
Velosio, an enterprise software reseller, made integration a requirement because it did not want to scrap its existing accounting and ERP systems. Less than five months after discovering ClearPoint, it had finished integrating it with the Dynamics ERP system. Measures fed directly into ClearPoint, so people needn’t spend time digging for data because it was already up to date.
Ad Hoc Reports, Scheduled Reports and Alerts
Questions change quickly, so staff should be able to build a custom report on the spot without IT help. A good test is to ask for a comparison of performance across two periods and time how long it takes to produce. In ClearPoint, users build and adjust reports this way to look at a specific part of the data or judge the effect of a new strategy.
The time savings can be large. At San Juan Regional Medical Center, a 198-bed Level III trauma center in New Mexico, it used to take half a day to create a single report in a readable, printable format for committee meetings. Some departments did manual calculations in Excel and printed graphs one by one. With all hospital data in ClearPoint, calculations happen automatically and reports take minutes. The hospital saw an 89% reduction in reporting time for management reports and an 83% improvement in build time for new reporting requirements.
Two related features cut the time between requests. Scheduled reports generate at set intervals (daily, weekly or monthly), so stakeholders stay informed without anyone assembling a report by hand. Alerts notify you of significant changes or milestones in your data while there is still time to act.
Security and Compliance
Sectors like healthcare and government handle sensitive data, so the tool must prevent unauthorized access and data breaches. Ask each vendor how data is encrypted, how access is controlled and which regulatory standards they meet. ClearPoint uses encryption and secure access controls to protect customer data.
Access controls also let you share sensitive data with the right people only. At SOMC, each of the 200+ providers, such as physicians, nurse practitioners and physician assistants, has an individual dashboard with their own performance metrics. These dashboards are protected and accessible only within the ClearPoint live system. The hospital says that level of access has encouraged providers to engage with the data and increased data transparency.
Collaboration Tools
Collaboration tools let teams share reports and work on the same data wherever they are. Look for comments, controlled access and updates that everyone sees at once. ClearPoint supports this with on-page discussions, @mentions, workflows, reminders, notifications and integration with Microsoft Teams.
AI Assistance

Ask vendors to show exactly what their AI features do with your data, rather than accepting a general promise. ClearPoint's OKR AI Assistant, shown above, asks for a user's title and department and then suggests strategic objectives to start from.
Scalability and Performance
As organizations grow, they add users, data sources and reports. The software should handle more data without slowing down or losing features. Ask vendors how the tool performs at your expected size in a few years, not just today.
How to Compare Tools on These Features
Before you look at vendors, name the strategic goals each report must serve. Then check your current reports for gaps:
- Is data siloed or hard to reach?
- Are reports unclear?
- Are the insights you need for decisions missing?
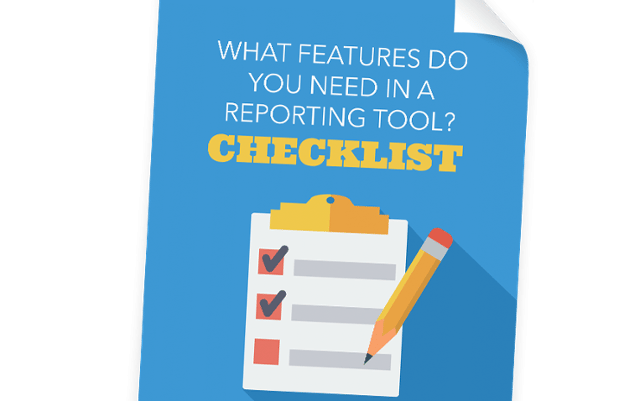
Those gaps show which features matter most to you. Build a comparison table or checklist and score each option on cost, scalability, ease of use and customer support. The checklist What Features Do You Need in a Reporting Tool? gives you a starting point.
See how ClearPoint automates your strategy reporting — book a demo
Common questions
Is Excel a reporting tool?
While Excel can be used for reporting, it lacks the advanced analytical capabilities and integration features of dedicated reporting tools.
What are the benefits of business reporting tools?
They provide real-time data access, improve decision-making, enhance efficiency, and offer deep analytical insights.
Buying existing reporting software vs. developing a custom solution, which one is better?
This depends on your organization's specific needs, resources, and strategic goals. Existing software offers quick implementation and proven solutions, while custom development can offer tailored functionality but often at a higher cost and longer development time.