We analyzed over 20,000 strategic plans. Get a copy of the full report.
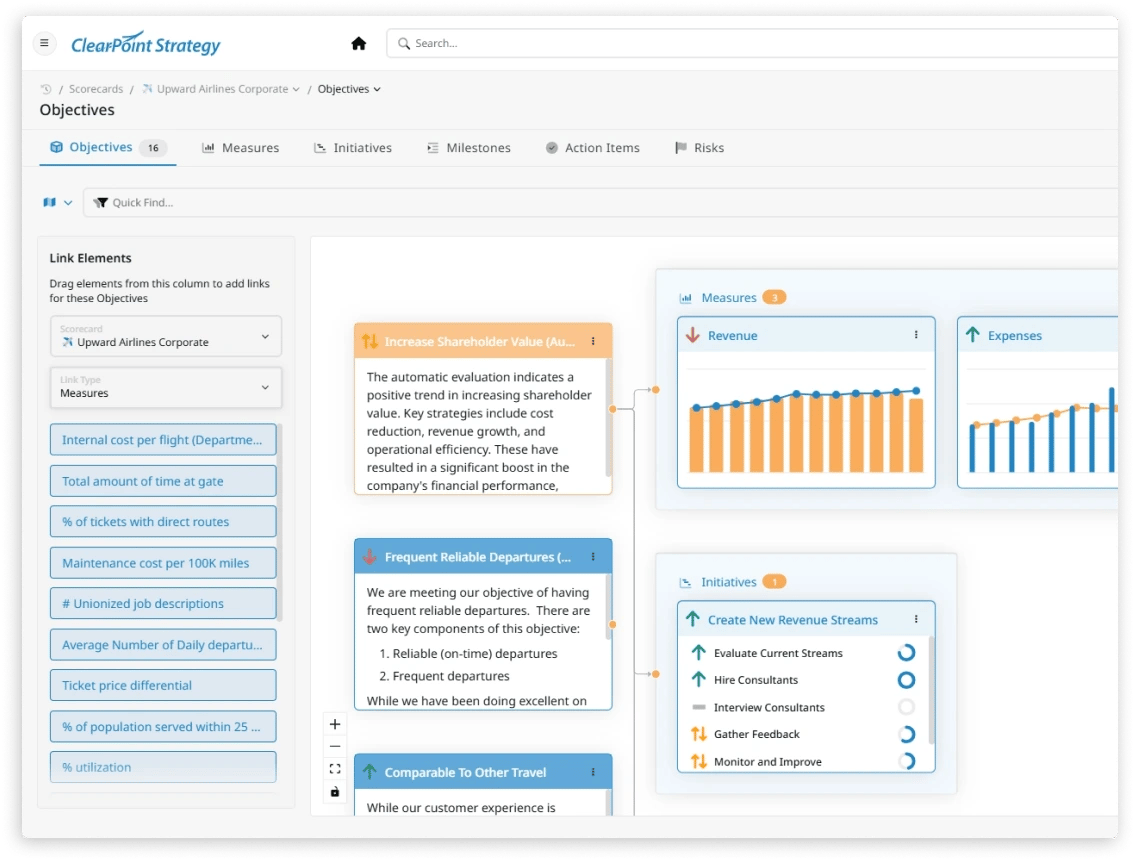
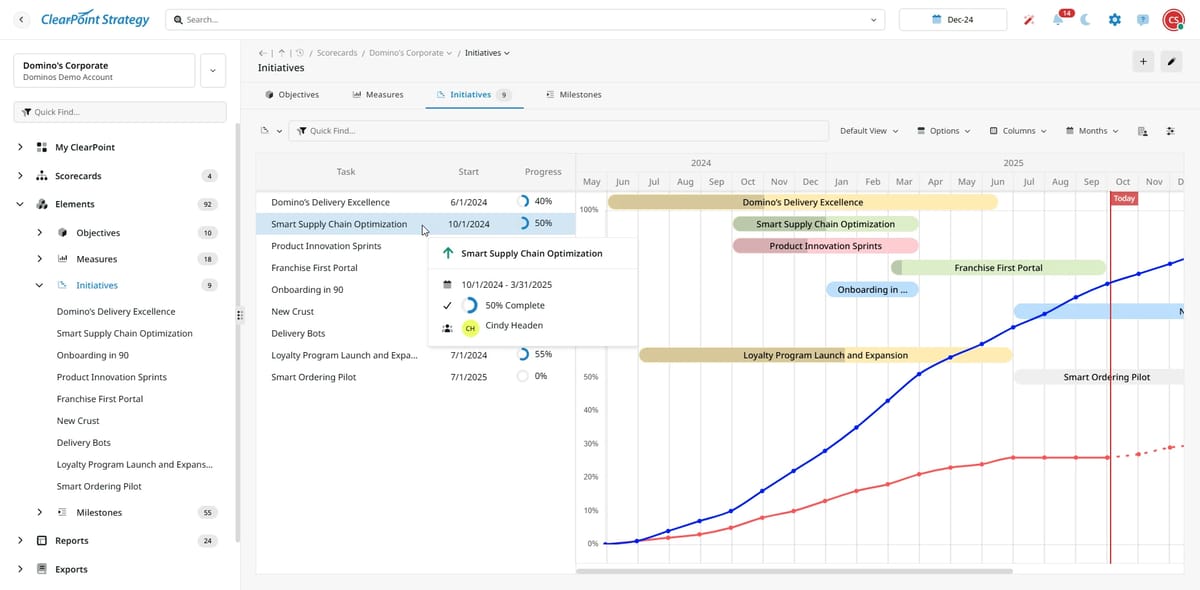
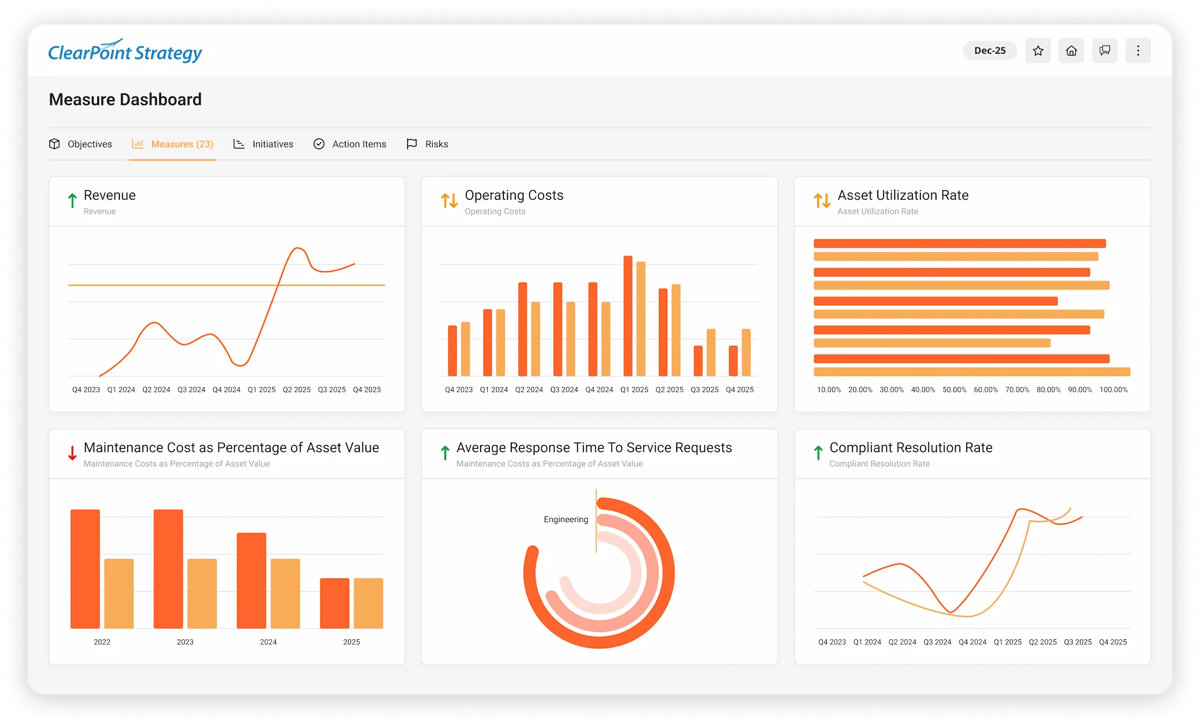
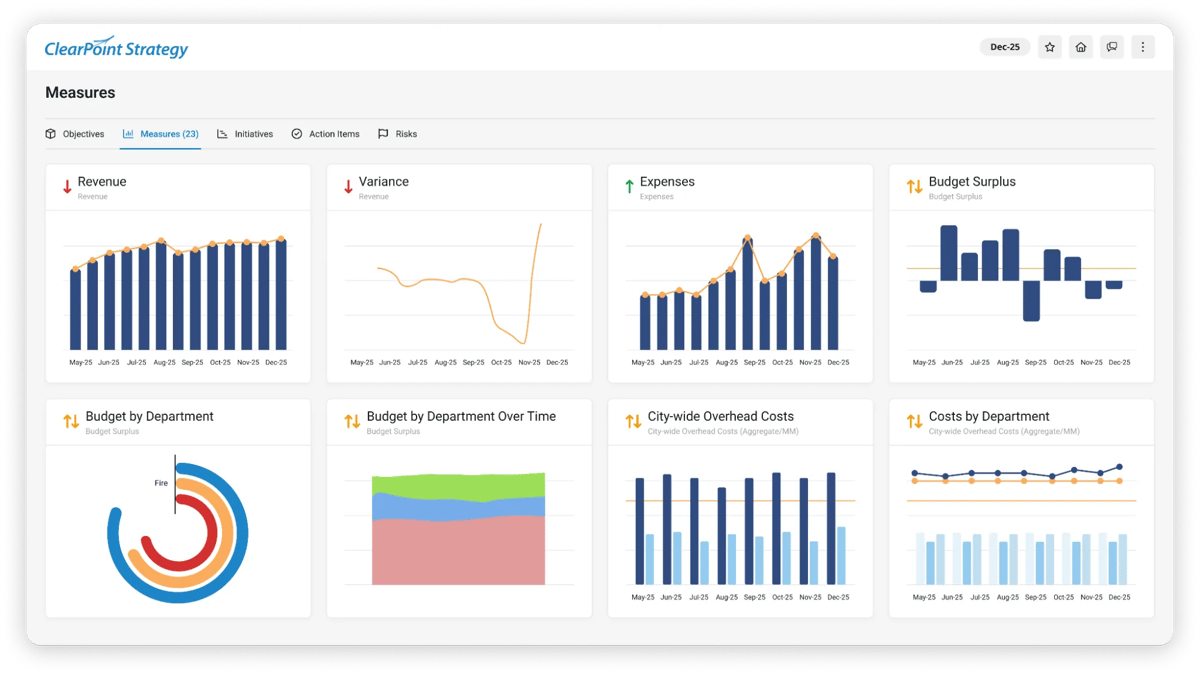
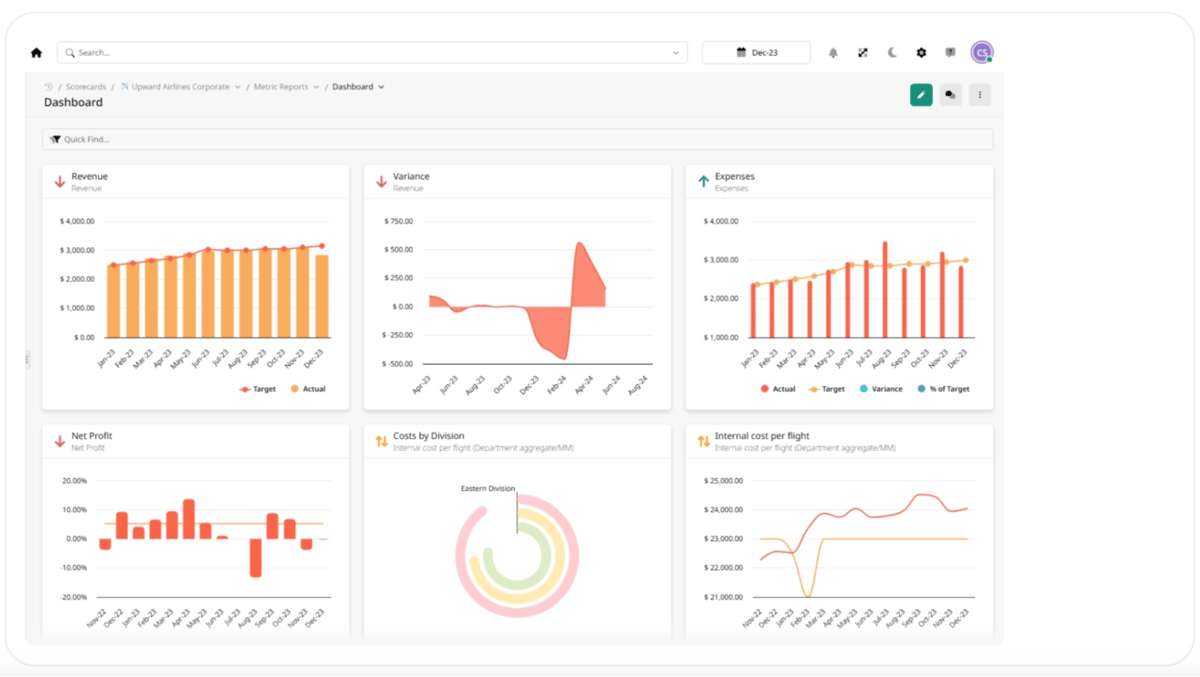
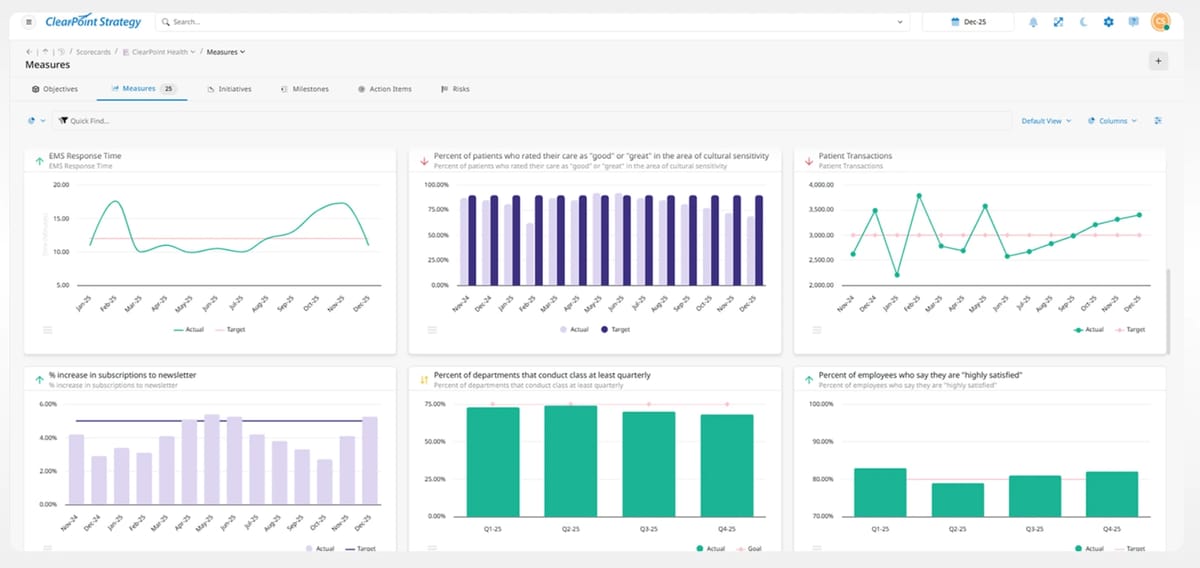
Good performance reporting answers three questions: are we on track, where are we off and why, and what decision is needed now. Dashboards fail on stale data more often than on design. On ClearPoint, 70% of the 6,659 people assigned as owners have never logged an update, and roughly 40% of goals are green at any given time, so an all-green dashboard usually means something is not being measured. Put an owner and a last-updated date on every number.

Learn KPI dashboard best practices from over 20,000 strategic plans. From choosing the right metrics to executive-ready layouts, this guide covers everything.



In this performance management case study, find out how one hospital's switch to ClearPoint has given managers the clarity (and simplicity) they need to improve performance.
Read the story
Strategy management and a strategy management system are key to DC Thomson's success as they grow and expand.
Read the story
See how the nonprofit demonstrates the power of effective data management tools in transforming healthcare operations.
Read the story
Discover how ELDOR keeps operations and strategy intricately intertwined.
Read the story
Effecting change in a large organization is, so they say, a lot like turning around a battleship: painfully slow. But some organizations disprove that old saw. Take Pacific Gas & Electric (PG&E).
Read the storyGood performance reporting answers three questions: are we on track, where are we off and why, and what decision is needed now. Dashboards fail on stale data more often than on design. On ClearPoint, 70% of the 6,659 people assigned as owners have never logged an update, and roughly 40% of goals are green at any given time, so an all-green dashboard usually means something is not being measured. Put an owner and a last-updated date on every number.
Eight to twelve. If it needs scrolling, it's a report, not a dashboard. Keep the detail one click down for the people who need it.
Stale numbers. On ClearPoint, 70% of the 6,659 people assigned as owners have never logged an update, and once leaders spot an old figure they stop trusting the whole view. Show an owner and a last-updated date on every panel.
Four sections: an executive summary, a strategic scorecard, the initiative portfolio, and a resource outlook. Lead with the headline, not the methodology, and report by exception: green items get a sentence, off-track items get cause, recovery action, owner and date.
Match the depth to the cadence: a 5–10 minute weekly check, a 10–15 minute monthly review, and a 15–25 minute quarterly discussion. Have departments report a week before the executive meeting so leaders discuss current numbers.
Yes, if you will keep it current. Organize it around four to six resident outcome themes, show 15–25 KPIs with at least three years of trend, and put an owner and a last-updated date on every measure.
The mechanics: data uploads, update reminders, calculations, report generation and follow-up. The commentary and the decisions still need people. San Juan Regional Medical Center cut the time to produce management reports by 89% after automating them.