

Performance Improvement Strategy
Southern Ohio Medical Center (SOMC) is a 211-bed hospital with over 40 clinics serving a rural Ohio community. As a nonprofit, it had trouble managing performance improvement across a complex organization.
David Richard, Director of Performance Improvement and Clinical Information Systems, and Tiffany LaCoste, Manager of Performance Improvement, joined us for a customer interview about how SOMC improved operational efficiency with ClearPoint Strategy.
Watch the full recording here!
About Southern Ohio Medical Center
Southern Ohio Medical Center (SOMC) is a 211-bed not-for-profit hospital in Portsmouth, Ohio. It provides emergency and surgical care and a wide range of other health care services. SOMC has been in the community since 1954. It employs over 3,000 full and part-time employees and has a medical staff of more than 250 physicians and specialists. Its mission is to make a difference, and its vision is to be known as the leading medical center in its region. Its five strategic values are safety, quality, service, teamwork and financial performance.
Strategy and performance improvement are related but do different jobs. Strategy uses organizational strengths and opportunities to gain a competitive market advantage, while performance improvement (PI) solves specific problems, streamlines processes, and increases efficiency.
The PI role also includes quality improvement (QI), a systematic, data-driven approach to better outcomes and higher standards. A QI plan is a regulatory requirement, so QI runs through all of SOMC: reporting, accreditation, research, informatics, and more. Richard and LaCoste often ask:
- What are the metrics we’re going to monitor that are key clinically and operationally?
- What are the “bumpers” that will trigger a formal process improvement project using SOMC methodology?
- How will we evaluate the effectiveness?
Before ClearPoint
Managing hundreds of measures across a team approach with a very large scope became harder and harder. Decentralized efforts left SOMC with poor control over process and quality improvement. Richard called the result “pockets of greatness,” which existed throughout the organization and went unaddressed.
Data management was a real chore.
Too Much Data
Dedicated people filled Excel cells with data from across the organization, then copied it into every place it needed to live for various teams. This was time-consuming and prone to human error. Data came from:
- Leaders evaluating their operational processes
- Payors submitting claims data, each with individual ICD-10 codes
- Press Ganey patient surveys
- In-house collections for registries
Not Enough Time
SOMC relied heavily on spreadsheets, which made proving compliance in regulatory audits difficult. When regulators asked to see the PI plan and its execution, SOMC struggled to show its impact for:
- Clinical registries
- Regulatory agencies, such as The Joint Commission and the Centers for Medicare & Medicaid Services
- Providers, task forces, departments, etc.
- The higher department of health
- QI registries, including NDNQI
The challenge was displaying disparate data to different audiences so teams could quickly gain insights and decide on improvements. The solution was ClearPoint Strategy. The platform lets SOMC duplicate standardized templates, link metrics among multiple teams, create data visualizations, and more, while automating manual processes and serving as the single source of truth for all data.
It is far superior at a glance with the visualizations that we’re capable of in ClearPoint to demonstrate trends.
Southern Ohio Medical Center in ClearPoint
LaCoste shares a look inside the SOMC ClearPoint account – click to explore! (9:50)
SOMC’s ClearPoint account shares information across all levels of the organization. SOMC has centralized over 400 scorecards and their metrics there. The data is available through an HTML link on SOMC’s intranet, so anyone from the CEO to frontline nursing staff can see it.
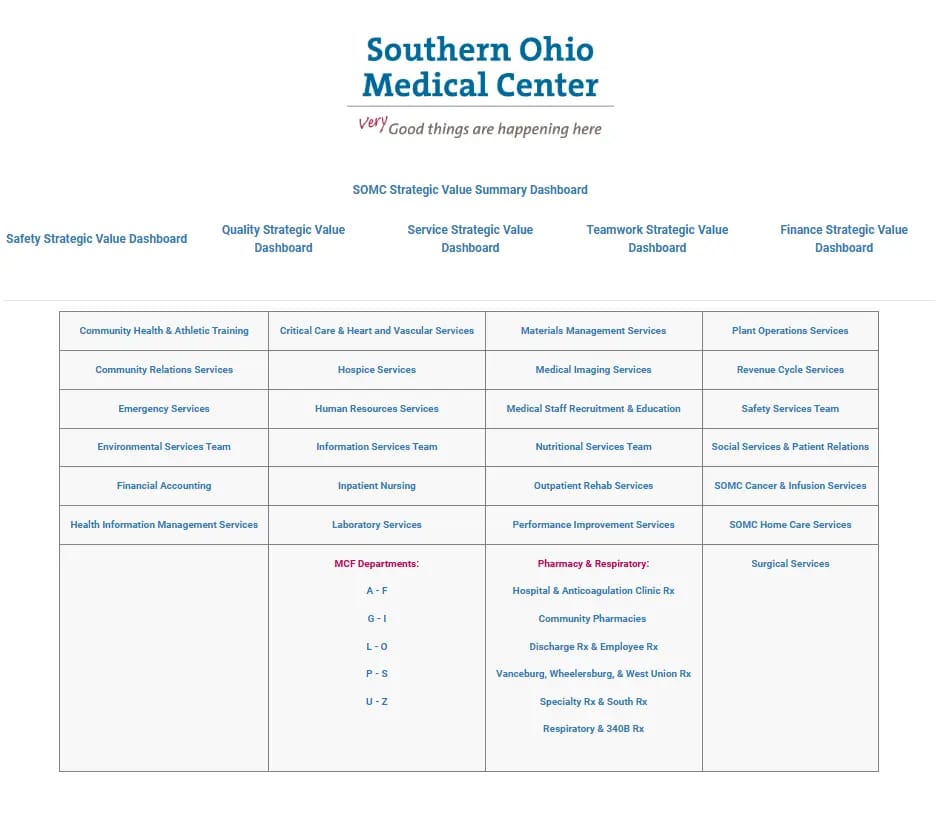
At the core is SOMC’s overall summary dashboard, a high-level view of performance across the organization. It includes the “Big Five Strategic Values,” consisting of Safety, Quality, Service, Teamwork, and Finance. Each department has its own dashboard linked to these values, with key performance indicators (KPIs) shown in graphs and charts for a quick read on performance. That makes it possible to decide quickly and start improvement projects when needed.
ClearPoint also lets SOMC manage and share performance improvement projects, with both quantitative and qualitative information. These initiatives are called “A Better Way (ABW),” and staff can open process maps, fishbone diagrams, and PI data, all within ClearPoint.
All 200+ providers, like physicians, nurse practitioners, and physician assistants, have an individual dashboard with their own performance metrics. The dashboards are protected and accessible only within the live ClearPoint system, and they tie to credentialing, privileging, and other incentives. Providers now engage with the data, which has increased transparency and fed a culture of continuous improvement.
As leaders in PI, we do a lot of data – trending it, tracking it… but to get us to where we need to be, the frontline staff is going to get us there. ClearPoint gives them the ability to see “Oh, we're not doing that great.” “Are we doing something about it?” “If we’re not, let’s start an improvement project to get there.”
Onboarding with ClearPoint
SOMC involved leaders in onboarding, letting them see the structure of their customized dashboards and measures. Each dashboard reflects the metrics that matter to that leader, gives one place to find data and share it with staff, and shows each department only relevant data.
The PI team has been cross-trained to share the support load, so it can do more with fewer full-time equivalents. Automation features such as the Data Loader cut the time it takes to populate data across the account. Richard and LaCoste manage the system on their own.
It took one person 40 hours a month to populate all that data in all the places it needed to go, and we’ve cut that down to 15-20 minutes. It's made huge efficiencies for our team.
ClearPoint makes it easier to put action plans in place for metrics with room to improve. Involving leaders in implementation kept the system aligned with each department’s needs and built buy-in. The result was clear improvements, or rather, “Better Ways.”
Scaling with ClearPoint
For an account this large and complex, customer support mattered. The ClearPoint team learned SOMC’s organizational structure and language and provided training so the system met its needs.
SOMC’s experience underscores the value of a clear vision, communicating it, and taking your time. Rather than configure everything at once, SOMC let leaders shape the design and function of their dashboards. Looking back, the phased approach, letting users shape the system, and investing in implementation resources were key to adoption.
ClearPoint Strategy not only simplified our data management, but also aligned our performance improvement efforts across the hospital. The ability to quickly see and act on opportunities for improvement has been a game-changer.
SOMC recognized that its previous methods were broken, so the move to ClearPoint was not a direct transfer of data. It meant re-evaluating processes.
With ClearPoint, SOMC turned decentralized and inefficient PI efforts into a centralized system that improved stakeholders’ ability to interpret data, demonstrate performance improvements, and comply with regulations.
See the software in action! Schedule a free demo with a strategy expert today.
Additional Case Studies
Southern Ohio Medical Center


Riverside Community Health Foundation

Winnebago County Public Health Department
