
.png)

Learn KPI dashboard best practices from 20,000+ strategic plans. From choosing the right metrics to executive-ready layouts, this guide covers everything.
The Problem with Most KPI Dashboards
Most KPI dashboards fail — not because the data is wrong, but because the design is.
Teams spend weeks configuring dashboards with dozens of charts, tables, and metrics. The result is a screen packed with numbers that nobody uses. Leadership skims it once, asks a question the dashboard cannot answer, and goes back to making decisions based on gut feeling and hallway conversations.
The issue is almost always the same: the dashboard was built to display data, not to drive decisions. There is a fundamental difference between the two, and organizations that understand it consistently outperform those that do not.
At ClearPoint Strategy, we manage performance data for over 20,000 strategic plans across government agencies, healthcare systems, higher education institutions, financial services, and utilities. This guide compiles the best practices we have seen work repeatedly — practical patterns you can apply whether you are building your first dashboard or redesigning an existing one.
Best Practice #1: Start with Decisions, Not Metrics
The most common mistake in dashboard design is starting with the question "what should we track?" The better question is: "what decisions does this dashboard need to support?"
Every dashboard should serve a specific audience making specific decisions at a specific cadence. A city manager reviewing quarterly performance needs a fundamentally different view than a department head managing weekly operations.
Before selecting a single metric, answer these three questions:
Who is the primary audience? A dashboard designed for city council members looks nothing like one built for an IT operations team. Council members need strategic outcomes and trend lines. Operations teams need real-time status indicators and exception alerts.
What decisions will they make? If your dashboard supports quarterly business reviews, the metrics should help leadership decide where to allocate resources, which initiatives to accelerate, and which to pause. If it supports daily operations, it should surface anomalies that require immediate action.
How often will they look at it? A dashboard reviewed weekly needs different granularity than one reviewed monthly. Weekly dashboards benefit from short-term trend lines and week-over-week comparisons. Monthly and quarterly dashboards should emphasize longer-term trajectories and progress toward annual goals.
This decision-first approach eliminates the metric bloat that kills most dashboards before they launch.
Best Practice #2: Limit Metrics to What Matters
Research from cognitive psychology — notably George Miller's foundational work on cognitive load — consistently shows that humans can effectively process 5-9 pieces of information at once. Yet most dashboards display 30 or more metrics on a single screen.
The best KPI dashboards we have seen follow a strict hierarchy:
Tier 1 — North Star Metrics (3-5). These are the metrics your organization would track if you could only track five things. For a city government, this might be resident satisfaction score, budget variance, employee engagement index, infrastructure condition rating, and public safety response time. These go front and center.
Tier 2 — Supporting Indicators (8-12). These metrics explain why the North Star metrics are moving. If resident satisfaction drops, supporting indicators like parks maintenance ratings, permit processing times, and code enforcement responsiveness help diagnose the cause.
Tier 3 — Operational Detail (available on drill-down). Everything else lives behind a click. Department-level data, individual initiative status, and granular operational metrics should be accessible but not visible on the primary view.
This three-tier approach gives executives what they need at a glance while preserving detailed data for analysts and department heads who need deeper investigation.
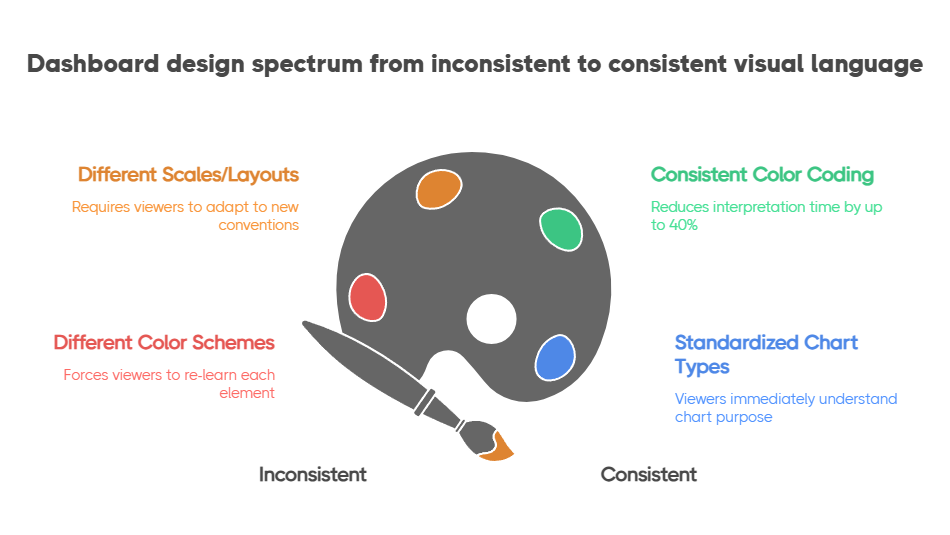
Best Practice #3: Use Consistent Visual Language
A dashboard where every chart uses a different color scheme, scale, or layout forces viewers to re-learn how to read each element. Cognitive load goes up, comprehension goes down.
Establish a visual language and apply it universally:
Color means status, not decoration. Use green, yellow, and red consistently to indicate on-track, at-risk, and off-track. Reserve blue or gray for neutral/informational elements. Never use color purely for aesthetics — every color should communicate something. The Nielsen Norman Group's research on dashboard design confirms that consistent color coding reduces interpretation time by up to 40%.
Direction matters. Up arrows, trend lines, and sparklines should always follow the same convention: green-up means improvement, red-down means decline. For metrics where lower is better (like response time or cost per unit), invert the color logic so that the viewer's intuition stays consistent.
Standardize chart types by use case. Trend over time gets a line chart. Comparison across categories gets a bar chart. Part-to-whole relationships get a donut or stacked bar. Current status gets a gauge or scorecard card. When viewers see a line chart, they should immediately think "this is a trend" without reading the title.
Organizations that use ClearPoint's performance management framework benefit from built-in visual standards that enforce these conventions automatically, reducing the design burden on dashboard builders.
Best Practice #4: Build for the Quarterly Business Review
The quarterly business review (QBR) is where dashboards prove their worth — or expose their weaknesses. The ICMA (International City/County Management Association) has long advocated for data-driven review cycles as the backbone of effective local government management. A dashboard that looks great in a design meeting but cannot answer leadership's questions during a QBR is fundamentally broken.
Design your dashboard to answer the five questions that come up in every QBR:
If your dashboard can walk through these five questions without anyone needing to open a spreadsheet or dig through email threads, you have built something that will actually get used.
Best Practice #5: Connect KPIs to Strategy — Not Just Operations
The dashboards that create the most value are those that visually connect day-to-day metrics to strategic objectives. Without this connection, you have an operational monitoring tool — useful, but not transformative.
A Balanced Scorecard approach is particularly effective here because it organizes metrics across four perspectives — Financial, Customer, Internal Processes, and Learning & Growth — that naturally map operational KPIs to strategic themes.
For local governments, ClearPoint's framework supports a modified version:
When a department head sees their permit processing time KPI sitting under the "Service Delivery" strategic objective, which in turn connects to the "Community Outcomes" goal of resident satisfaction, the dashboard tells a story. It explains why that metric matters — and why improving it is worth the effort.
Best Practice #6: Automate Data Collection (or Your Dashboard Dies)
A dashboard that requires manual data entry is a dashboard with an expiration date. The first month, someone dutifully updates every metric. The second month, a few get skipped. By month three, the dashboard shows stale data, leadership stops trusting it, and the entire investment is wasted.
Automation is not a nice-to-have — it is a survival requirement. The most successful implementations we have seen follow this priority:
Automate first: Any metric that exists in a structured system (ERP, HRIS, CRM, financial software, 311 systems) should feed into your dashboard automatically via API integration or scheduled data import.
Semi-automate second: Metrics that require human judgment but follow a regular cadence (like initiative status updates or qualitative assessments) should use structured forms with reminders and escalation workflows.
Manual last: Only metrics that genuinely require manual collection — like data from external partners or one-time assessments — should rely on manual entry. Even these should have automated reminders and data validation rules.
ClearPoint's platform handles all three tiers, which is why organizations using it for performance management in government process over 2 million strategic updates per month — with an average update-to-login ratio of 7:1, meaning every session drives real data action, not passive viewing.
Best Practice #7: Review and Refine Quarterly
Your dashboard should evolve as your strategy evolves. The metrics that mattered in January may be irrelevant by July if strategic priorities shift.
Build a quarterly dashboard review into your planning process:
This continuous refinement cycle keeps the dashboard relevant and prevents the gradual decay that turns most dashboards into digital wallpaper.


