We analyzed 20,582 strategic plans. Get a copy of the full report.
Free tool ·
All
Reports per year, hours per report, people involved, hourly rate. One number for your Finance Director, and what it becomes when owners update the system instead of the deck.
Free to use. No account. Email only to export.
52.0%
of 10,046,276 status records carry no result · Jan 2026
61.9%
of named owners never wrote a status update · n = 55,222
40 h → 20 min
one person’s monthly reporting time at Southern Ohio Medical Center after centralizing 400+ scorecards — client statement
128
measures the median organization reports on, across 15 scorecards · n = 593 · Sept 2026
ClearPoint platform data · 2026 snapshots · SOMC figure: client statement
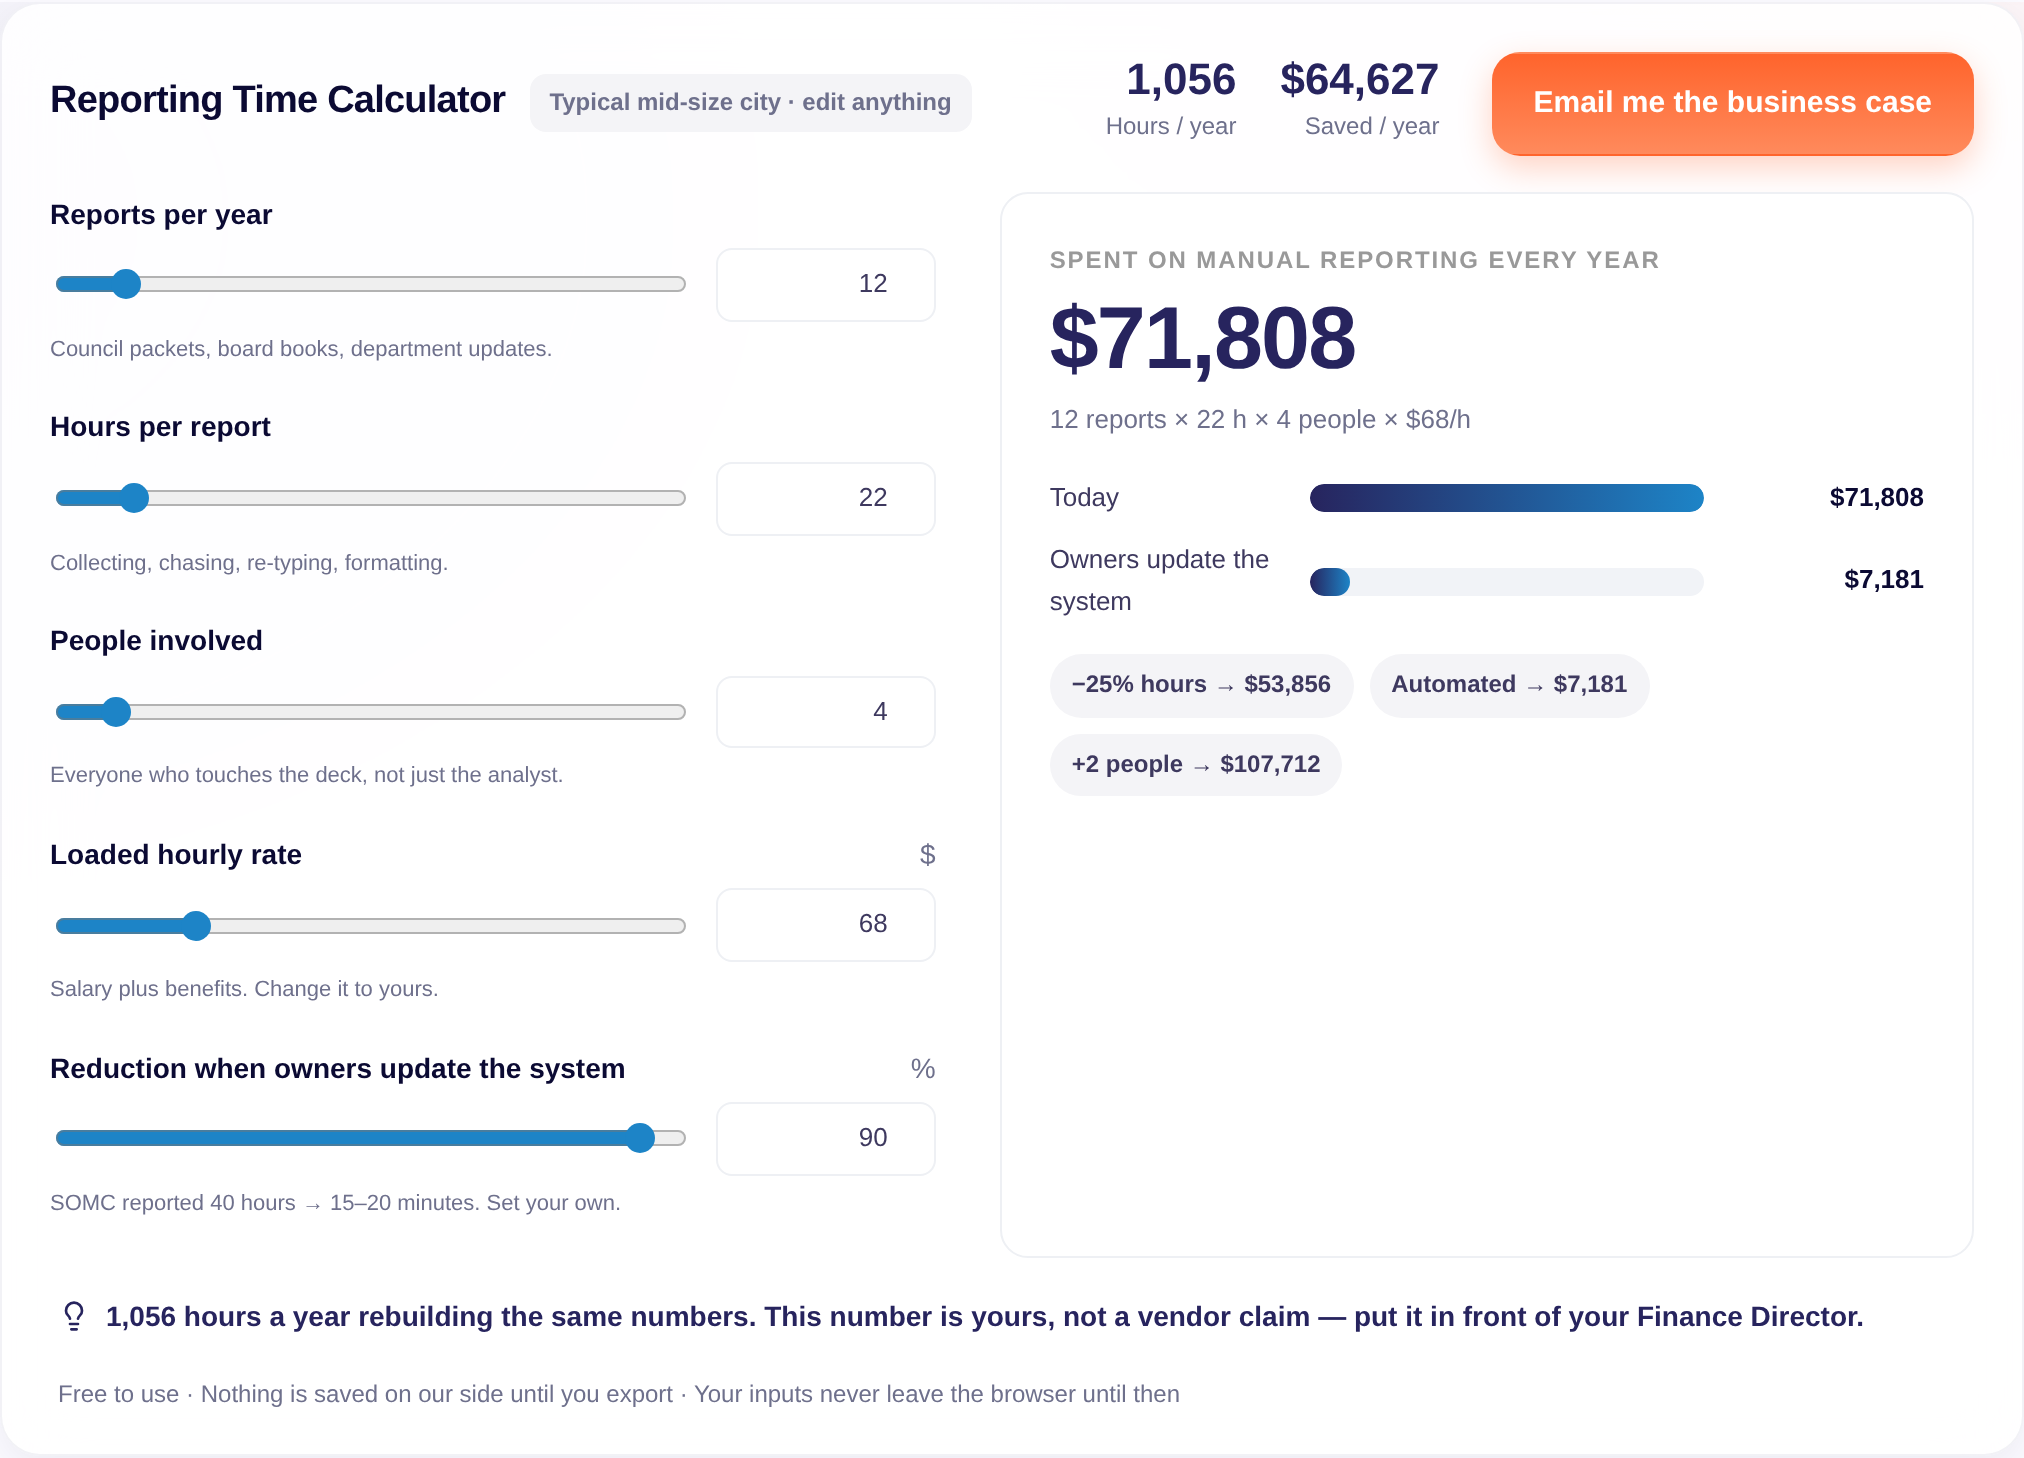
Reports per year × hours per report × people involved × loaded hourly rate. A mid-size city producing 12 packets a year at 22 hours each with 4 people at $68 an hour spends $71,808 a year — 1,056 hours — rebuilding the same numbers. Change any input; the number is yours, not a vendor claim.
Example — a mid-size city (illustrative). 12 reports a year × 22 hours × 4 people × $68 loaded rate = $71,808 a year spent on manual reporting, or 1,056 hours. At a 90% reduction when owners update the system directly, the same reporting costs $7,181.
| Input | Example value |
|---|---|
| Reports per year | 12 |
| Hours per report | 22 |
| People involved | 4 |
| Loaded hourly rate | $68 |
| Reduction when owners update the system | 90% |
| Annual cost today | $71,808 |
| Annual cost, automated | $7,181 |
Reference: input fields
- Reports per year
- Hours per report
- People involved
- Loaded hourly rate
- Reduction when owners update the system
Source: ClearPoint Strategy — https://www.clearpointstrategy.com/free-tools/reporting-time-calculatorWe’ll email a one-page business case with your inputs, your annual cost and the automated scenario. Nothing else, unless you ask.
Nothing is saved on our side until you export.
On its way to your inbox
In a 30-minute session we show what the packet looks like when owners update the system and the report generates itself — on your measures, not ours. Bring your Finance Director.
Why the deck costs what it costs
Because the same numbers are collected again every cycle. Nothing between two meetings asks a specific person for a specific number, so someone chases forty people by email, re-types what comes back, and formats it the week before the council meets. Across the ClearPoint platform, 52.0% of 10,046,276 status records carry no result, and 61.9% of named owners never wrote a status update — which is exactly why the analyst does it for them, by hand.
The report generates itself from the measures owners already update. Southern Ohio Medical Center reported one person going from 40 hours a month to 15–20 minutes after centralizing 400+ scorecards — a client statement, not a platform metric. The calculator’s automated scenario uses a reduction you set; the default is 90%.
This number is yours, not a vendor claim. Put it in front of your Finance Director.
This is a cost calculator: it prices what you spend today and what the same reporting costs when the collection loop disappears. It does not price software, and it applies no benchmark to your result.
Trusted by the teams whose plans are public
“Southern Ohio Medical Center went from one person, 40 hours a month, to 15–20 minutes after centralizing 400+ scorecards in ClearPoint. It’s made huge efficiencies for our team.”
Tiffany LaCoste, Manager of Performance Improvement, Southern Ohio Medical Center — client statement published on clearpointstrategy.com
City of Fort Lauderdale · Durham County · City of Coral Springs · City of Goldsboro · JEA
Yes. Change any input and read the result without an account. Email is asked only when you export the business case.
A CSV of your inputs and result, and a printable one-page business case for your Finance Director.
It is the assumption the calculator uses for the automated scenario. Southern Ohio Medical Center reported going from one person spending 40 hours a month to 15–20 minutes after centralizing 400+ scorecards in ClearPoint — you can set your own reduction.
Use a loaded rate (salary plus benefits) if you want the true cost. The default of $68 is a placeholder — change it to yours.
Because the same numbers are re-collected, re-typed and re-formatted every cycle. Across the ClearPoint platform, 52.0% of status records carry no result — the deck gets rebuilt anyway.
ClearPoint platform data, January and September 2026 snapshots; the SOMC figure is a client statement published on clearpointstrategy.com.
All answers ship as text in the DOM — the accordion only hides them visually.
Method
The calculator multiplies your four inputs; no benchmark is applied. The 90% default reduction is an assumption you control, anchored on a published client statement (SOMC).
10,046,276 status records (keyword flag, a floor) and 55,222 owned metrics, January 2026; 593 organizations, September 2026.
Thirty minutes, your measures, a packet you never rebuild by hand.
Book a 30-min demo
.svg)
