Not convinced a management dashboard is what your organization needs?
- Pull key information from every department's systems into one view. Departments compete for scarce resources, so leaders need the organization's overall priorities in one place.
- Keep the dashboard live and reachable from tablet, phone and laptop. A dashboard printed monthly and filed in a briefcase can't keep pace with the business.
- Show each key project's status, percent complete and milestones. Measures alone won't tell you whether your work on those projects is having the effect you want.
- List action items from previous executive meetings on the dashboard. Without them, meetings repeat the same recommendations and nobody sees whether teams followed through.
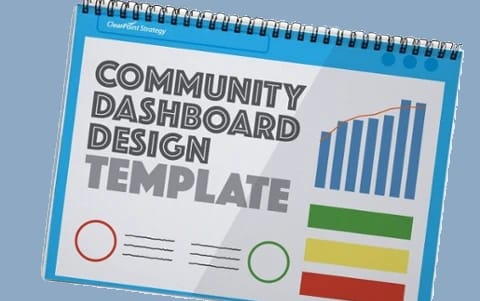
- Browse the dashboard library before you build. Then decide what information you need, how to build it and how it will stay current.
A management dashboard displays the critical information needed to manage an organization in a single location: one page or one screen. It typically lists:
- Goals
- Critical measures
- Projects
- Action items
Some dashboards are graphically inclined, some have tables and data, and others are focused on status indicators. (And some are a combination of all three.) Whatever the look and layout, a dashboard holds the information a leadership team needs to manage an organization.
Below are six reasons you need a management dashboard.
6 Reasons You Need A Management Dashboard
1. It helps you manage the complexity of running a business, municipality, or nonprofit.
An organization “lives” in different departments. For example, if you’re running a municipality, your parks and recreation, public safety, and HR departments all have different data that would fit into a municipal dashboard. Leadership teams from these departments typically come in with competing priorities. A management dashboard can help you understand what is important for the organization as a whole by pulling up the critical few items that will make a difference in your organization. The same goes for a bank or manufacturing organization. Each department is “competing” for scarce resources, and so it is important to have a full view of the organization’s overall priorities.
Southern Ohio Medical Center (SOMC), a 211-bed hospital with more than 40 clinics, handles this with layers. Its summary dashboard shows performance across the organization against five strategic values: Safety, Quality, Service, Teamwork and Finance. Each department has its own dashboard linked to those values. The department dashboards show only the data relevant to that department, which prevents information overload.
2. It allows you to consolidate information from across your organization.
Each department or division is responsible for managing their own information, but all of it leads back to one strategy for the organization. Sending each department a file every once in a while isn’t enough. To keep every department constantly updated (and available for viewing in a number of different ways), you’ll need a management dashboard.
The City of Durham, North Carolina, shows the payoff. Durham moved from 22 Excel files with over 100 tabs to a single system, which removed confusion and improved data quality. Durham also made department directors responsible for their own measures. The system grew from two initial users to over 100 trained employees.
3. With it, you can pull key information from all software applications into one place.
Most organizations have software for finances, customer relationship management (CRM), human resources (HR), process transactions, project management, and more. These applications give the organization a detailed platform for each specific function, but you still need one place to pull key information into. A management dashboard is that place.
Our KPI dashboard best practices put it bluntly: a dashboard that needs manual data entry has an expiration date. Any metric that already lives in a structured system, such as an ERP, HRIS, CRM, financial software or a 311 system, should feed the dashboard automatically through an API integration or a scheduled import. Otherwise the pattern is familiar. The first month, someone updates every metric. The second month, a few get skipped. By month three, the dashboard shows stale data and leadership stops trusting it.
4. It allows you instant access to critical information.
In the past, management dashboards were printed monthly or weekly and kept in a briefcase. With the pace of business today, you need a live and consistently updated dashboard. This strategic information should be constantly accessible from your tablet, phone, or laptop. (Consider this access when thinking about how you will manage your dashboard.)
SOMC makes its ClearPoint data available through a link on the hospital’s intranet, so anyone from the CEO to frontline nursing staff can reach it. All 200+ providers, including physicians, nurse practitioners and physician assistants, also have an individual dashboard with their own performance metrics. Those provider dashboards stay protected inside ClearPoint.
5. It gives you a clear picture of how you’re doing with your key projects.
Some people see dashboards simply as a key set of measures. In our experience, you’ll also want to see how your projects are doing along the way and whether your work on those projects is having the effect you want. (Having a view that shows the status, percentage complete, and key milestones of the project is a nice improvement to a management dashboard.)
A project dashboard view should show each project’s status at a glance, whether you use red-amber-green indicators or another system. Add percent complete and percent of budget spent, and let viewers drill down into each project. Add a short written analysis next to each status, so viewers know why a project is on or off track.
6. It helps you follow through on your management meetings and action items.
When designed correctly, your dashboard should show your action items from previous executive team meetings. This helps you see whether or not your teams are following through on important action items. Without this, you will be wasting a lot of time in management meetings repeating recommendations and not seeing any follow through. (Be sure to look for this functionality when you select dashboard software!)
The City of Fort Collins, Colorado, built its review meetings around shared reports. Each month it reviews different strategic outcomes in 40 to 50-minute meetings, so every outcome is covered each quarter. Two ClearPoint reports, one for metrics and one for initiatives, go out as pre-reading and anchor the discussion. “Standardization of the material is key, as far as having people be able to read and review all the content in these reports,” says Budget Director Lawrence Pollack. As a result of these reviews, Fort Collins no longer sees initiative statuses slipping as the year goes on.
In Conclusion
If you’ve determined that a dashboard is the right step for your organization, you need to ask these questions persistently:
- What information do we need for our dashboard to make managing our organization easier?
- How should we go about building our dashboard?
- How can we ensure that our dashboard stays up to date?
For the first question, start with decisions, not metrics. Ask who the audience is, what decisions they will make and how often they will look. Then keep the front page short: the same guide suggests three to five North Star metrics up front, 8–12 supporting indicators that explain why those metrics move, and everything else one click away.
Return to these questions to stay on track.
Common questions