
.png)
Get answers like this one, first.
Google’s AI Overviews now favor the sources you choose. Add ClearPoint once, and our research shows up in your AI answers — badged and prioritized.
Add ClearPoint as a Preferred SourceFree · one click · applies only to your own Google results.

This post exposes the hidden cost of outdated tools and how smart organizations are breaking free with real-time data, AI, and systems that actually drive execution.
Picture this: You're in your third strategy meeting of the week. Someone's clicking through a 47-slide PowerPoint deck filled with bullet points that somehow manage to say everything and nothing at the same time. Meanwhile, Karen from Finance is furiously updating a spreadsheet that has more hidden errors than a Where's Waldo book.
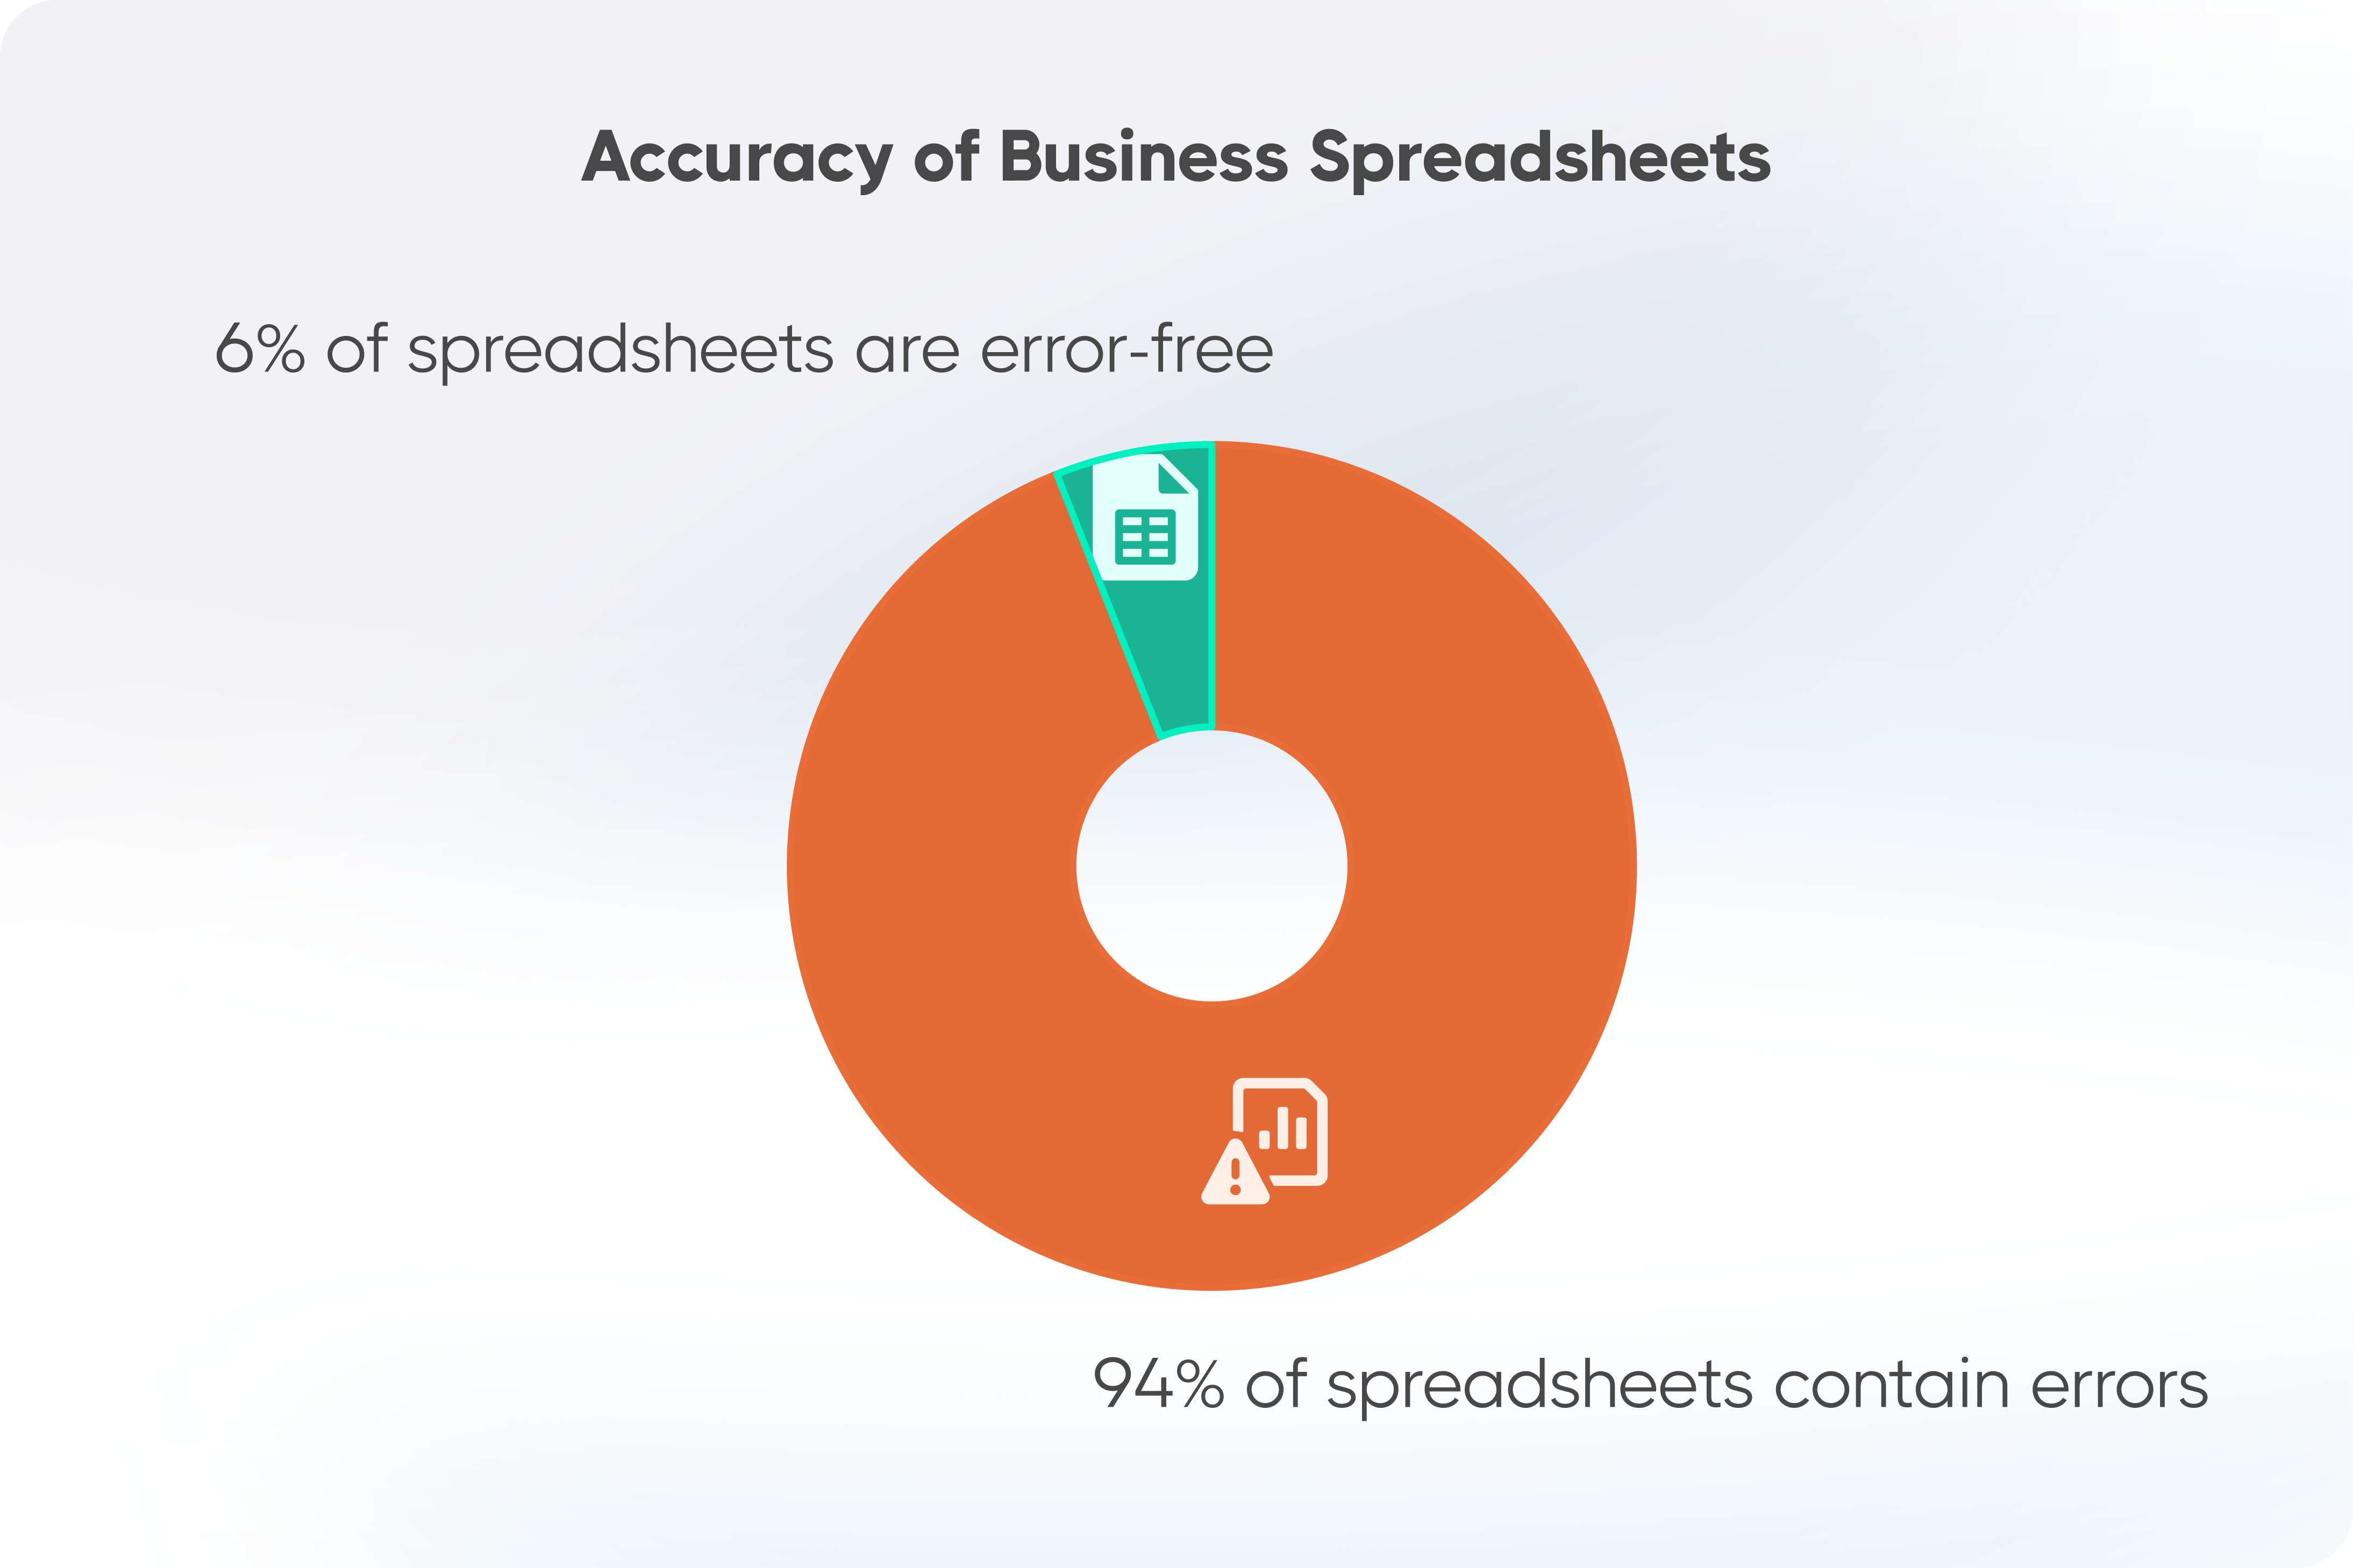
- A 2024 study reviewing 35 years of research found 94% of business spreadsheets contain errors, not typos, but mistakes that corrupt decisions.
- PowerPoint forces oversimplification; cognitive load research shows working memory handles only a few items, so slides flatten complex strategy.
- Hidden costs add up: knowledge workers average 2.5 hours a day on presentations, time spent on corporate theater instead of decisions.
- The fix is not banning spreadsheets and presentations, but using them as tools rather than crutches for real strategy work.
- AI's real advantage is better decisions, not better-looking slides, analyzing data to fuel strategy instead of filling cells.
Sound familiar? Of course it does. Because this is how business gets done in 2025—or at least how we pretend it gets done while our actual strategy slowly bleeds out on the conference room floor.
Here's the brutal truth: while you're perfecting your slide transitions and color-coding your Excel cells, nimbler competitors are using AI to analyze data in real-time, make decisions in minutes instead of months, and actually execute on their strategies instead of just presenting them.
In this post, we're going to expose the dirty secret everyone knows but nobody wants to admit: our addiction to spreadsheets and presentations isn't just slowing us down—it's actively destroying our ability to compete. And the numbers? They're worse than you think.
The $2.8 Billion PowerPoint Problem Nobody Talks About
Let's start with a number that should make your CFO weep: 94%. That's the percentage of business spreadsheets that contain errors, according to a 2024 study that reviewed 35 years of research on spreadsheet quality. Not typos. Not formatting issues. Actual, money-losing, decision-destroying errors.
TransAlta, a major power company, lost $24 million because of a simple copy-paste error in Excel. Kodak had to revise earnings by $9 million due to spreadsheet mistakes. Fannie Mae understated stockholders' equity by $1.1 billion—yes, billion with a 'B'—because someone botched a formula.
But my personal favorite? Fidelity's Magellan fund accidentally treated a $1.3 billion loss as a gain because someone forgot a minus sign. That's not a clerical error. That's a $2.6 billion swing based on a single keystroke.
And these are just the errors that got caught and made public. Imagine how many silent killers are lurking in your organization's spreadsheets right now, slowly poisoning every strategic decision you make.
Death by a Thousand Bullet Points
Now let's talk about PowerPoint, the Swiss Army knife of corporate tools—if Swiss Army knives were designed to slowly lobotomize their users.
Research on cognitive load theory shows something fascinating: our working memory can only handle 3-4 pieces of information at once. Not seven, as older research suggested. Three to four. Yet the average corporate PowerPoint slide contains 40 words, and presentations routinely run 30+ slides.
Do the math. Actually, don't—you'll probably do it in Excel and get it wrong.
Here's what the research actually shows:
- When slides contain both text and complex diagrams, engagement drops so dramatically that viewers absorb almost nothing from the visuals
- Reading text from slides while someone is speaking creates "redundancy effect"—your brain literally can't process both streams of language simultaneously
- The more words on a slide, the less people remember. Period.
But here's the real kicker: we know all this, and we keep doing it anyway. Why? Because of two management concepts that explain everything wrong with corporate America: the Peter Principle and the Innovator's Dilemma.
39 Clues You’ve Outgrown Excel and PowerPoint.
The Peter Principle Meets PowerPoint: A Love Story
Remember the Peter Principle? People rise to their level of incompetence. Well, here's how it plays out in the age of PowerPoint and Excel:
Sarah is a brilliant analyst. She creates insightful spreadsheets that actually help the business make better decisions. So naturally, she gets promoted to management, where she spends her time creating PowerPoint decks about other people's spreadsheets. She's now incompetent at her job, but she's really good at making slides about it.
This cascade effect compounds throughout the organization. The people who are best at doing actual work get promoted into positions where they present about work. The presenters get promoted to positions where they present about presentations. Eventually, you have an entire C-suite that's world-class at PowerPoint but couldn't analyze their way out of a paper bag.
Clayton Christensen warned us about this in the Innovator's Dilemma. Successful companies fail because they're too busy optimizing what made them successful in the past to notice the future eating their lunch. In our case, we're so busy perfecting our spreadsheet models and slide decks that we don't notice our competitors using AI to make decisions in real-time.
The Hidden Cost of "Looking Professional"
Here's a fun exercise: Calculate how much time your organization spends on PowerPoint. Go ahead, I'll wait. And if you need some help, here are some averages:
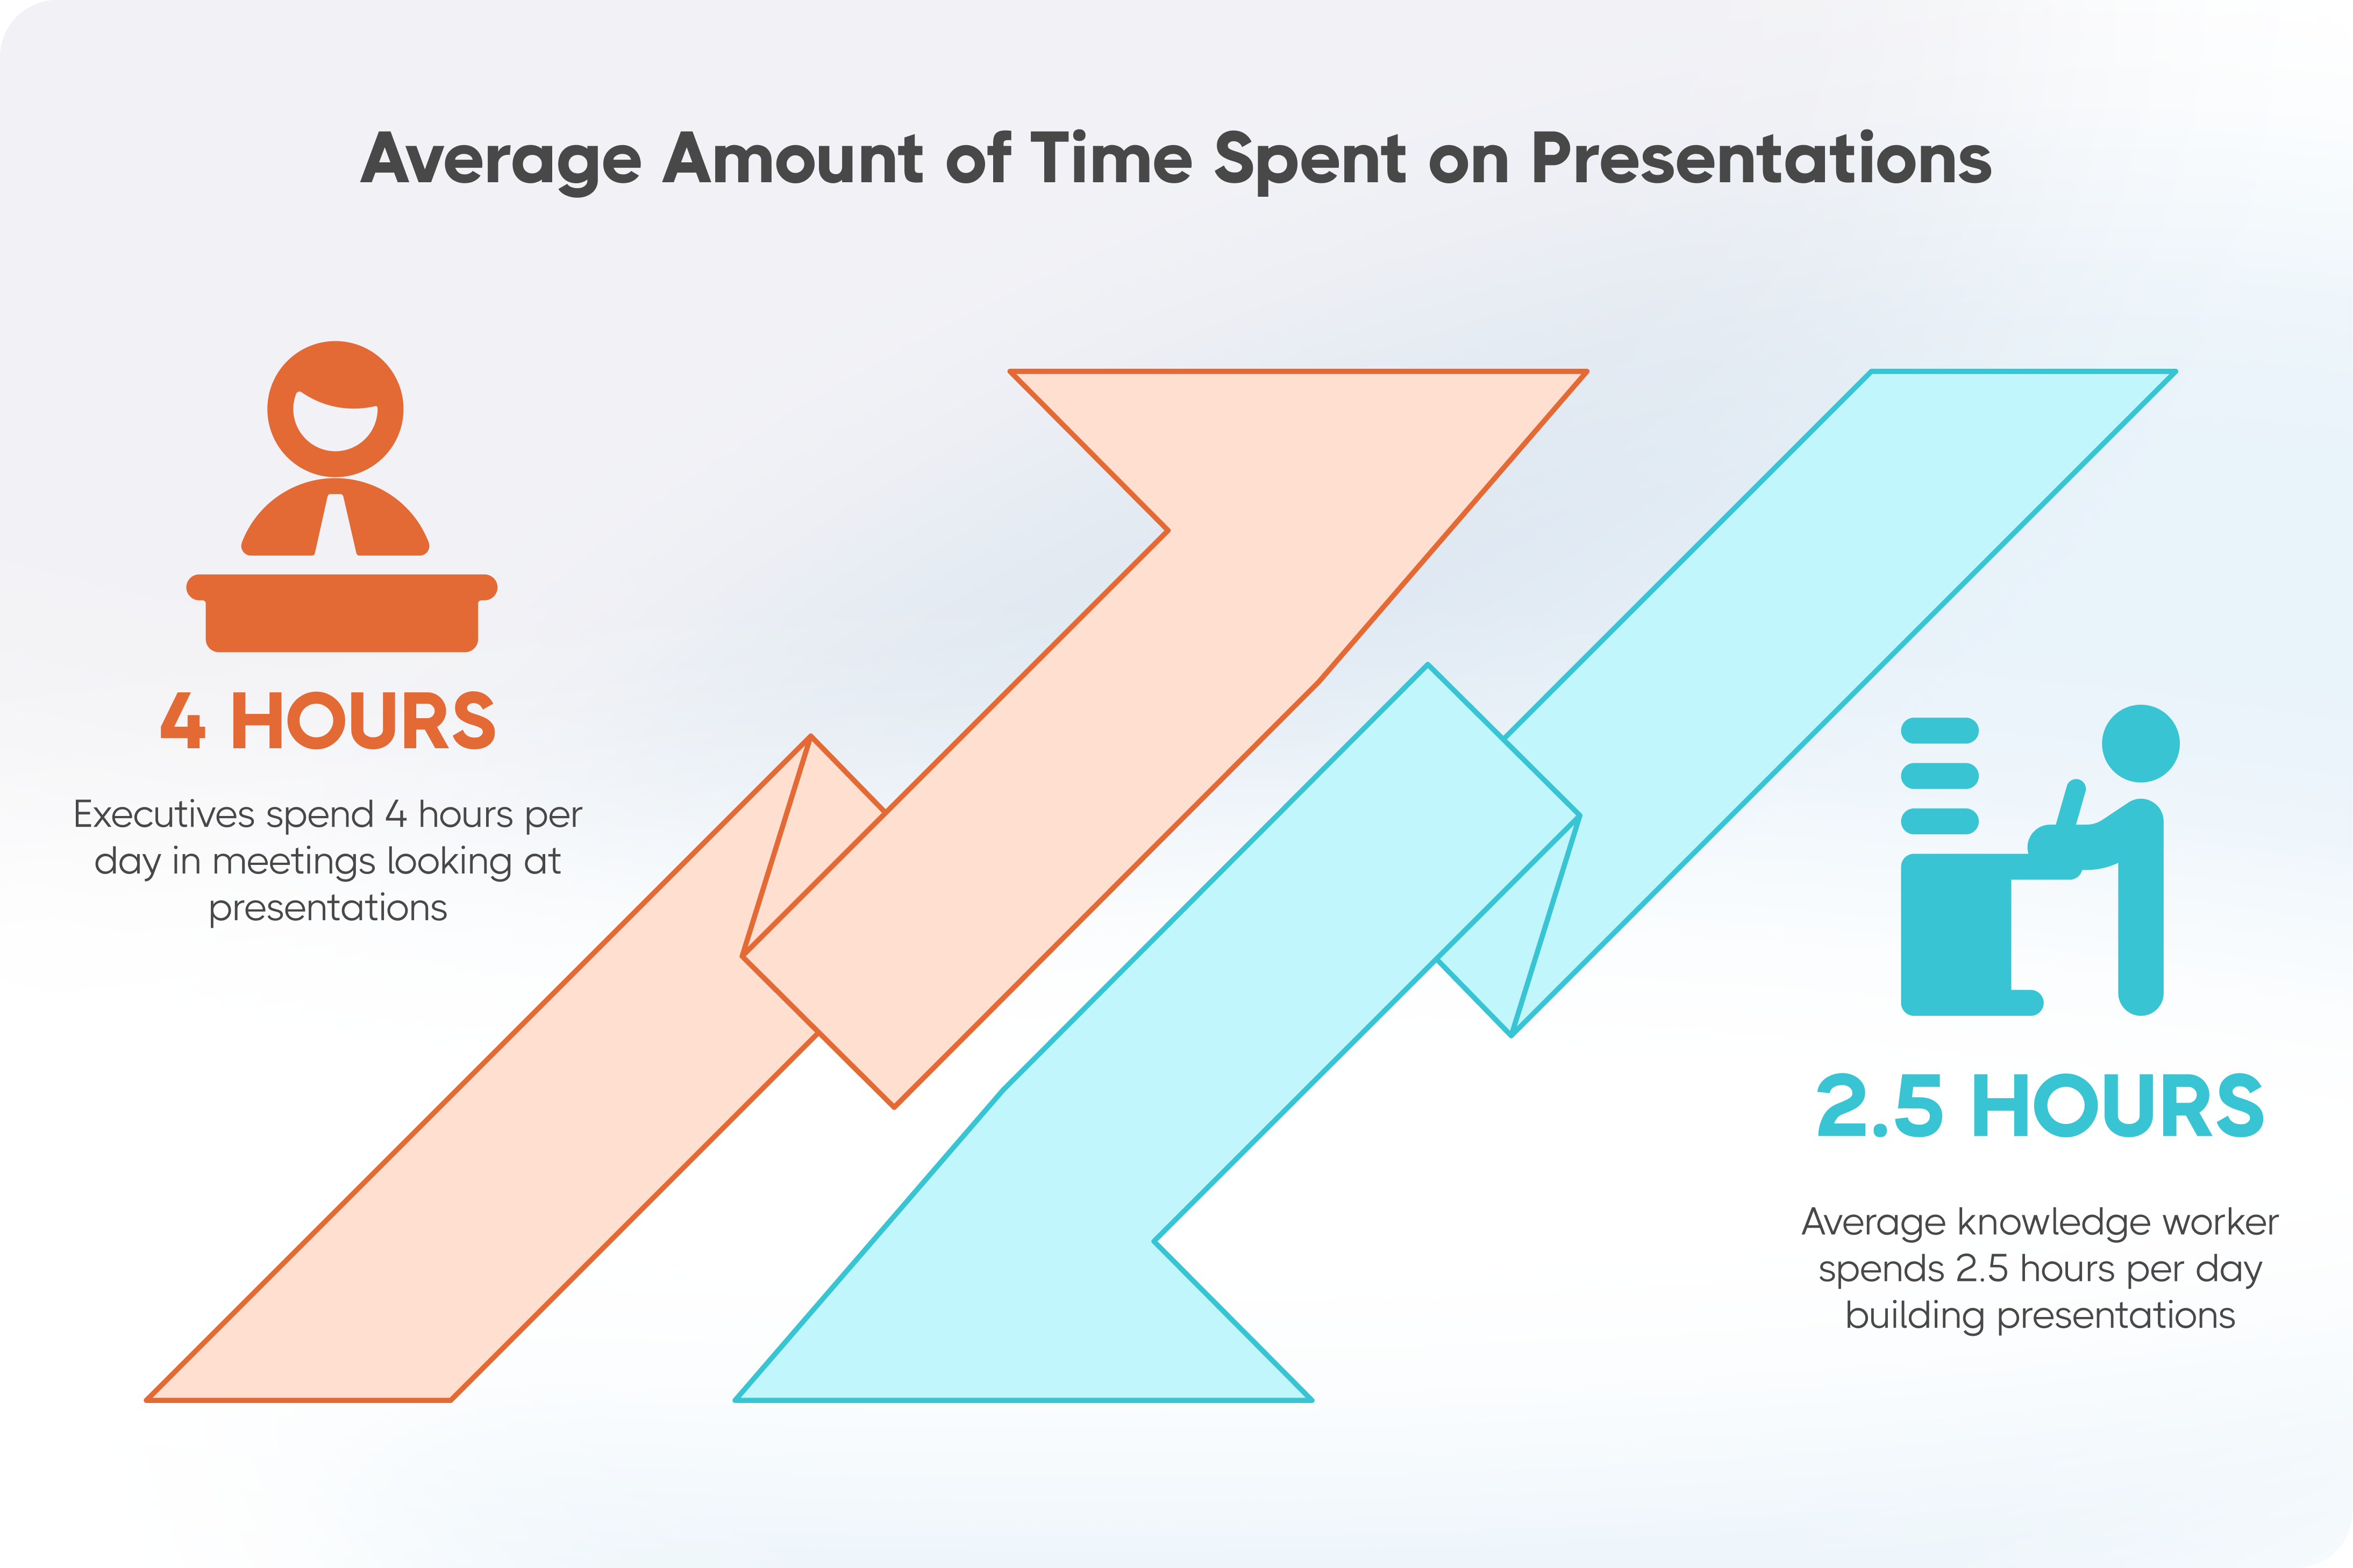
- Average knowledge worker spends 2.5 hours per day on presentations
- Average executive spends 4 hours per day in meetings looking at presentations
- That's 30% of your payroll going to PowerPoint
But time isn't even the real cost. The real cost is what I call "strategic suffocation"—the slow death of actual thinking under the weight of formatted bullet points.
When everything needs to fit on a slide, complex ideas get reduced to catchphrases. Nuance dies. Critical thinking is replaced by template thinking. "If it doesn't fit on a slide, it doesn't exist" becomes the unspoken rule.
The AI Revolution You're Missing While You Format Cells
While you're still arguing about whether to use pie charts or bar graphs, here's what your competition is doing:
<div class="card-stack"><div class="card-stack-card">Real-time Analysis: AI tools can analyze millions of data points in seconds. Your Excel spreadsheet with 10,000 rows? That's cute. Modern AI laughs at your pivot tables.</div><div class="card-stack-card">Dynamic Visualization: Instead of static PowerPoint slides, AI creates interactive dashboards that update in real-time. Your quarterly business review deck was outdated before you finished making it. </div><div class="card-stack-card">Natural Language Queries: "Show me our top-performing products by region with weather correlation." Try doing that in Excel without spending three days and creating seventeen helper columns. </div><div class="card-stack-card">Automated Insights: AI doesn't just show you data; it tells you what matters. While you're still formatting conditional highlighting, AI has already identified the three anomalies that could tank your quarter. </div></div>
But here's the thing—it's not really about the technology. It's about what the technology represents: a fundamental shift in how decisions get made.
The Simplification Trap That's Killing Your Strategy
Remember high school when your teacher said, "Explain it like I'm five"? That was good advice for high school. It's terrible advice for running a complex business.
Yet that's exactly what PowerPoint forces us to do. Every strategic initiative gets boiled down to three bullet points. Every complex market dynamic becomes a 2×2 matrix. Every nuanced competitive threat gets reduced to a SWOT analysis that hasn't changed since 1987.
This isn't communication—it's lobotomization. We've confused clarity with simplicity, and in the process, we've created a generation of leaders who can only think in slides.
The research is damning:
- Simplified bullet points create "illusion of understanding"—people think they get it when they don't
- Breaking complex ideas into slides destroys the connections between concepts
- The linear nature of presentations forces artificial narrative structures onto non-linear problems
In other words, PowerPoint isn't just bad at communicating strategy—it actively prevents strategic thinking.
Breaking Free: What Actually Works
Enough doom and gloom. Let's talk solutions. Here's how the smart companies are breaking free from spreadsheet hell and PowerPoint purgatory:
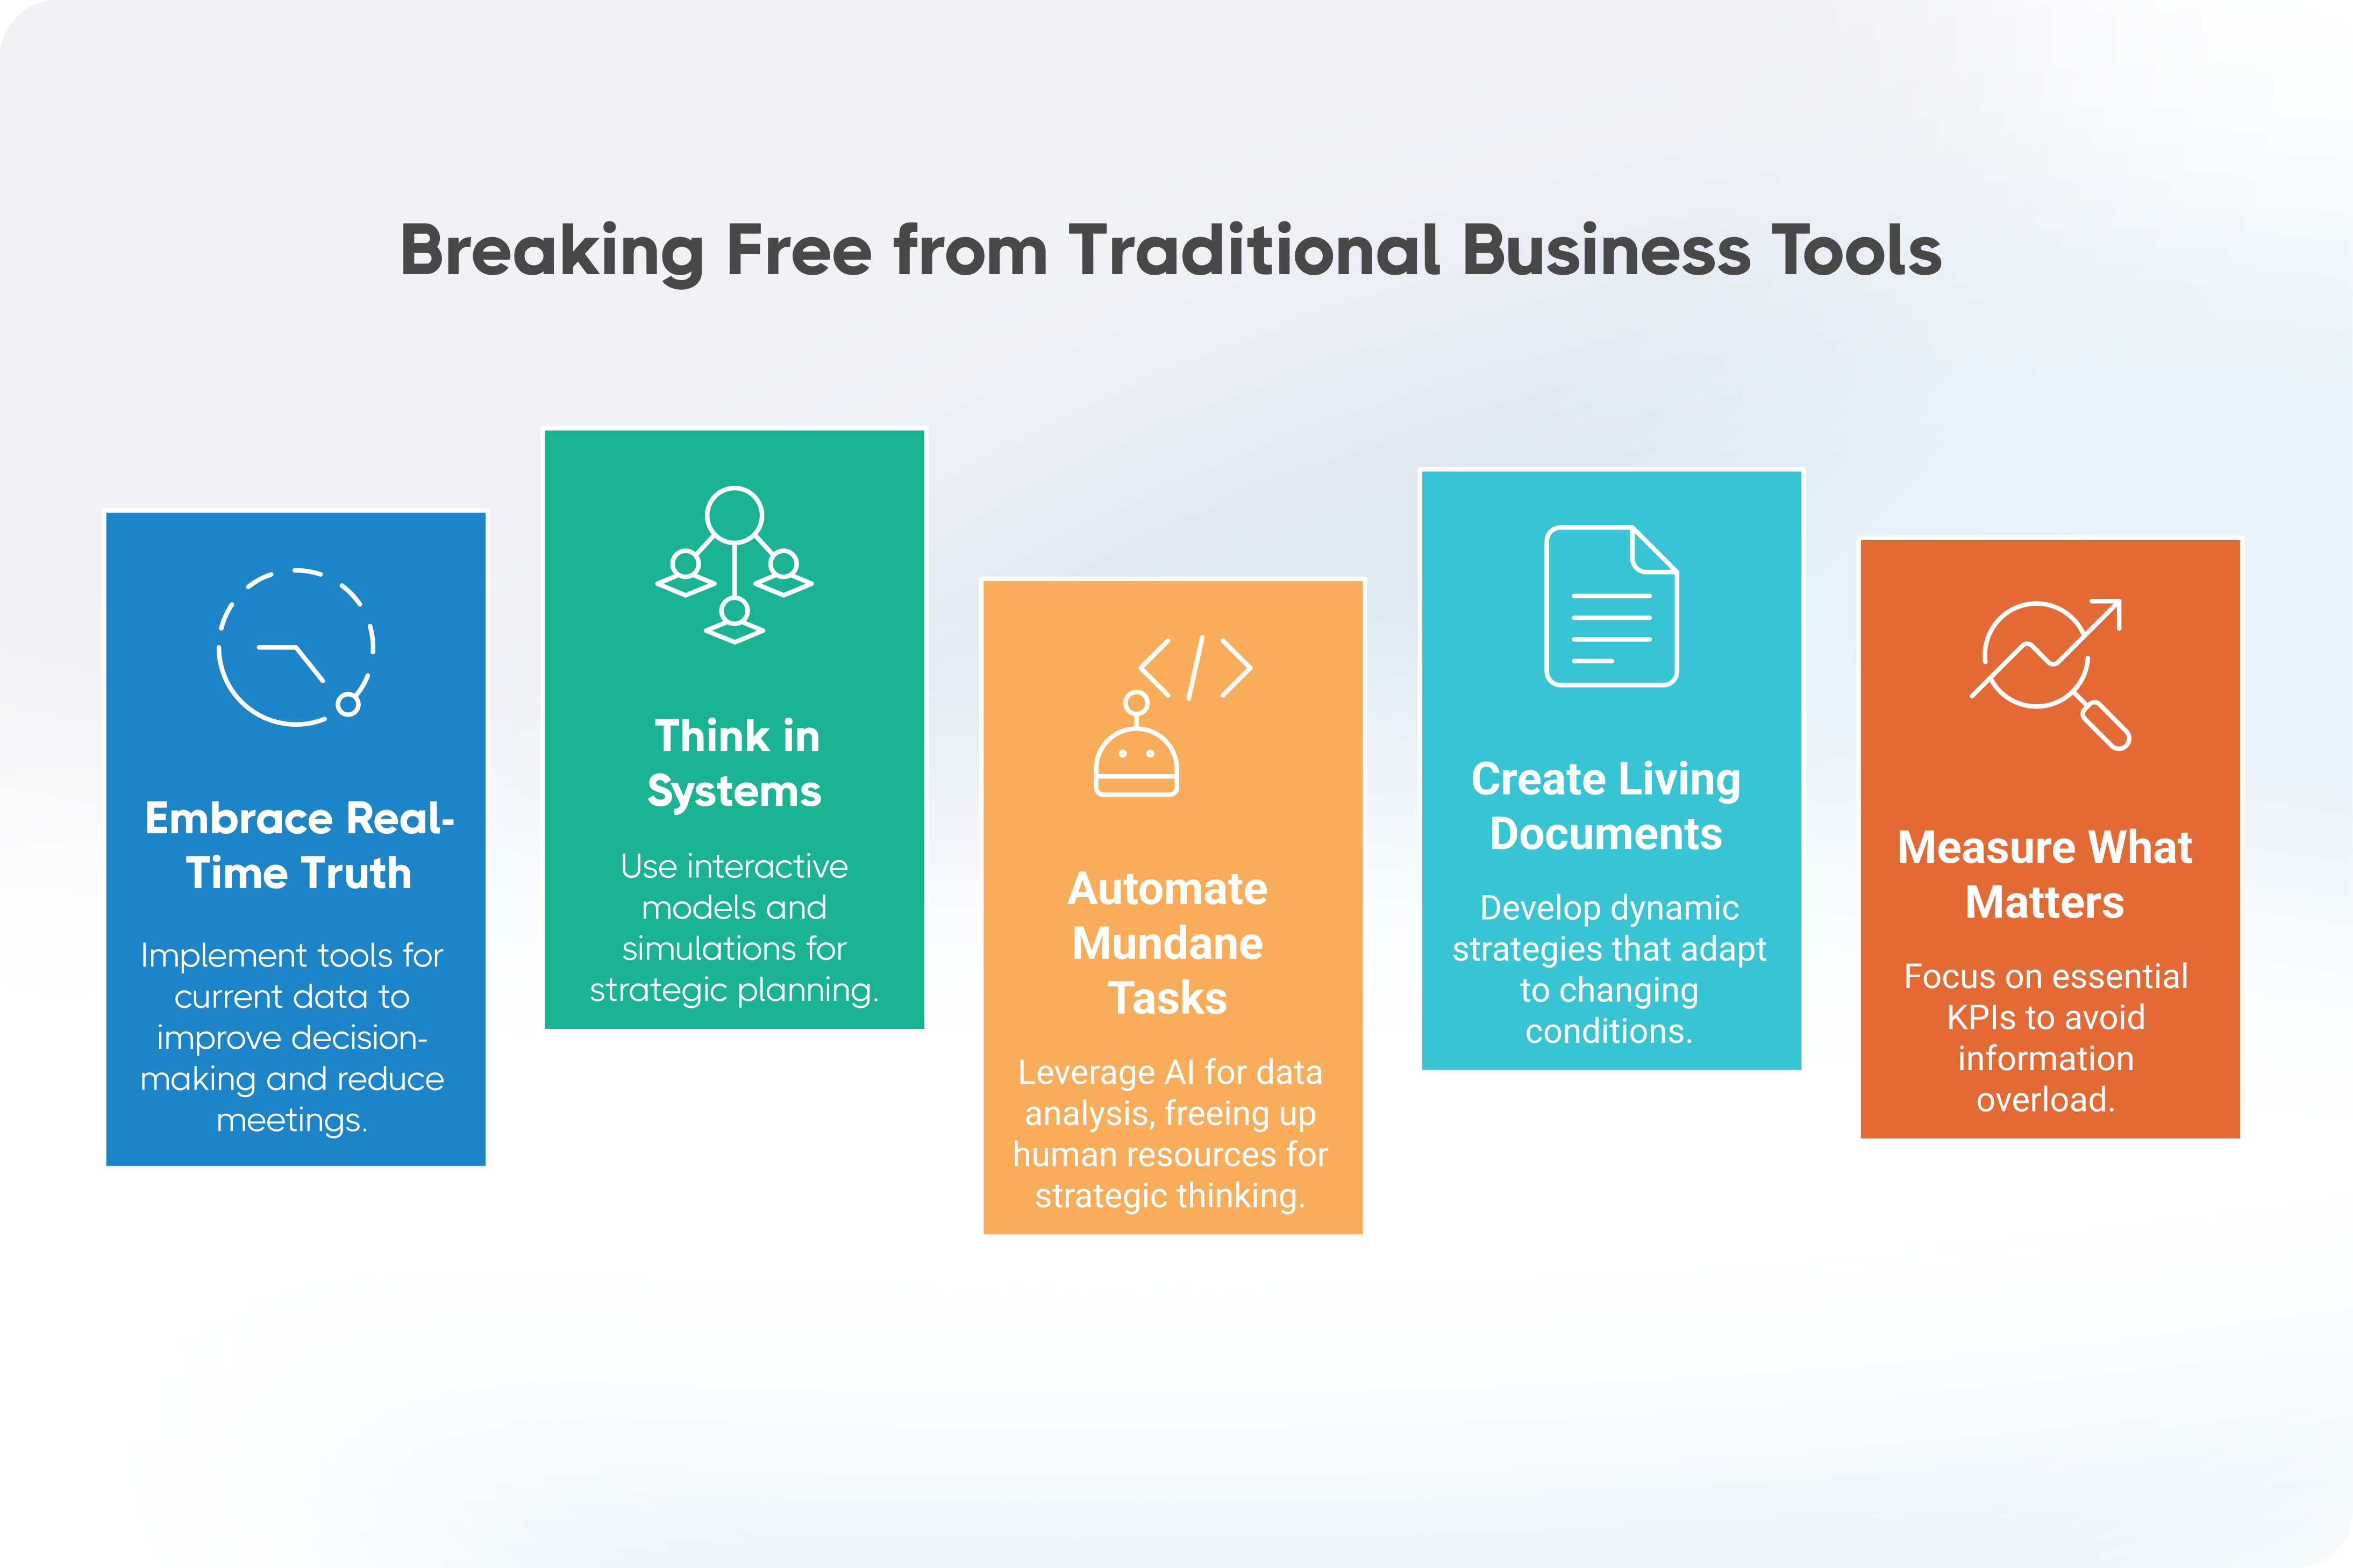
<div class="index-cards"><div class="index-card"><div class="index-card-title">1. Embrace Real-Time Truth</div><div class="index-card-content"><p>Kill the quarterly deck. If your data is three months old, it's not data—it's history. Implement tools that show you what's happening now, not what happened last quarter. </p><p>Companies using real-time dashboards report:</p><ul><li>73% faster decision-making</li><li>45% fewer meetings (because the data speaks for itself)</li><li>90% reduction in "update" presentations</li></ul></div></div><div class="index-card"><div class="index-card-title">2. Think in Systems, Not Slides</div><div class="index-card-content"><p>Your business doesn't operate in bullet points. Why should your strategy?</p><p>Replace linear presentations with:</p><ul><li>Interactive models that show cause and effect</li><li>Simulation tools that let you test scenarios</li><li>Visual systems that maintain complexity while improving clarity</li></div></div><div class="index-card"><div class="index-card-title">3. Automate the Mundane, Humanize the Strategic</div><div class="index-card-content"><p>Here's what AI should do: crunch numbers, identify patterns, surface anomalies.</p><p>Here's what humans should do: think, debate, decide. </p><p>If you're spending more time formatting than thinking, you're doing it wrong.</p></div></div><div class="index-card"><div class="index-card-title">4. Create "Living Documents"</div><div class="index-card-content"><p>Static presentations are like photographs of a movie—they capture a moment but miss the story. </p><p>Instead, create: </p><ul><li>Dynamic strategies that update as conditions change</li><li>Interactive plans that show multiple scenarios</li><li>Collaborative platforms where ideas evolve in real-time</li></ul></div></div><div class="index-card"><div class="index-card-title">5. Measure What Matters (And Only What Matters)</div><div class="index-card-content"><p>Remember our working memory limit of 3-4 items? Apply it ruthlessly.</p><p>If you're tracking 47 KPIs in a spreadsheet, you're not tracking anything. You're just creating noise that drowns out signal. </p></div><div></div>
The Competitive Reality Check
Here's the uncomfortable truth: While you're perfecting your PowerPoint, someone else is eating your lunch. They're not smarter than you. They're not working harder. They're just not wasting 30% of their time on corporate theater.
Take Tesla. While traditional automakers were creating beautiful presentations about why electric cars couldn't work, Tesla was building them. No 100-slide decks. No complex Excel models proving it was impossible. Just execution.
Or look at Amazon. Bezos famously banned PowerPoint in favor of written narratives. The result? One of the most strategically successful companies in history. Coincidence? I think not.
The Path Forward: From Presentation to Implementation
The solution isn't to ban all spreadsheets and presentations. That would be like banning food because some people overeat. The solution is to use them appropriately—as tools, not crutches.
Here's your action plan:
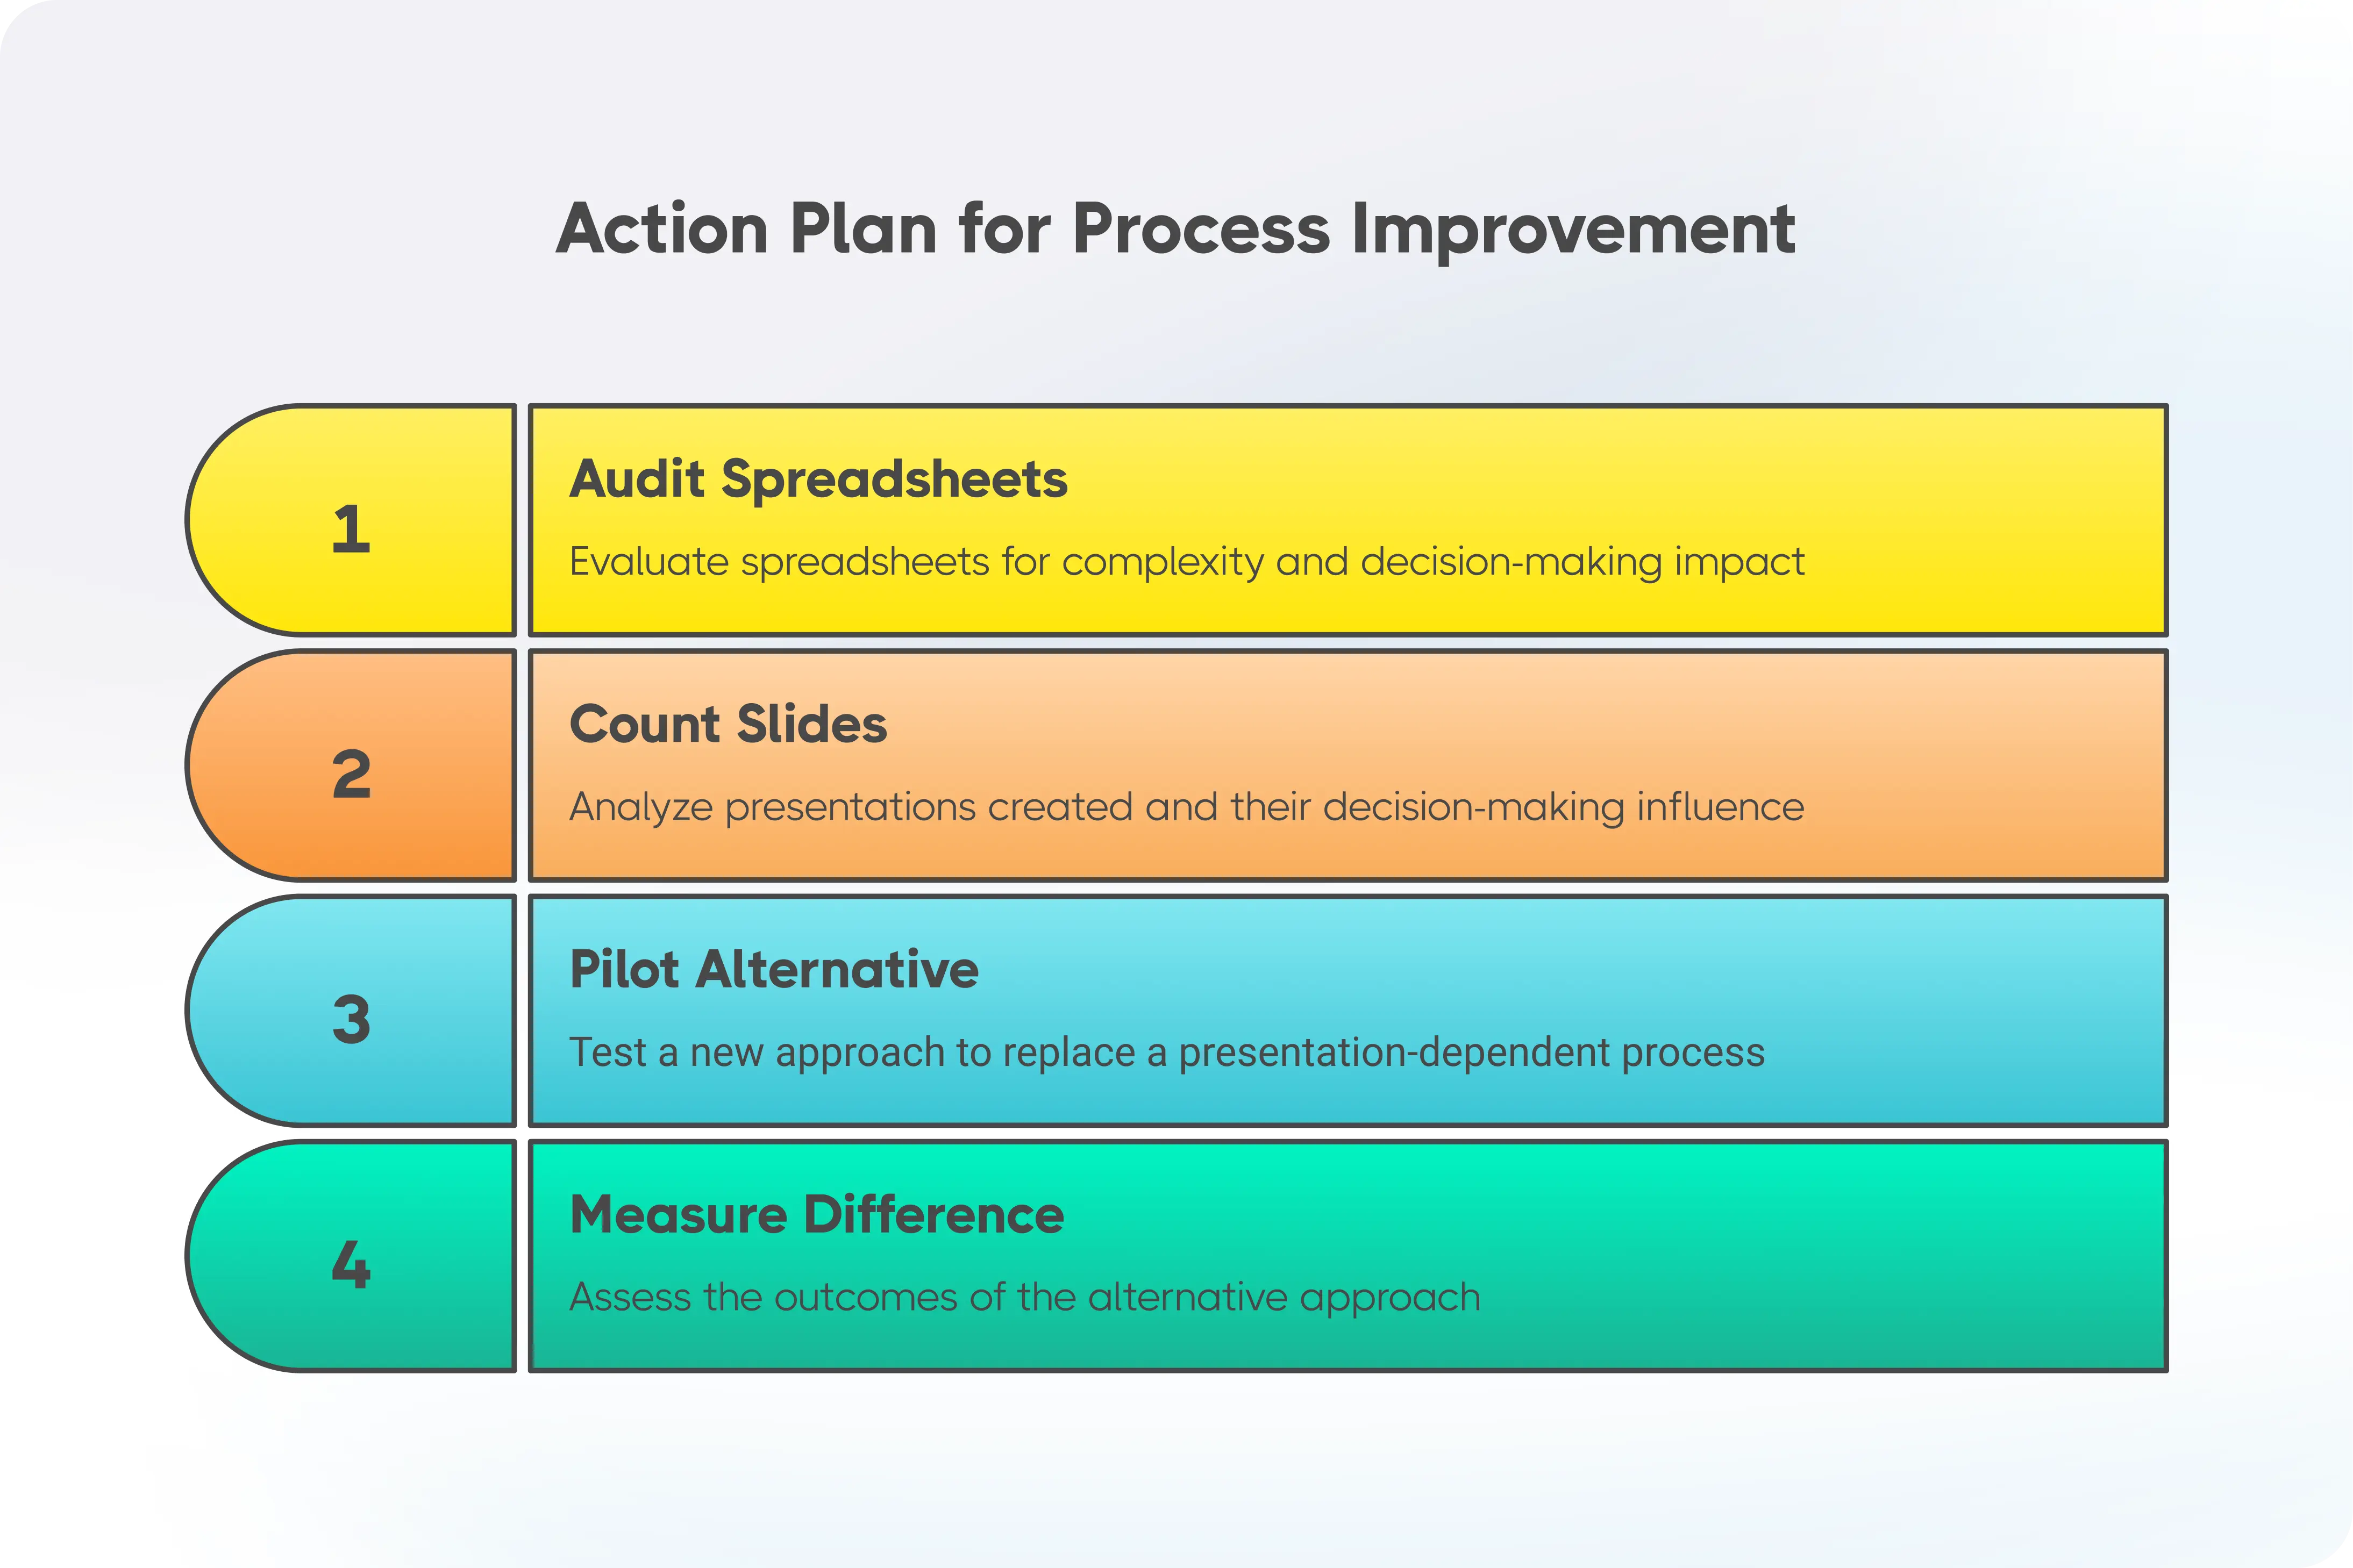
- Week 1: Audit your spreadsheets. How many contain formulas no one understands? How many are updated manually? How many drive actual decisions versus just creating busy work?
- Week 2: Count your slides. How many presentations were created last month? How many drove actual decisions? What's your slide-to-decision ratio?
- Week 3: Pilot an alternative. Pick one process that currently requires a presentation and try something different. A written narrative. An interactive dashboard. A working session instead of a presentation.
- Week 4: Measure the difference. Time saved. Decisions made. Errors avoided. Let the data speak for itself (just don't put it in PowerPoint).
The Bottom Line: Choose Your Weapon Wisely
Spreadsheets and presentations aren't inherently evil. They're tools. But when your only tool is a hammer, everything looks like a nail. And when your only tools are Excel and PowerPoint, everything looks like a cell or a slide.
Ready to Break Free from Spreadsheet Chaos? Get a free demo of ClearPoint.
The companies that will win in the next decade are the ones that break free from this prison. They'll use AI not to make better presentations, but to make better decisions. They'll use data not to fill spreadsheets, but to fuel strategy. They'll communicate not through bullet points, but through clarity.
The question is: Will you be one of them?
Or will you still be sitting in that conference room, watching Karen update her spreadsheet while someone drones through slide 47 of 62, slowly bleeding out while your competition runs circles around you?
The choice is yours. But choose quickly. Because while you're thinking about it, someone else is already doing it.
And they're not making a PowerPoint about it.


