Report Progress To Your Council Or Board Without The Spreadsheet Chase

 We used to waste days chasing spreadsheets. Now, our dashboards update themselves, reports drill into real metrics, and decisions actually get made.”

Five out of five star customer rating
Headshot of Laura Mazur, Senior Strategy Analyst
Laura Mazur
Senior Strategy Analyst
ClearPoint Q2 Review workflow tracking update completion with a progress donut, trend chart and per-owner task counts
Microsoft Excel logo
3-Week Setup
Migrate your reporting frameworks from spreadsheets, fully operational in 3 weeks.
Microsoft Power BI logoSnowflake logoMicrosoft SQL Server logo
Custom Frameworks
Match your strategy, reporting, and organization structure with flexible templates.
SOC 2 Type 2 badge
SOC2 Certified Security
Granular permissions, full compliance, and enterprise-grade safeguards.

Proof

The 70% is a real number — here's whose it is

Southern Ohio Medical Center

40 h → 20 min 400+ scorecards

Southern Ohio Medical Center used to need one person, 40 hours a month, to populate report data everywhere it had to go. After centralizing 400+ scorecards in ClearPoint — accessible from the CEO's office to the frontline nursing station — that process takes 15-20 minutes: "It's made huge efficiencies for our team."

Tiffany LaCoste, Manager of Performance Improvement; process rebuilt with David Richard, Director of Performance Improvement and Clinical Information Systems

The Choctaw Nation of Oklahoma

The same play at tribal-government scale: "This system keeps you finding operational efficiencies. Several of these opportunities have resulted in millions of dollars in savings!"

Brandie Holloway, Director of Strategy

Across ClearPoint's platform — 410 active organizations, 15,902 live plans — reports are a live view of tracked work, not a document rebuilt by hand each month.

AI ASSISTANTS

AI That Feels Like A Strategy Analyst, Not Just a Bot

From surfacing red flags to summarizing metrics,
‍ClearPoint AI Assistants help you think, plan, and adapt faster.

ClearPoint initiative page in dark mode with owner, analysis, milestones, Gantt chart and a dated analysis history panel

Build Your Reports

Create step-by-step milestones to build a quarterly business performance report.
ClearPoint AI
  • Week 1: Assess Current Process,
  • Week 2-3: Define Success Metrics
  • Week 4-5: Outline 30/60/90 Day Plan
Can you add a 4th milestone?
ClearPoint AI

Certainly! Here is a 4th milestone for this initiative:
Week 5: Design visualizations and finalize the report for executive review.

Spot Misalignment

Can you check this report for duplicated KPIs across teams?
ClearPoint AI

Duplicate: Expansion Sales tracked by Customer Success and Sales Ops.

Are there any
conflicting targets?
ClearPoint AI

Sales team targets 20% growth, but Operations capacity plan supports only 10% increase.

Summarize for Stakeholders

Summarize this report for an executive or board-level audience.
ClearPoint AI

‍Revenue is up 10%, but employee turnover has spiked. Recommend focusing on retention in Q2.

What strategy should we consider to improve retention?
ClearPoint AI
  • Consider launching an employee recognition program to boost engagement.
  • Baseline compensation against peer groups
plans built in real time

Software That Adapts To Your Unique Needs

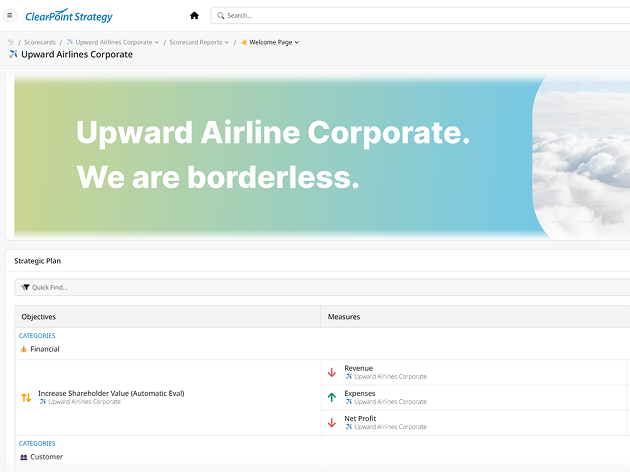
ClearPoint Welcome Page with company banner, mission, values and strategic plan table (Upward Airlines demo data)ClearPoint Objectives page with chart tiles for revenue, variance, expenses, cost per flight and other measures

The ClearPoint Strategy team pushed us. They’re setting dates and goals for you, just like you are with your team, and that’s what brought it together.”

Steve Sones
Chief Administration Officer
From Data to Insights in Minutes – Summarizes trends and progress instantly.
Fits Your Framework – Matches your real KPIs and goals to build a full report.
Adapts as You Go – Rewrites itself as your metrics update.
Guided Setup and Support

Seems Like Too Much Work?
‍We'll Handle It

Smiling support specialist wearing a headset during a call

Whether you’re starting from scratch or bringing in an existing plan, ClearPoint gets you up and running without the busywork.

Cascade Strategy to Departments?
We’ll push reports and KPIs to every team.
Already in Excel?  

We’ll import, clean, and correct your data.
Need a New Plan?

AI builds reporting-ready plans for you.
Don’t Want to Start from Zero?
We’ll set everything up for you.

No Need for Strategy Consultants: ClearPoint sets everything up for you, even if you don’t have a reporting framework defined.

Want to see how it works?
Book a Free Demo
Workflows

Workflows That Catch What
You’d Never Spot Manually

ClearPoint automates the parts of reporting that slip through the cracks,
so your team stays aligned without micromanagement.

ClearPoint My Workspace with a costs by division chart, a revenue chart and Q2 Review updates

KPI Status Change Alert

Send an email to the goal owner when KPI status switches to “off-track.”
ClearPoint discussion panel with a comment @-mentioning the project owner about a project running behind schedule

Behind Schedule Warning

Alert department head if a project falls behind schedule.
ClearPoint My Workspace showing a Q2 Review checklist of measures and objectives to update

Auto Dashboard Update

On scheduled data upload, auto-run calculations and update all charts and dashboards.
ClearPoint measure report listing measures with status arrows, their linked objectives and owners

Next Period Rollover

At new period start, copy forward all info and lock the previous period.
Quarterly Board Report briefing book in a PDF viewer, with page thumbnails and a dashboard page of revenue and profit charts

One-Click Briefing Book

Send update requests, pre-reads, and create the briefing book with one click.
ClearPoint board grouping objectives into economic, social and technological factor columns, each with a status arrow

Quarter-End Review

Conduct PESTLE, SWOT, or VRIO on results and revise strategy if needed.
See Custom Workflows
Book a Free Demo
Want custom workflows? We’ll build them with you (no devs needed.)
Council & Board Reporting

The Quarterly Progress Report,
Built From Live Data

(without opening spreadsheets ever again!)

From executive dashboards to frontline tasks. ClearPoint gives you full visibility into how your strategy is performing across every level, every department.

Executive Dashboards

Monitor KPI health across teams with real-time, high-level views.
ClearPoint initiatives list with the Advanced Filters panel open, filtering by status and owner

Scorecards

View KPIs, owners, and trendline side-by-side always up to date.
ClearPoint Q2 Review workflow in dark mode with overall completion, a tasks-completed trend and progress by owner

Kanban Boards

Visualize task progress and spot bottlenecks at a glance.
ClearPoint Gantt chart report listing initiatives and their milestones on a monthly timeline

Goal Alignment View

Drill down from org-level goals to individual team actions in seconds.
ClearPoint dashboard in dark mode with a project status donut, strategic plan table, measure charts and a Gantt chart

Custom Views

Build reports filtered by team, region or any custom dimension.
ClearPoint measures view with KPI chart tiles such as donut, gauge, area and bar charts, plus a column layout picker
Executive Dashboards
Monitor KPI health across teams with real-time, high-level views.
Scorecards
View KPIs, owners, and trendline side-by-side always up to date.
Kanban Boards
Visualize task progress and spot bottlenecks at a glance.
Goal Alignment View
Drill down from org-level goals to individual team actions in seconds.
Custom Views
Build reports filtered by team, region or any custom dimension.
Executive Dashboards
Monitor KPI health across teams with real-time, high-level views.
Scorecards
View KPIs, owners, and trendline side-by-side always up to date.
See Scorecards
Kanban Boards
Visualize task progress and spot bottlenecks at a glance.
Goal Alignment View
Drill down from org-level goals to individual team actions in seconds.
Custom Views
Build reports filtered by team, region or any custom dimension.
Executive Dashboards
Monitor KPI health across teams with real-time, high-level views.
Scorecards
View KPIs, owners, and trendline side-by-side always up to date.
Kanban Boards
Visualize task progress and spot bottlenecks at a glance.
See Kanban Boards
Goal Alignment View
Drill down from org-level goals to individual team actions in seconds.
Custom Views
Build reports filtered by team, region or any custom dimension.
Executive Dashboards
View KPIs, owners, and trendline side-by-side always up to date.
Scorecards
View KPIs, owners, and trendline side-by-side always up to date.
Kanban Boards
Visualize task progress and spot bottlenecks at a glance.
Goal Alignment View
Drill down from org-level goals to individual team actions in seconds.
See Goal Alignment
Custom Views
Build reports filtered by team, region or any custom dimension.
Executive Dashboards
Monitor KPI health across teams with real-time, high-level views.
Scorecards
View KPIs, owners, and trendline side-by-side always up to date.
Kanban Boards
Visualize task progress and spot bottlenecks at a glance.
Goal Alignment View
Drill down from org-level goals to individual team actions in seconds.
Custom Views
Build reports filtered by team, region or any custom dimension.
See Custom Views
ClearPoint initiative page in dark mode with owner, analysis, milestones, Gantt chart and a dated analysis history panel
ClearPoint scorecard view listing objectives, measures and initiatives by category with status arrows (demo data)
ClearPoint kanban view sorting measures by ownership level: executive, department, team and individual
ClearPoint Explorer view in dark mode linking measures and their analysis to child measures across divisions
ClearPoint Strategy Score view with a score trend chart and status donuts for objectives, measures and initiatives

I used to email 10 departments for report updates, now I log in and see it all in one place.”

Brandie Holloway
Director of Strategy
The Choctaw Nation
CUSTOMIZATIONS

Custom Views You'd Never Build Manually In A Spreadsheet

 From company-wide reporting frameworks to personalized dashboards, ClearPoint lets you tailor every level of business reporting — no devs, no cluttered files.

company level

Use the Framework You Already Have

OKRs? Balanced Scorecard? Your own? ClearPoint bends to your structure, no rebuild required.
ClearPoint welcome page with a custom organization banner above a strategic plan table of objectives and measures
Tailor views by business unit, region, or strategic pillar.
Track organization-wide KPIs without touching Excel.
Maintain your reporting cadence, just with less friction.
TEAM / INDIVIDUALS

Only See What Matters To You

Each team or user gets a dashboard showing just their goals, metrics, and deadlines, nothing else.
ClearPoint My Workspace in dark mode with assigned updates, a review checklist, notifications and mentions
Personalized dashboards by team, role, or priority.
Clean separation between org, team, and individual views.
Everyone knows exactly what they own, and how it ladders up.
collaboration

Still Chasing Updates? Here’s How ClearPoint Replaces Meeting Prep & Check-Ins

Assign tasks, leave comments, set permissions, and trigger alerts. So teams stay aligned without weekly meetings, messy email threads, or status-chasing on Slack.
ClearPoint My Workspace with a My Updates checklist of measures and a revenue bar chart
Inline Comments

Leave feedback directly on goals and updates, no more email threads.
Smart Permissions

Control who sees and edits what, down to the goal, metric, or report.
Custom Alerts

‍
Get notified when deadlines slip, tasks stall, or updates go missing.
Approvals Built In

Route updates for sign-off with audit trails and approval workflows.
Live Reports

Generate reports that always reflect the latest plan, automatically.
Email + MS Teams Integration
‍
Send updates to your team’s tools, without switching platforms.
Finally, keep everyone aligned and accountable
(without needing a single status meeting!)

FAQ

Business reporting, answered

What is business reporting software?

Software that assembles recurring reports (board, council, executive, regulatory) from live tracked data instead of rebuilding a document by hand each cycle. Owners update their measures once; every report that uses them refreshes.

How much reporting time does automation actually save?

Southern Ohio Medical Center went from 40 hours a month to 15-20 minutes by moving 400+ scorecards into one system. The 70% figure is the conservative end of what customers report.

Which tools automate PowerPoint board reporting and executive KPI dashboards?

Platforms that hold the plan, the measures, and the report in one system — ClearPoint generates board books and PowerPoint exports in one click from live data. BI tools visualise data but do not own the plan behind it, so the deck still has to be assembled by someone.

How do you stop monthly spreadsheet board reports?

Move the scorecards, not the report: once measures live in one system with named owners and update reminders, the board report becomes a view rather than a project. Most teams run their first live cycle within 90 days, and a first scorecard in about 3 weeks.

What should a report include for a council or board?

Status against target for each objective, the owner’s commentary, and the linked initiatives — the three things a spreadsheet loses. ClearPoint builds all three into every generated report.

How do cities report strategic plan progress to council?

Most cities collect status by email, then rebuild a deck each cycle. In ClearPoint each objective has a named owner who updates in place, so the council packet is generated from the same live record: status against target, the owner’s commentary, and the linked initiatives. Southern Ohio Medical Center went from 40 hours a month to 15-20 minutes on that assembly.

How many saved reports does a typical organisation keep?

It depends far more on sector than on size. Across the 336 organisations licensed on ClearPoint in September 2026, the median local government keeps 43 saved reports on the shelf, against 4 for a typical hospital and 5 for a university — councils report publicly on a fixed statutory cadence, and that shows up directly in how many report templates get built and kept. The platform median is 8.

How is ClearPoint different from a BI tool for reporting?

BI visualises warehouse data. ClearPoint owns the strategic record: objectives, owners, targets, commentary, and evidence. The report writes itself from that record.

Platform figures: ClearPoint product data, September 2026 — 336 licensed organisations, of which 91 in local government, 32 in healthcare and 12 in higher education. Saved reports counted as PDF plus HTML reports. Accounts past their licence end date are excluded; each organisation is counted in one segment only. Customer figures as reported by the named organisation.

book a free demo
In Just 30 Min, We’ll Show You
How to Streamline Business Reporting

(without chasing spreadsheets, late updates, or siloed teams)

Watch ClearPoint turn fragmented data into clean, decision-ready dashboards.
See how AI, scorecards, and team views keep reports visible and actionable.
Ask anything about frameworks, workflows, or custom views, we’ll show you LIVE on your reporting structure!

We shared a mess of spreadsheets. They helped turn it into a structured, live reporting system with owners and goals. We didn’t expect to get that far in 30 minutes."

Headshot of Monica C., Strategic Planning & Performance Manager
Monica C.
Strategic Planning & Performance Manager

Talk to a strategy expert!

Five out of five star customer rating
Based on 150+ customer reviews
ClearPoint Strategy customer ratings on Capterra and G2