We analyzed 20,582 strategic plans. Get a copy of the full report.
Free tool ·
All
Four perspectives, your objectives, your measures, an owner on each. The strategy map updates as you type. Export to Excel when it’s yours.
Free to use. No account. Email only to export.
83%
of metrics have no owner assigned at all · 272,360 of 327,582 · Jan 2026
5.3
objectives per scorecard, median organization · n = 593 · Sept 2026
14.5
measures per scorecard, median organization · n = 593 · Sept 2026
21,000+
strategic plans on the platform · 597 organizations · ClearPoint platform data
ClearPoint platform data · 593 organizations · September 2026 snapshot
A balanced scorecard organizes an organization’s objectives across four perspectives — customer or community, financial, internal process, learning and growth — with a measure and an owner on each objective, and a strategy map showing which objectives drive which. Across 593 organizations on the ClearPoint platform, the median scorecard holds 5.3 objectives and 14.5 measures (September 2026).
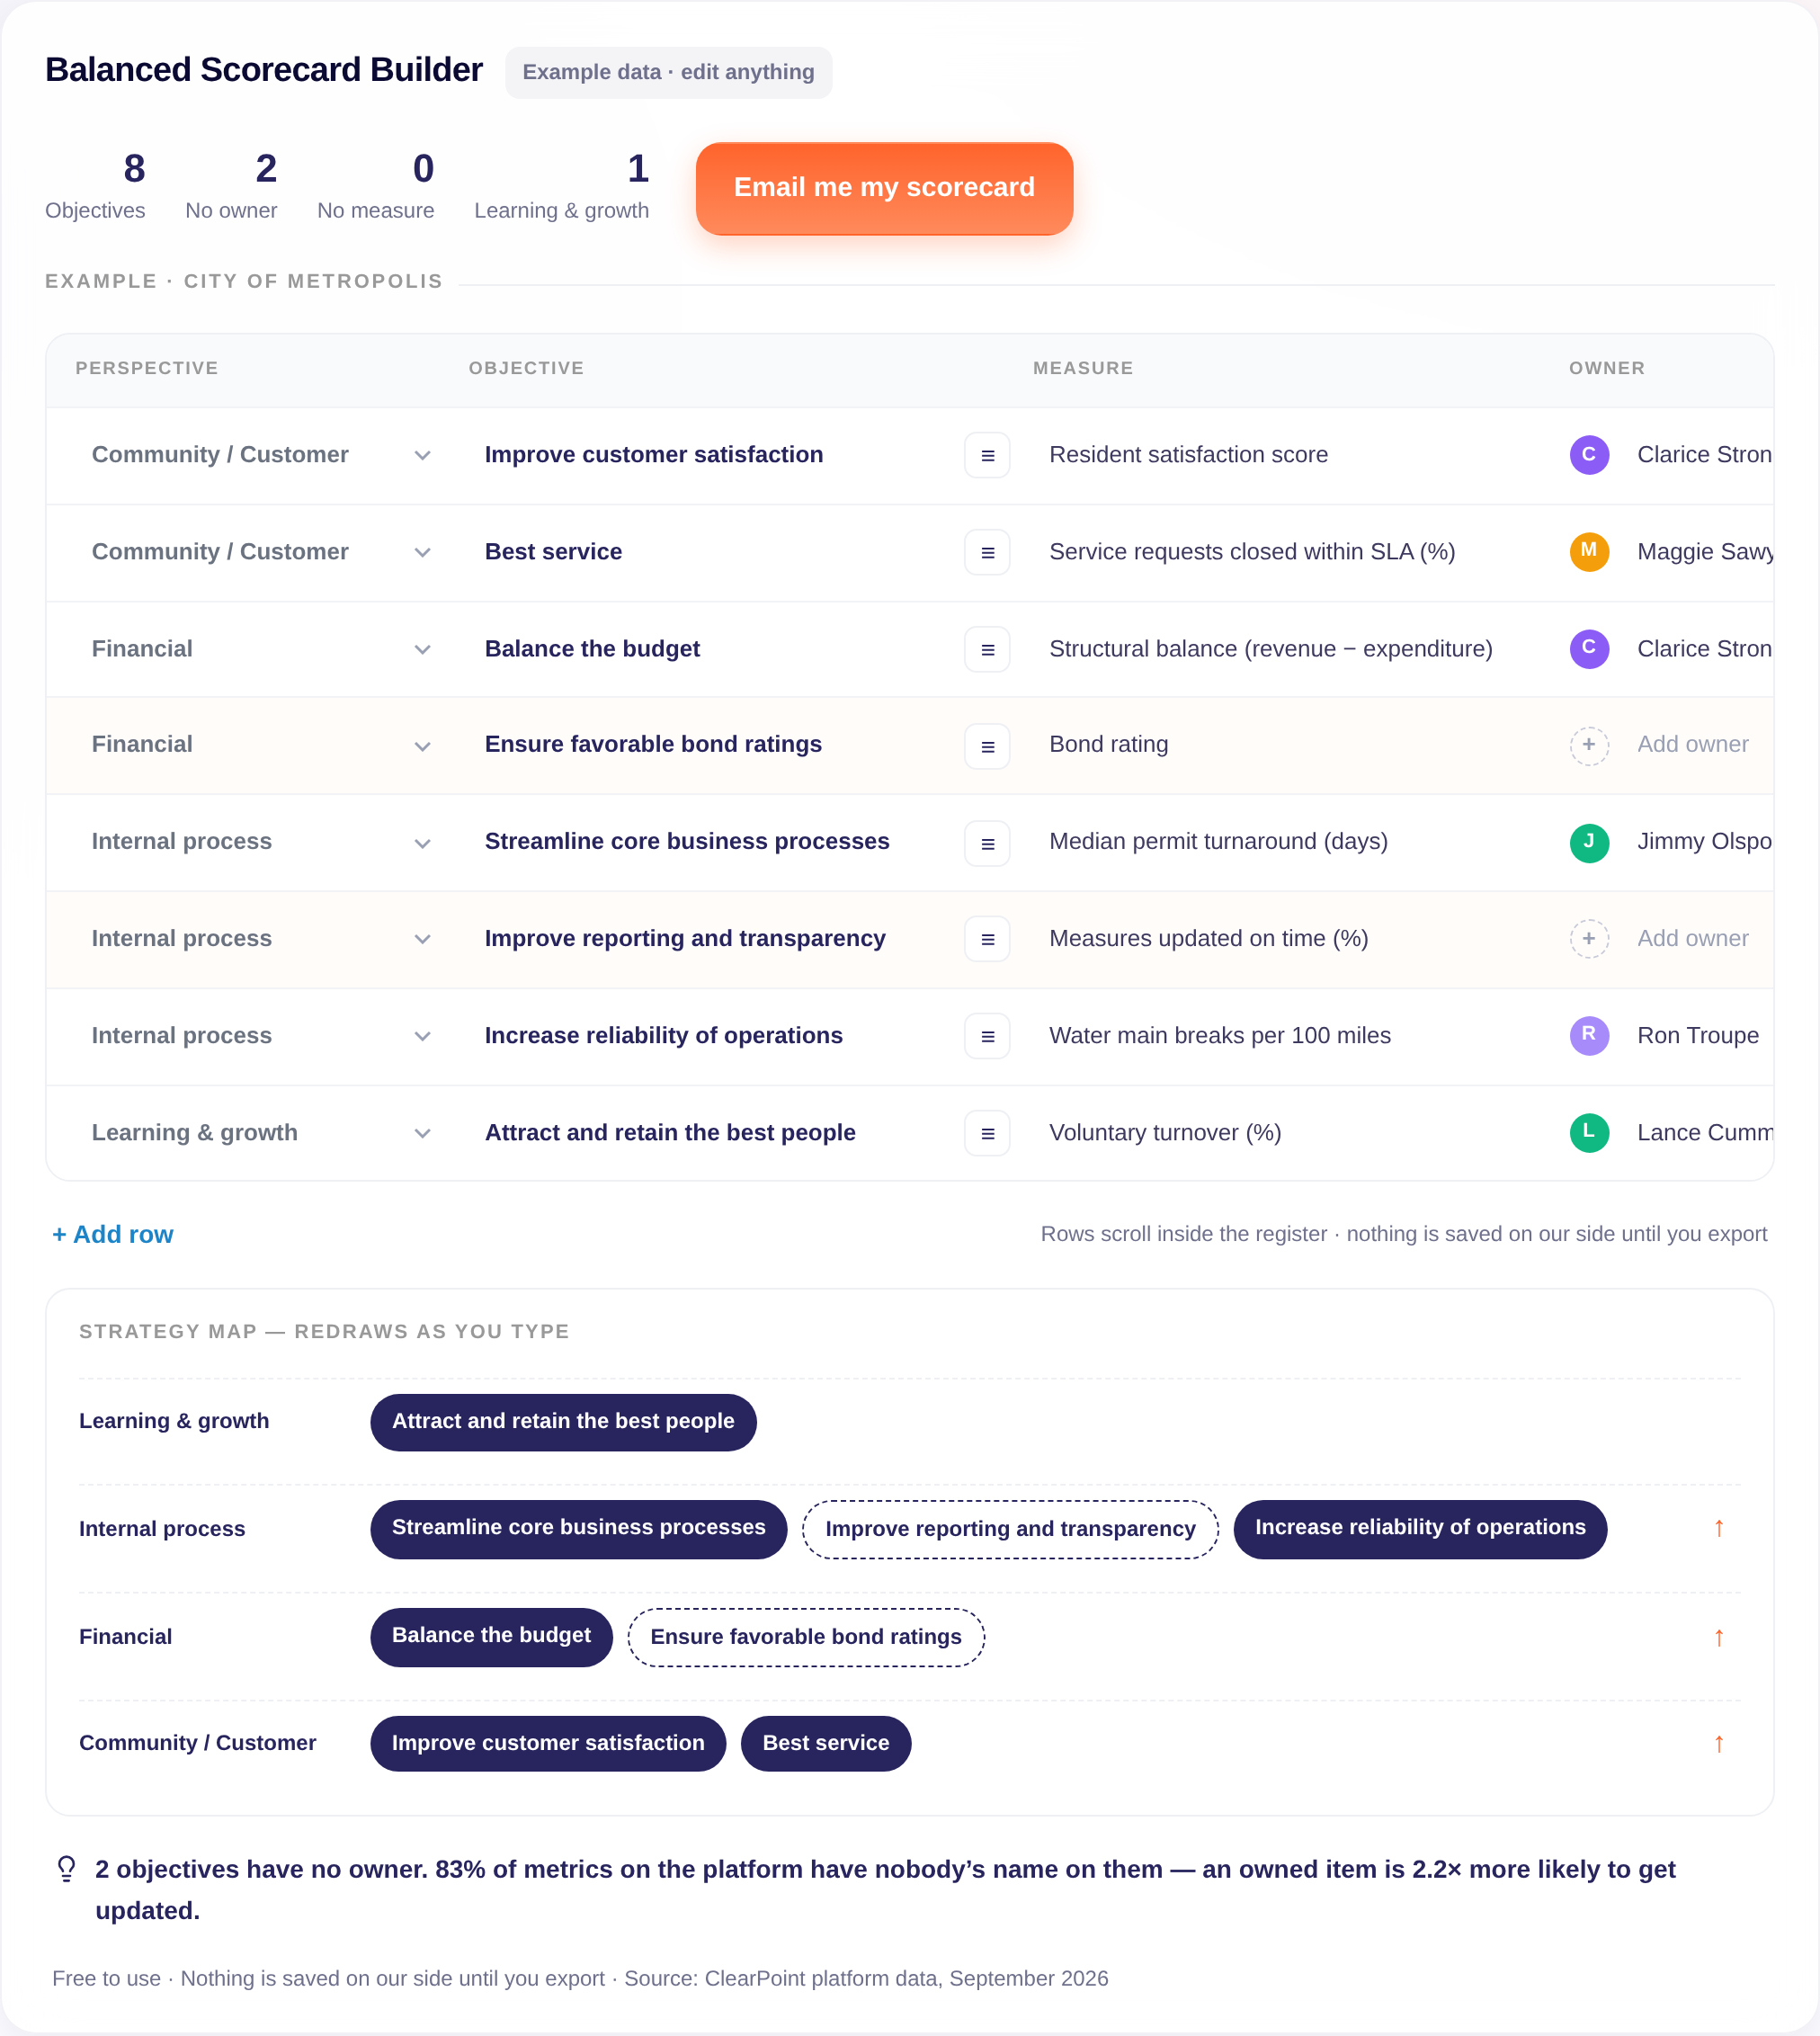
Example scorecard — City of Metropolis (illustrative). Four perspectives, eight objectives, a measure on each, two objectives still without an owner. The strategy map redraws as rows change.
| Perspective | Objective | Measure | Owner | Target |
|---|---|---|---|---|
| Community / Customer | Improve customer satisfaction | Resident satisfaction score | Clarice Strong | ≥ 4.2 / 5 |
| Community / Customer | Best service | Service requests closed within SLA (%) | Maggie Sawyer | ≥ 90% |
| Financial | Balance the budget | Structural balance (revenue − expenditure) | Clarice Strong | ≥ 0 |
| Financial | Ensure favorable bond ratings | Bond rating | — | Maintain Aa1 |
| Internal process | Streamline core business processes | Median permit turnaround (days) | Jimmy Olspon | ≤ 10 |
| Internal process | Improve reporting and transparency | Measures updated on time (%) | — | ≥ 95% |
| Internal process | Increase reliability of operations | Water main breaks per 100 miles | Ron Troupe | ≤ 12 |
| Learning & growth | Attract and retain the best people | Voluntary turnover (%) | Lance Cummins | ≤ 9% |
Reuse freely with attribution. Canonical source: https://www.clearpointstrategy.com/free-tools/balanced-scorecard-builder
| Perspective | Objective | Measure | Owner | Target |
|---|---|---|---|---|
|  |  |  |  |  |
|  |  |  |  |  |
|  |  |  |  |  |
Source: ClearPoint Strategy — https://www.clearpointstrategy.com/free-tools/balanced-scorecard-builderWe’ll email a CSV (opens in Excel) of your perspectives, objectives, measures and owners, and a printable one-page scorecard. Nothing else, unless you ask.
Nothing is saved on our side until you export.
On its way to your inbox
That is where scorecards go quiet. In a 30-minute session we show this exact scorecard living in ClearPoint — owners updating, the strategy map turning red and green on its own, the council packet generated from it. On your objectives, not ours.
Why scorecards go quiet
Two to three per perspective — the median ClearPoint scorecard carries 5.3 objectives and 14.5 measures, and past twelve objectives the strategy map stops reading as a map. The builder counts objectives per perspective and flags the one everyone leaves empty.
5.3 objectives per scorecard, median. The scorecards that stay readable are the ones that stop there.
The Excel templates get the four perspectives right and stop there; the builder insists on an owner and a measure on every objective and draws the strategy map as you type, so the cause-and-effect argument is visible before you export.
| Excel template | This tool | |
|---|---|---|
| Four perspectives | Yes | Yes, with per-perspective counts |
| Strategy map | Drawn by hand, later | Drawn live |
| Owner on each objective | Optional column | Required before export |
| Objective ideas | None | Picker of 56, by perspective |
| Export | Excel | CSV (opens in Excel) + one-pager |
| Email required | To download | Only to export |
| Sector | Orgs | Objectives / scorecard | Measures / scorecard |
|---|---|---|---|
| Government & public sector | 196 | 5.4 | 17.8 |
| Healthcare | 28 | 4.6 | 16.9 |
| Education | 26 | 5.3 | 14.9 |
| Private & other | 343 | 5.3 | 11.9 |
| All | 593 | 5.3 | 14.5 |
Medians; sectors classified from organization names. ClearPoint platform data, September 2026.
Trusted by the teams whose plans are public
“The map made the argument for us. When a learning objective went red, the council could see which financial objective it would hit next.”
[Cleared client quote — same vertical only] — name, title, organization
City of Fort Lauderdale · Durham County · City of Coral Springs · City of Goldsboro · JEA
Yes. Build all four perspectives in the browser without an account. Email is asked only when you export to Excel.
A CSV (opens in Excel) of your perspectives, objectives, measures, owners and targets, and a printable one-page scorecard.
Across 593 organizations on the ClearPoint platform, the median scorecard holds 5.3 objectives and 14.5 measures. Two to three objectives per perspective is the pattern that stays readable.
The learning-and-growth perspective is the one most often left empty — and it is the one that explains causes rather than results. The tool flags an empty perspective.
It exports to one. The difference is that the builder asks for an owner and a measure on every objective before you get the file.
ClearPoint platform data: September 2026 snapshot (593 organizations) and the ClearPoint platform (21,000+ plans, 597 organizations).
All answers ship as text in the DOM — the accordion only hides them visually.
Method
Scorecard composition: DISTRICTSTATS, September 8, 2026, 593 organizations with at least one objective and one measure; ratios per organization, then the median. Ownership: 327,582 metrics on the ClearPoint platform, January 2026.
The four perspectives follow Kaplan and Norton; the 56 objectives are examples grouped by perspective.
Thirty minutes, your objectives, a live scorecard you keep.
Book a 30-min demo
.svg)
