

Get answers like this one, first.
Google’s AI Overviews now favor the sources you choose. Add ClearPoint once, and our research shows up in your AI answers — badged and prioritized.
Add ClearPoint as a Preferred SourceFree · one click · applies only to your own Google results.

Ready-to-use Baldrige dashboard templates for all 7 criteria categories — Leadership, Strategy, Customers, Workforce, Operations, and Results.
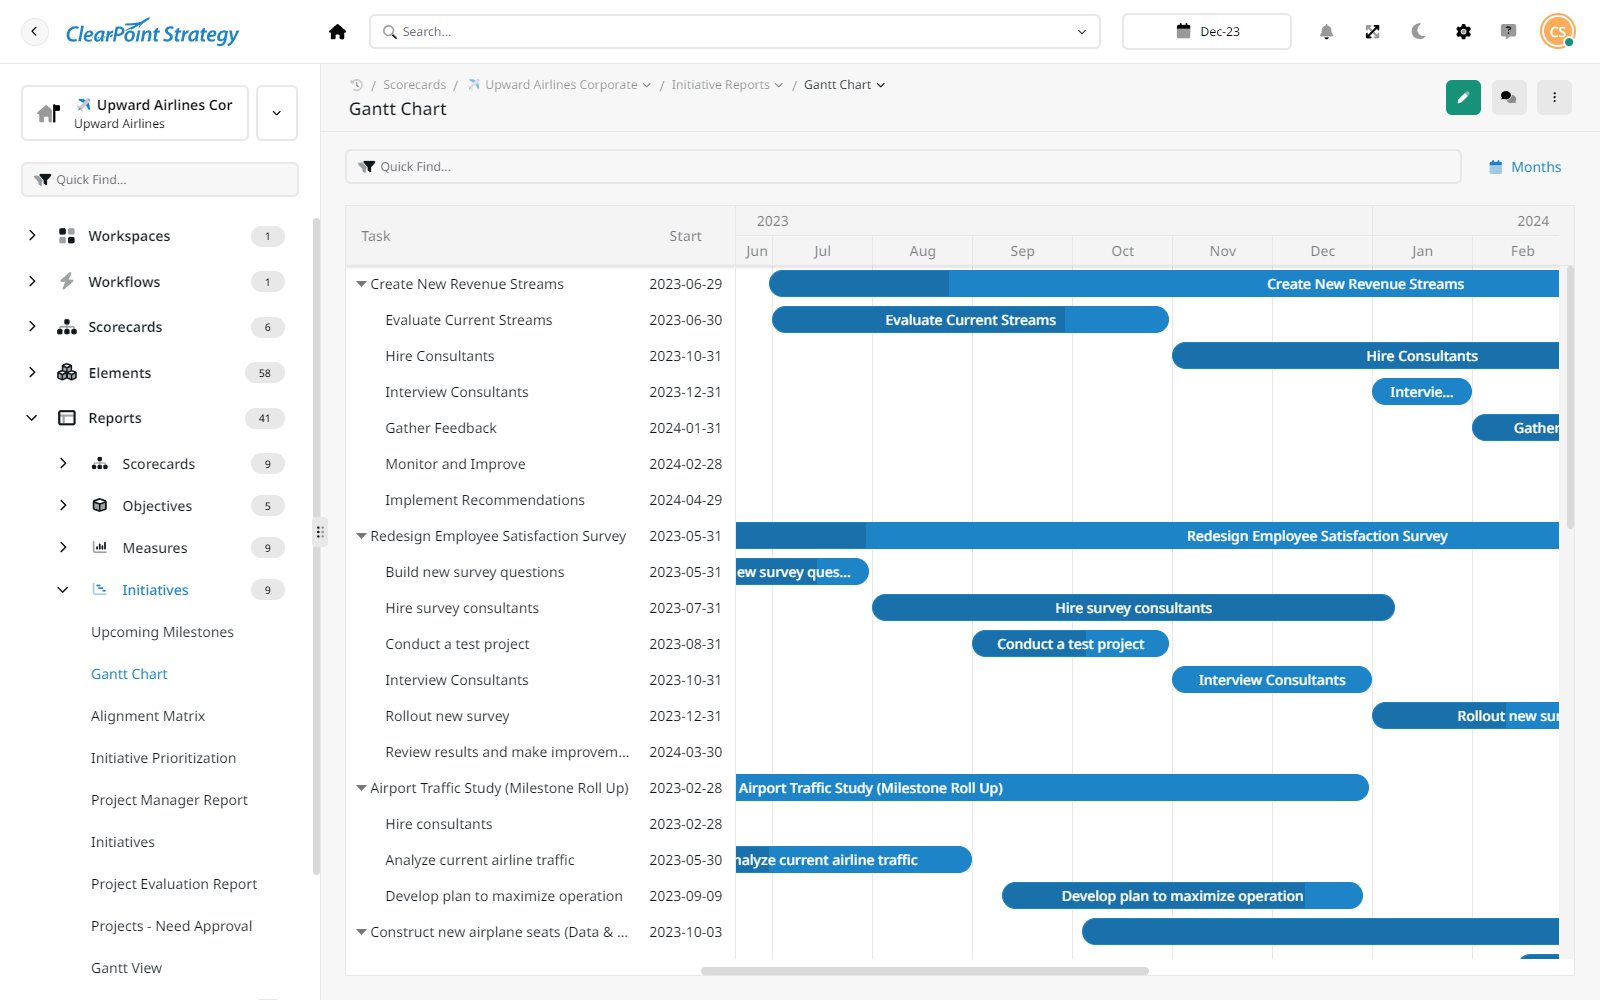
Most organizations pursuing Baldrige performance excellence hit the same wall: they can articulate the seven categories, they can map their processes to the criteria — but they cannot see everything in one place. The result is a fragmented picture where leadership metrics live in one spreadsheet, workforce data in another, and customer satisfaction results in a third system entirely. ClearPoint platform data (2025) shows that across 21,000+ strategic plans, the median organization manages 17.7 measures per plan — and for Baldrige-aligned organizations juggling seven interconnected categories, that number climbs fast. Without a unified Baldrige dashboard, self-assessment becomes guesswork instead of a disciplined cycle of improvement.
This article provides ready-to-use Baldrige dashboard templates for each of the seven criteria categories, with the specific KPIs, layouts, and reporting cadences that organizations actually use to move from Baldrige-curious to Baldrige-recognized.
What Makes a Baldrige Dashboard Different from a Standard Strategy Dashboard
A standard strategic plan dashboard tracks goals, measures, and projects in a hierarchy that mirrors the organization's plan. A Baldrige dashboard does something more specific: it maps directly to the seven categories of the Baldrige Excellence Framework — Leadership, Strategy, Customers, Measurement & Knowledge Management, Workforce, Operations, and Results — and surfaces the cross-category connections that evaluators look for during the assessment process.
The distinction matters because Baldrige is not a checklist. Evaluators score organizations on the ADLI model (Approach, Deployment, Learning, Integration), which means they want to see how leadership decisions cascade into workforce engagement, how customer feedback loops back into operational improvements, and how measurement practices tie everything together. A well-built Baldrige dashboard makes these linkages visible instead of buried in narrative reports.
Organizations like the City of Fort Collins, CO — a national Baldrige Award winner in 2017 — credit their success partly to having a centralized system that connected strategic objectives across all seven categories. Their budget director noted that having strategy and performance metrics visualized in one platform was instrumental in achieving Baldrige designation.
Template 1: Leadership Dashboard (Category 1)
The Leadership category examines how senior leaders guide and sustain the organization. Your leadership dashboard should answer two questions for evaluators: How do leaders set direction? And how do they create an environment for success?
Key measures to track:
- Mission/vision alignment score — percentage of strategic objectives explicitly linked to the mission statement
- Senior leader communication cadence — frequency and reach of town halls, all-hands, or community meetings
- Ethics and compliance incidents — tracked over time with trend lines
- Governance review completion rate — percentage of board/council governance reviews completed on schedule
- Community/stakeholder engagement index — composite measure of external engagement activities
Layout recommendation: Use a summary view with status indicators (green/yellow/red) for each sub-measure, plus a trend chart showing 12-month leadership engagement patterns. In ClearPoint, this maps to a scorecard layout where each leadership KPI rolls up to a single category health score.
Reporting cadence: Quarterly, aligned with board or governing body meetings.
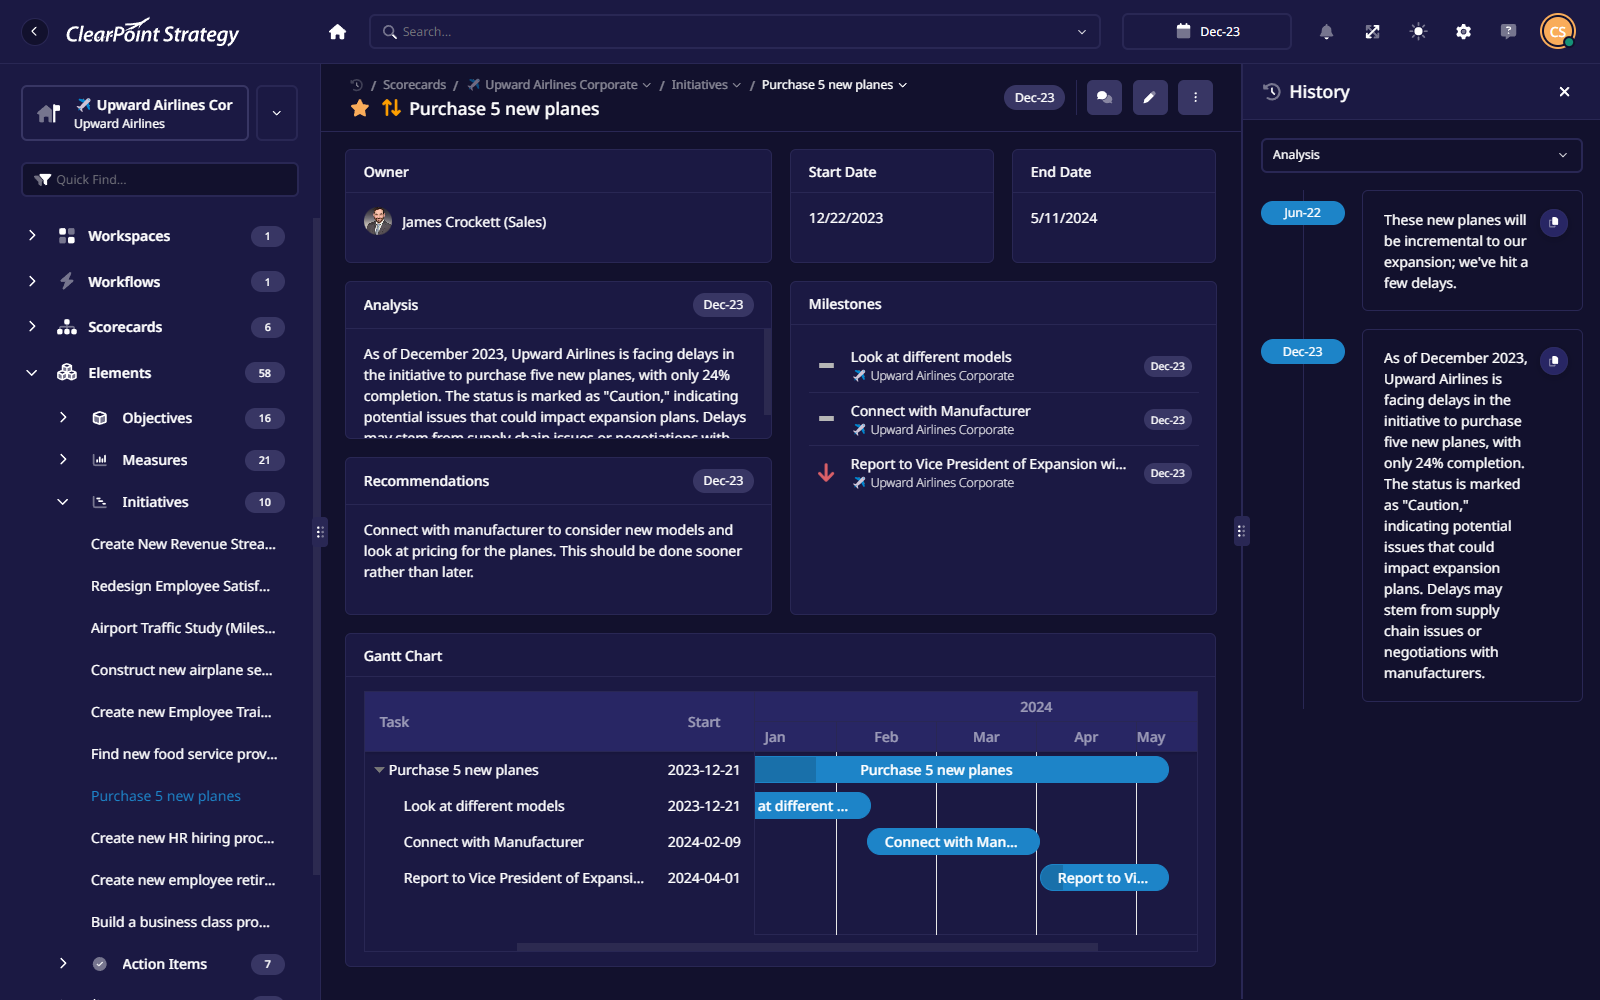
Template 2: Strategy Dashboard (Category 2)
The Strategy category is where Baldrige meets traditional strategic planning — and where most organizations already have infrastructure. The dashboard should show both strategic plan development (the process) and strategic plan execution (the results).
Key measures to track:
- Strategic objectives on track — percentage of objectives rated green. ClearPoint platform data shows that only 40% of strategic goals are on-track at any given time across 30,000+ plans — Baldrige organizations should aim to significantly outperform this benchmark
- Action plan completion rate — percentage of planned initiatives completed within the fiscal year
- Strategic plan review cadence — confirmation that quarterly strategy reviews occur on schedule
- Environmental scan currency — date of last SWOT/PESTEL/competitive analysis update
- Resource allocation alignment — percentage of budget allocated to strategic priorities vs. operational maintenance
Layout recommendation: A strategy map visualization at the top showing objective relationships, with drill-down capability into each objective's supporting measures and projects. The strategy dashboard is typically the most data-dense of all seven and benefits from layered views.
→ The data tells the Baldrige integration story: Government and Healthcare organizations are not just larger — they operate at a fundamentally different measurement density. A Baldrige Category 7 (Results) dashboard in these sectors must aggregate 10× the measure volume of a typical private-sector applicant. This is why the seven-category structure matters — without it, the signal-to-noise ratio collapses.
Reporting cadence: Monthly for action plans, quarterly for strategic objective review.
📊 ClearPoint Platform Data — Strategic Plan Complexity by Sector: Government organizations manage 147% more measures and 143% more objectives than the platform average. Healthcare matches government on objectives but with nearly 2× the scorecard infrastructure. This is why Baldrige dashboards — structured around 7 interconnected categories — are not optional for these sectors. They're a prerequisite for managing this volume of strategic elements coherently. See the full Strategic Planning Report →
Template 3: Customer Dashboard (Category 3)
"Customer" in Baldrige language means different things depending on your sector — residents and taxpayers for government, patients for healthcare, students for higher education. The customer dashboard tracks voice of the customer (VOC), satisfaction, and engagement.
Key measures to track:
- Customer/resident satisfaction score — from annual or biannual survey
- Net Promoter Score (NPS) or equivalent — loyalty and advocacy metric
- Service request resolution time — average days from request to resolution
- Complaint volume and trend — tracked monthly with category breakdown
- Customer engagement touchpoints — number of interactions across channels (web, phone, in-person, social)
- Accessibility/equity metrics — service reach across demographics or geographic areas
Layout recommendation: Lead with the satisfaction trend line (the single most important chart for evaluators), followed by a breakdown table of service areas with individual scores. Include a complaints heatmap to show seasonal patterns.
Reporting cadence: Monthly for operational metrics, quarterly for survey-based metrics.
Template 4: Measurement, Analysis & Knowledge Management Dashboard (Category 4)
This is the meta-category — it evaluates how well you measure everything else. Ironically, it is the category most organizations neglect to measure. Your Category 4 dashboard should demonstrate that you have a mature data infrastructure.
Key measures to track:
- Data update compliance rate — percentage of assigned measure owners who actually update their data on time. ClearPoint platform data reveals that 81% of assigned metric owners never update their data — Baldrige organizations need this number close to zero
- Dashboard utilization rate — monthly active users as a percentage of total assigned users
- Data quality score — percentage of measures with complete, current, accurate data
- Benchmarking coverage — percentage of key measures that include external comparison data
- Knowledge sharing events — number of cross-functional reviews, after-action reports, or lessons-learned sessions conducted
Layout recommendation: This dashboard is your proof that the other six dashboards actually work. Show data freshness indicators (last updated timestamps), owner compliance rates, and a system utilization chart. In ClearPoint, the update-to-login ratio — currently 7:1 across the platform — is a strong proxy for whether your measurement system is driving action, not just passive consumption.
Reporting cadence: Monthly, with a quarterly deep-dive into data quality and benchmarking gaps.
📊 ClearPoint Platform Data — Measurement Density per Objective: The measurement density gap across sectors is staggering: healthcare organizations track 18.1 measures per objective — 3.8× more than education (4.8). Government sits at 8.2, while private sector averages 6.1. For Baldrige Category 4, this means your dashboard infrastructure must match your sector's measurement culture. A healthcare Baldrige applicant needs automated data pipelines to handle this density; an education applicant needs to invest in expanding measurement coverage before their dashboard tells a credible Category 4 story. See the full Strategic Planning Report →
→ For Baldrige Category 4 (Measurement, Analysis & Knowledge Management), this gap is the difference between an 85-point submission and a 450-point submission. Healthcare applicants need automated data pipelines to sustain 18.1 measures per objective at data-freshness standards evaluators expect. Education applicants need to expand measurement coverage before their Category 4 narrative becomes credible — and not the other way around.
Template 5: Workforce Dashboard (Category 5)
The Workforce category examines how you build an effective, engaged, and capable workforce. For Baldrige, workforce engagement is not an HR nice-to-have — it is a scored category worth up to 85 points.
Key measures to track:
- Employee engagement score — from annual survey, trended over 3+ years
- Voluntary turnover rate — tracked monthly, benchmarked against sector averages
- Training hours per employee — average annual professional development hours
- Internal promotion rate — percentage of open positions filled internally
- Workforce diversity metrics — representation across levels and departments
- Safety incident rate — OSHA recordable incidents per 100 employees
- Absenteeism rate — tracked monthly with trend analysis
Layout recommendation: Lead with the engagement score trend (evaluators look for multi-year improvement). Use a quadrant chart to show departments by engagement level vs. turnover risk. Include a training completions tracker with progress bars.
Reporting cadence: Monthly for operational metrics (turnover, safety), annually for survey results, with quarterly pulse checks recommended.
Template 6: Operations Dashboard (Category 6)
The Operations category covers your work processes — both the core value-creation processes and the support processes that enable them. This is where efficiency, effectiveness, and innovation are measured.
Key measures to track:
- Process cycle time — average time to complete key processes (permitting, patient intake, enrollment, loan processing, etc.)
- Process defect/error rate — percentage of processes requiring rework
- Cost per transaction — unit cost for key service deliveries
- Innovation pipeline — number of process improvements implemented per quarter
- Supply chain/vendor performance — on-time delivery rate and quality scores
- Emergency preparedness readiness — percentage of continuity plans tested and current
Layout recommendation: Use a process-by-process matrix showing cycle time, quality, and cost for each key process. Include a project tracking view for improvement initiatives with timeline and milestone status. ClearPoint platform data shows the median strategic project takes 11 months — operational improvement projects in a Baldrige context should target shorter cycles with clear learning loops.
Reporting cadence: Monthly for process metrics, quarterly for innovation and emergency preparedness reviews.
Template 7: Results Dashboard (Category 7)
The Results category is worth 450 out of 1,000 total Baldrige points — nearly half the score. This is where everything converges. Your Results dashboard should aggregate the outcome measures from all other categories and present them with levels, trends, comparisons, and integration (the LeTCI scoring dimensions).
Key measures to track:
- Product/service outcome results — quality, timeliness, and value metrics for your core deliverables
- Customer-focused results — satisfaction scores, retention rates, market share
- Workforce-focused results — engagement, development, turnover
- Leadership and governance results — fiscal accountability, ethical compliance, stakeholder trust
- Financial and market results — revenue, cost containment, budget performance
- Operational effectiveness results — process efficiency, cycle time improvements
Layout recommendation: This is your executive summary dashboard. Use a balanced scorecard layout with one quadrant per results area. Each measure should show current level, 3-year trend, and a comparison column (benchmark, target, or peer). Evaluators specifically look for results that demonstrate integration — meaning improvements in one area drive improvements in others.
Reporting cadence: Quarterly for the full results rollup, with monthly monitoring of leading indicators.
How to Connect All Seven Dashboards Into a Baldrige System
Individual category dashboards are necessary but not sufficient. What separates Baldrige Award winners from organizations that plateau at the state level is the visible integration across categories. Here is how to wire your seven dashboards into a cohesive system:
Step 1: Create a Baldrige master dashboard. This top-level view shows a single health score for each of the seven categories, with drill-down capability into each category dashboard. Think of it as the cockpit view that senior leaders review monthly.
Step 2: Map cross-category linkages. For example, link your workforce engagement score (Category 5) to your customer satisfaction score (Category 3) and your process quality rate (Category 6). When evaluators see that you track these relationships — and that improving one drives improvement in the others — your integration score goes up.
Step 3: Establish a review cadence. Baldrige organizations typically run monthly operational reviews (Categories 3, 5, 6), quarterly strategic reviews (Categories 1, 2, 7), and annual self-assessments against the full criteria. Your dashboard system should support all three rhythms.
Step 4: Automate data collection where possible. The 81% phantom owner problem — where assigned metric owners never update their data — is the single biggest threat to a Baldrige dashboard system. Use automated data integrations, email reminders, and accountability structures to keep data flowing. An empty dashboard is worse than no dashboard at all.
📊 ClearPoint Platform Data — Dashboard Infrastructure Index: The data tells the integration story Baldrige evaluators look for: government organizations build 35.8 charts per scorecard and maintain 2.9 initiatives per objective — the highest action density across all sectors. Healthcare leads on scorecard depth at 198% of platform average. These numbers reflect the kind of cross-category measurement infrastructure that scores well on the ADLI and LeTCI dimensions. See the full Strategic Planning Report →
Getting Started With Baldrige Dashboards
If you are beginning your Baldrige journey, do not try to build all seven dashboards at once. Start with the two categories where you already have the most data — typically Strategy (Category 2) and Results (Category 7) — and expand from there. The ClearPoint platform supports Baldrige-aligned structures out of the box, with scorecard templates that map to the seven categories and automatic status calculations that keep your data current.
Organizations that have gone from initial Baldrige self-assessment to state-level recognition — and in some cases, national award — consistently point to their measurement infrastructure as a differentiator. The framework tells you what to measure. The dashboard shows you whether you are actually improving.
Related Resources
- The Baldrige Excellence Framework in Government — an introduction to the framework with insights from Fort Collins, CO
- Strategic Plan Examples for Government — real strategic plan structures from cities and counties
- Strategy Map Examples and Templates — how to visualize objective relationships across categories
- KPI Scorecard Software — build Baldrige-aligned scorecards with automated tracking
- Public Dashboard Examples — see how organizations share results with stakeholders
ClearPoint Strategy powers 21,000+ strategic plans and 2 million monthly updates across government, healthcare, education, and enterprise. See how →


