These KPIs provide important insights into everything from finances to operations.
- Track revenue, expenses and operating profit before any other KPI. Investors and the board focus on these three more than any others.
- Measure service quality beside the financials. Client survey scores, average time to close issues and new-account error rates cover the customer side.
- Break productivity out by team, employee and branch. AUM per employee shows workload, and branch sales show which branches perform best and worst.
- Set specific, measurable targets and compare results against them regularly. Targets turn KPI data into the weak areas and adjustments you act on.
- Add finance measures from the free financial KPI eBook. Use it to go beyond the three core financial KPIs.
If you’re a banking institution, how can you really put your finger on performance? You’ve got to know your numbers. More specifically, those numbers that are key performance indicators (KPIs) for the banking industry.
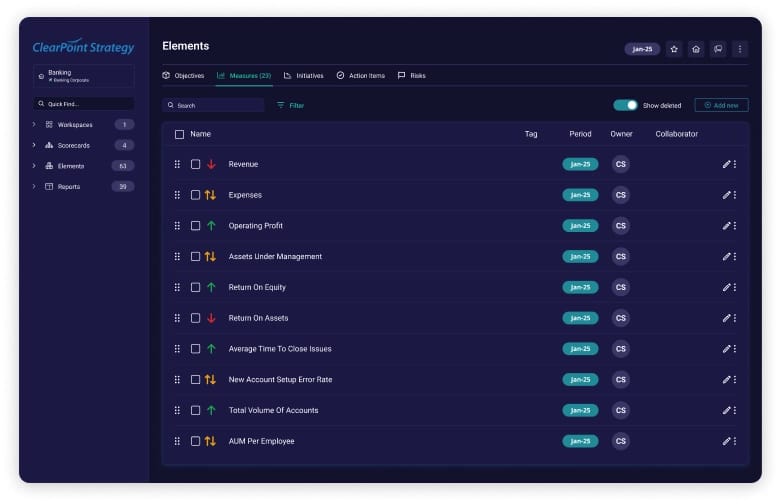
A multitude of KPIs can be implemented to measure every type of transaction and service in a bank to accurately evaluate performance, profit, customer service, and more. It can be hard to choose which measures to focus on, so here’s a list of bank KPIs you should track, organized by category.
17 KPIs Every Bank Should Track
Financial
Revenue
LaggingBetter when higherThe total income an organization receives.
- Formula
Price of goods × number of goods sold.- Example
- $50 × 20,000 = $1,000,000.
- What good looks like
- there is no universal number — judge it against plan, prior periods, and market growth, and read it alongside margin so growth stays profitable
- Weak → strong
- "Grow the business" → "Grow annual revenue from $1,000,000 to $1,200,000 by fiscal year-end, owned by the Chief Revenue Officer".
Total Expenses
LaggingBetter when lowerThe total costs an organization incurs during a reporting period, including marketing, sales, and operations costs.
- Formula
Cost of goods sold + operating expenses + other expenses.- Example
- $5,000,000 + $3,200,000 + $300,000 = $8,500,000.
- What good looks like
- there is no universal number — judge expenses against revenue and output, since spending that grows slower than revenue is the real goal
- Weak → strong
- "Spend less" → "Hold total expenses at $8,500,000 this fiscal year while revenue grows 5%, owned by the CFO."
Operating Profit
LaggingBetter when higherMoney earned from core business operations, excluding deductions of interest and taxes.
- Formula
Revenue − expenses- Example
- $300M − $210M = $90M.
- What good looks like
- there is no universal number — compare it to revenue and to your own prior periods, and watch whether expenses grow slower than revenue
- Weak → strong
- "Make more money from operations" → "Grow operating profit from $90M to $100M this fiscal year by holding expense growth under revenue growth, owned by the CFO"
*Note: The three bank KPIs listed above are the holy trinity. Your stakeholders (such as investors and board) will focus on these metrics more than any others—if nothing else, your bank should track these critical KPIs.
Operating Expenses as a Percentage of Assets
LaggingTotal operating expenses divided by the total dollar amount of owned assets, shown as a percentage.
- Formula
(Total operating expenses ÷ total owned assets) × 100.- Example
- $75M ÷ $2.5B = 3%.
- What good looks like
- U.S. banks' noninterest expense ran ~2.5% of average assets in mid-2026, from ~2.2% at the largest banks to ~4.1% at those under $100M, so compare against your size group; lower is better
- Weak → strong
- "Run the bank leaner" → "Bring operating expenses from 3.0% to 2.8% of assets by year-end, owned by the COO via branch and vendor consolidation"
Assets Under Management (AUM)
LaggingBetter when higherThe total dollar value of assets being managed by the bank.
- Formula
Sum of the market value of all client assets managed at period end.- Example
- $1.2B + $800M + $500M = $2.5B.
- What good looks like
- there is no universal number — track growth against your own baseline and separate net new client money from market gains, since a rising market can mask outflows
- Weak → strong
- "Grow the wealth business" → "Grow AUM from $2.5B to $2.8B by year-end through net new client assets, owned by the head of wealth management"
Percentage of AUM Above Benchmark
LaggingBetter when higherHow your bank’s assets under management (AUM) rank compared to competitors, shown as a percentage.
- Formula
(AUM in portfolios beating their benchmark ÷ total AUM) × 100.- Example
- $1.5B ÷ $2.5B = 60%.
- What good looks like
- there is no universal number — higher is better; measure over three- and five-year periods after fees, since one-year results swing with markets
- Weak → strong
- "Beat the market" → "Raise the share of AUM beating its benchmark over three years from 60% to 65% by year-end, owned by the chief investment officer"
Show all 5 Financial KPIs
Return on Equity (ROE)
LaggingBetter when higherThe profit generated for every dollar of shareholders' equity.
- Formula
(Net income ÷ shareholders' equity) × 100.- Example
- $120,000 ÷ $800,000 = 15%.
- What good looks like
- U.S. listed firms averaged ~17% ROE in January 2026, but a high ROE driven by heavy debt is riskier than one driven by margins, so read it alongside the debt-to-equity ratio
- Weak → strong
- "Earn more for shareholders" → "Lift ROE from 15% to 17% within two years, owned by the CFO via margin improvement rather than added leverage".
Return on Assets (ROA)
LaggingBetter when higherThe profit generated for every dollar of total assets, measuring how efficiently assets produce earnings.
- Formula
(Net income ÷ total assets) × 100.- Example
- $120,000 ÷ $1,500,000 = 8%.
- What good looks like
- there is no universal number — asset-heavy industries such as utilities and banks earn far lower ROA than software or services firms, so compare with industry peers and your own trend
- Weak → strong
- "Use our assets better" → "Raise ROA from 8% to 9% within two years, owned by the CFO via selling idle assets".
Get the ebook of 68 financial KPIs
Quality
Client Survey Score
LaggingBetter when higherBank performance as measured by customer feedback, usually gathered through client surveys.
- Formula
Sum of survey scores ÷ number of responses.- Example
- 8,400 points ÷ 1,000 responses = 8.4.
- What good looks like
- there is no universal number — keep the same survey and scale over time, track the trend, and read the comments from low scorers, which matter more than the average
- Weak → strong
- "Keep clients happy" → "Raise the average client survey score from 8.4 to 8.8 out of 10 by year-end, owned by the head of client experience, reviewed quarterly"
Average Time to Close Issues
LaggingBetter when lowerThe length of time from when a problem is identified to when it is solved.
- Formula
Sum of days from identification to resolution ÷ number of issues closed.- Example
- 1,800 days ÷ 120 issues = 15 days.
- What good looks like
- there is no universal number — lower is better; set targets by issue severity against your own baseline and watch for aging items that never close
- Weak → strong
- "Resolve issues faster" → "Cut average time to close issues from 15 days to 10 days by Q4, owned by the operations risk manager, reviewed monthly by severity"
New Account Setup Error Rate
LaggingBetter when lowerThe total number of new customer accounts created containing an error (e.g., a typo or incorrect address, name or account type) divided by the total number of new customer accounts set up at the same point in time, shown as a percentage.
- Formula
(New accounts with an error ÷ total new accounts set up) × 100.- Example
- 45 ÷ 3,000 = 1.5%.
- What good looks like
- there is no universal number — lower is better; aim toward zero and track errors by type, since a wrong name or address flows into statements, compliance checks, and fraud screens
- Weak → strong
- "Make fewer setup mistakes" → "Cut new account setup errors from 1.5% to under 0.5% within two quarters, owned by the onboarding operations manager via field validation"
Accounts Opened with Insufficient Documentation
LaggingBetter when lowerThe total number of new accounts opened with insufficient documentation divided by the total number of new accounts opened over the same period, shown as a percentage.
- Formula
New accounts opened with insufficient documentation ÷ total new accounts opened × 100- Example
- 36 ÷ 1,200 = 3%.
- What good looks like
- there is no universal number — lower is better, and the target is as close to zero as your onboarding checks allow, since every gap is a know-your-customer compliance exposure
- Weak → strong
- "Tighten account opening" → "Cut accounts opened with insufficient documentation from 3% to under 1% within two quarters, owned by the branch operations manager via a required-document checklist"
Productivity By Team Or Individual
Total Volume of Accounts
LaggingThe total number of accounts managed by your bank, tracked by financial timeframes.
- Formula
Count of open accounts at period end.- Example
- 120,000 checking + 80,000 savings + 50,000 loan = 250,000 accounts.
- What good looks like
- there is no universal number — track net growth (new accounts minus closures) against your own baseline, and watch dormant accounts that inflate the total
- Weak → strong
- "Grow our customer base" → "Grow open accounts from 250,000 to 265,000 by year-end net of closures, owned by the head of retail banking"
AUM Per Employee
LaggingThe total dollar value of assets being managed by the bank divided by the number of employees. It helps analyze workload.
- Formula
Assets under management ÷ number of employees.- Example
- $2.5B ÷ 50 = $50M.
- What good looks like
- there is no universal number — compare it to your own trend and to firms with a similar client mix; a very high figure can signal advisors are stretched too thin
- Weak → strong
- "Make the wealth team more productive" → "Raise AUM per employee from $50M to $55M within the fiscal year without lowering client satisfaction, owned by the head of wealth management"
Operating Profit Per Employee
LaggingThe total dollar amount of operating profits divided by the total number of employees.
- Formula
Operating profit ÷ total number of employees.- Example
- $90M ÷ 1,500 = $60,000.
- What good looks like
- there is no universal number — compare it to peers of similar size and business mix and to your own trend, since branch-heavy and wholesale banks differ widely
- Weak → strong
- "Get more from our people" → "Raise operating profit per employee from $60,000 to $66,000 by year-end through process automation, owned by the COO"
Show all 5 Productivity By Team Or Individual KPIs
Sales Per Branch
LaggingThe total dollar amount of sales generated through a single branch divided by the total number of branch locations. It helps management assess which branches are the highest- and lowest-performing.
- Formula
Total branch sales ÷ number of branches.- Example
- $60M ÷ 40 branches = $1.5M per branch.
- What good looks like
- there is no universal number — compare each branch to the network average and to its own trend, adjusting for market size, to spot the highest- and lowest-performing locations
- Weak → strong
- "Sell more in branches" → "Lift average sales per branch from $1.5M to $1.7M this fiscal year, owned by the regional sales director, reviewed quarterly by branch"
Number of Workflow Processes Implemented
LeadingCounts the processes that the bank has created or revised to improve workflows and operations.
- Formula
Count of processes created or revised and put into use during the period.- Example
- 8 new + 4 revised = 12 processes.
- What good looks like
- there is no universal number — a count alone rewards activity, so pair it with the cycle-time or error-rate change each new process was meant to deliver
- Weak → strong
- "Improve our workflows" → "Implement 12 redesigned workflow processes this year, each with a measured cycle-time reduction, owned by the process improvement lead"
Why Track Key Performance Indicators For Banks
Why go to all the trouble of monitoring KPIs? Because these metrics provide important insights into how your bank and its employees perform. You’ll know what’s contributing to your profit and what’s not, so you can make strategic decisions on everything from hiring to resource allocation.
Ultimately, KPIs evaluate the success of your bank and quantify its performance in tangible ways for your leadership and stakeholders.
Elevate Your Banking Performance with ClearPoint Strategy Software
Ready to optimize your bank's performance with the right KPIs? ClearPoint Strategy is here to guide you. Our comprehensive software solution makes it easy to define, track, and manage key performance indicators that are critical to your bank’s success.
Discover how ClearPoint Strategy can transform your approach to performance management. Book a personalized demo with our experts and see how our software can help you streamline your processes, improve compliance, and drive profitability.
Common questions
What are the top 5 KPIs that banks should track?
The top 5 KPIs that banks should track are:
- Net Interest Margin (NIM): Measures the difference between the interest income generated and the amount of interest paid out to lenders.
- Loan-to-Deposit Ratio: Indicates a bank's liquidity by comparing its total loans to its total deposits.
- Non-Performing Loan (NPL) Ratio: Tracks the percentage of loans that are in default or close to being in default.
- Cost-to-Income Ratio: Measures the bank’s efficiency by comparing its operating costs to its operating income.
- Return on Assets (ROA): Indicates how profitable a bank is relative to its total assets.
How can banks use KPIs to improve their performance?
Banks can use KPIs to improve their performance by:
- Identifying Weak Areas: Pinpointing areas that need improvement based on KPI data.
- Setting Clear Goals: Establishing specific, measurable targets for improvement.
- Monitoring Progress: Regularly tracking KPIs to assess progress and make adjustments.
- Enhancing Decision-Making: Using data-driven insights to make informed strategic decisions.
- Employee Alignment: Ensuring that employees understand and work towards achieving key performance goals.
What are some common challenges that banks face when implementing KPIs?
Common challenges banks face when implementing KPIs include:
- Data Quality: Ensuring accurate and consistent data collection.
- Complexity: Managing the complexity of integrating multiple data sources.
- Resistance to Change: Overcoming resistance from staff to new performance measurement systems.
- Alignment: Aligning KPIs with overall strategic goals and objectives.
- Continuous Monitoring: Maintaining regular and effective monitoring of KPIs.
How can banks measure the success of their KPI programs?
Banks can measure the success of their KPI programs by:
- Achieving Targets: Comparing KPI results against predefined targets and goals.
- Improving Performance: Noting improvements in key performance areas over time.
- Stakeholder Satisfaction: Assessing feedback from stakeholders, including customers and employees.
- Operational Efficiency: Observing enhancements in operational efficiency and cost management.
- Financial Health: Evaluating improvements in financial indicators such as profitability and liquidity.
What are the future trends in bank KPIs?
Future trends in bank KPIs include:
- Digital Transformation Metrics: Tracking digital adoption and customer engagement with online banking services.
- Customer Experience KPIs: Measuring customer satisfaction, net promoter scores (NPS), and retention rates.
- Sustainability Metrics: Incorporating environmental, social, and governance (ESG) factors into KPI tracking.
- Real-Time Analytics: Utilizing real-time data analytics for faster decision-making and responsiveness.
- Advanced Risk Management: Developing more sophisticated risk management KPIs to address emerging financial threats.