

From completion rates to staff sizes and more, the data from our 2026 Strategic Planning Report reveals what each sector does best — and where execution breaks down.
Every industry thinks its strategic planning challenges are unique.
- Project completion varies sharply by sector: Energy and Utilities lead at 25.81%, while nonprofits trail at 5.29% — the same framework, very different results.
- Plan structure differs as much as execution — government plans run lean on goals (median of five) but heavy on milestones, while manufacturing carries the most goals.
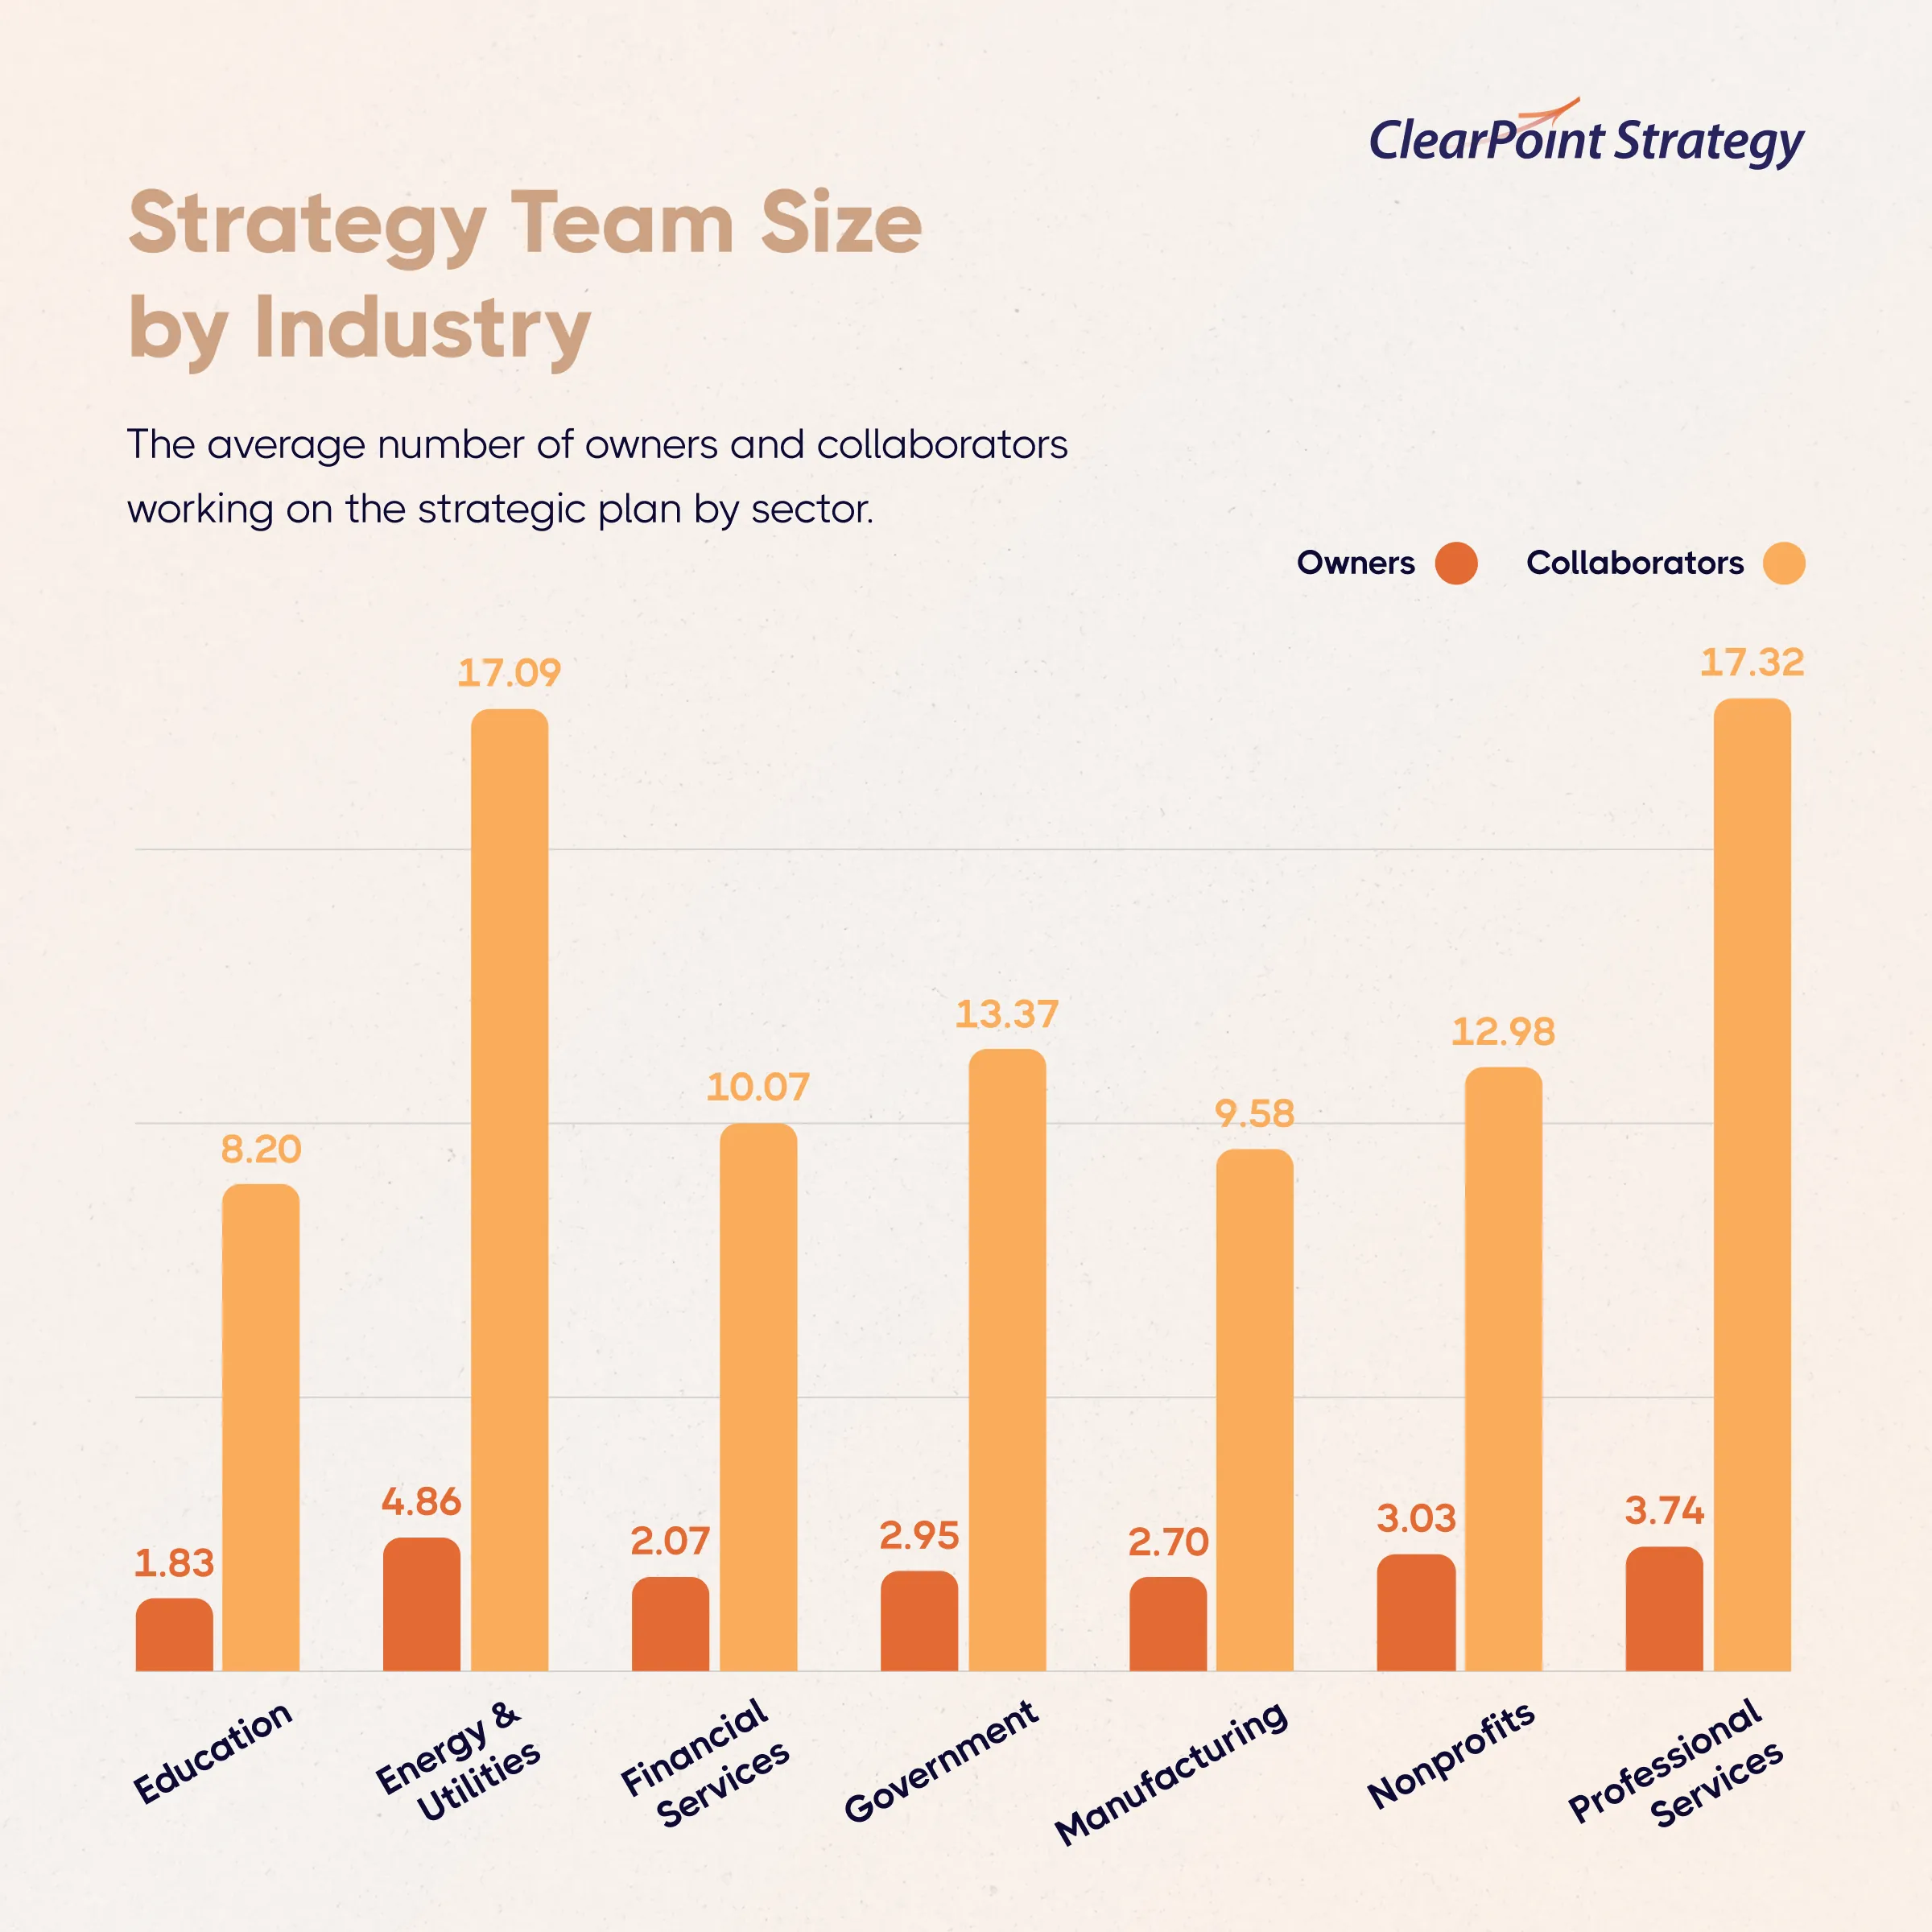
- Team size alone does not predict execution: Professional Services staffs the most collaborators yet ranks near the bottom on completion.
- No industry has solved ownership — across the dataset, 74.3% of goals, 71% of measures, and 68.2% of milestones have no named owner.
- High performers in every sector share three habits: plans small enough to govern, named owners, and a steady review cadence rather than annual check-ins.
Budget constraints. Regulatory pressure. Volunteer boards. Lean teams.
They’re right that the pressures differ. What surprises most people is how differently those pressures show up in the actual data.
ClearPoint’s 2026 Strategic Planning Report analyzed 31.2 million rows of activity data from 20,582 strategic plans across seven industries: Education, Energy & Utilities, Financial Services, Government, Manufacturing, Nonprofits, and Professional Services. The result is the most comprehensive cross-industry benchmark on strategic planning ever assembled.
Here’s what the data actually shows.
Want to reach more of your objectives this year? Learn how high performers achieve more by reviewing the data in our 2026 Strategic Planning Report.
Who Executes Best — and Who Struggles Most
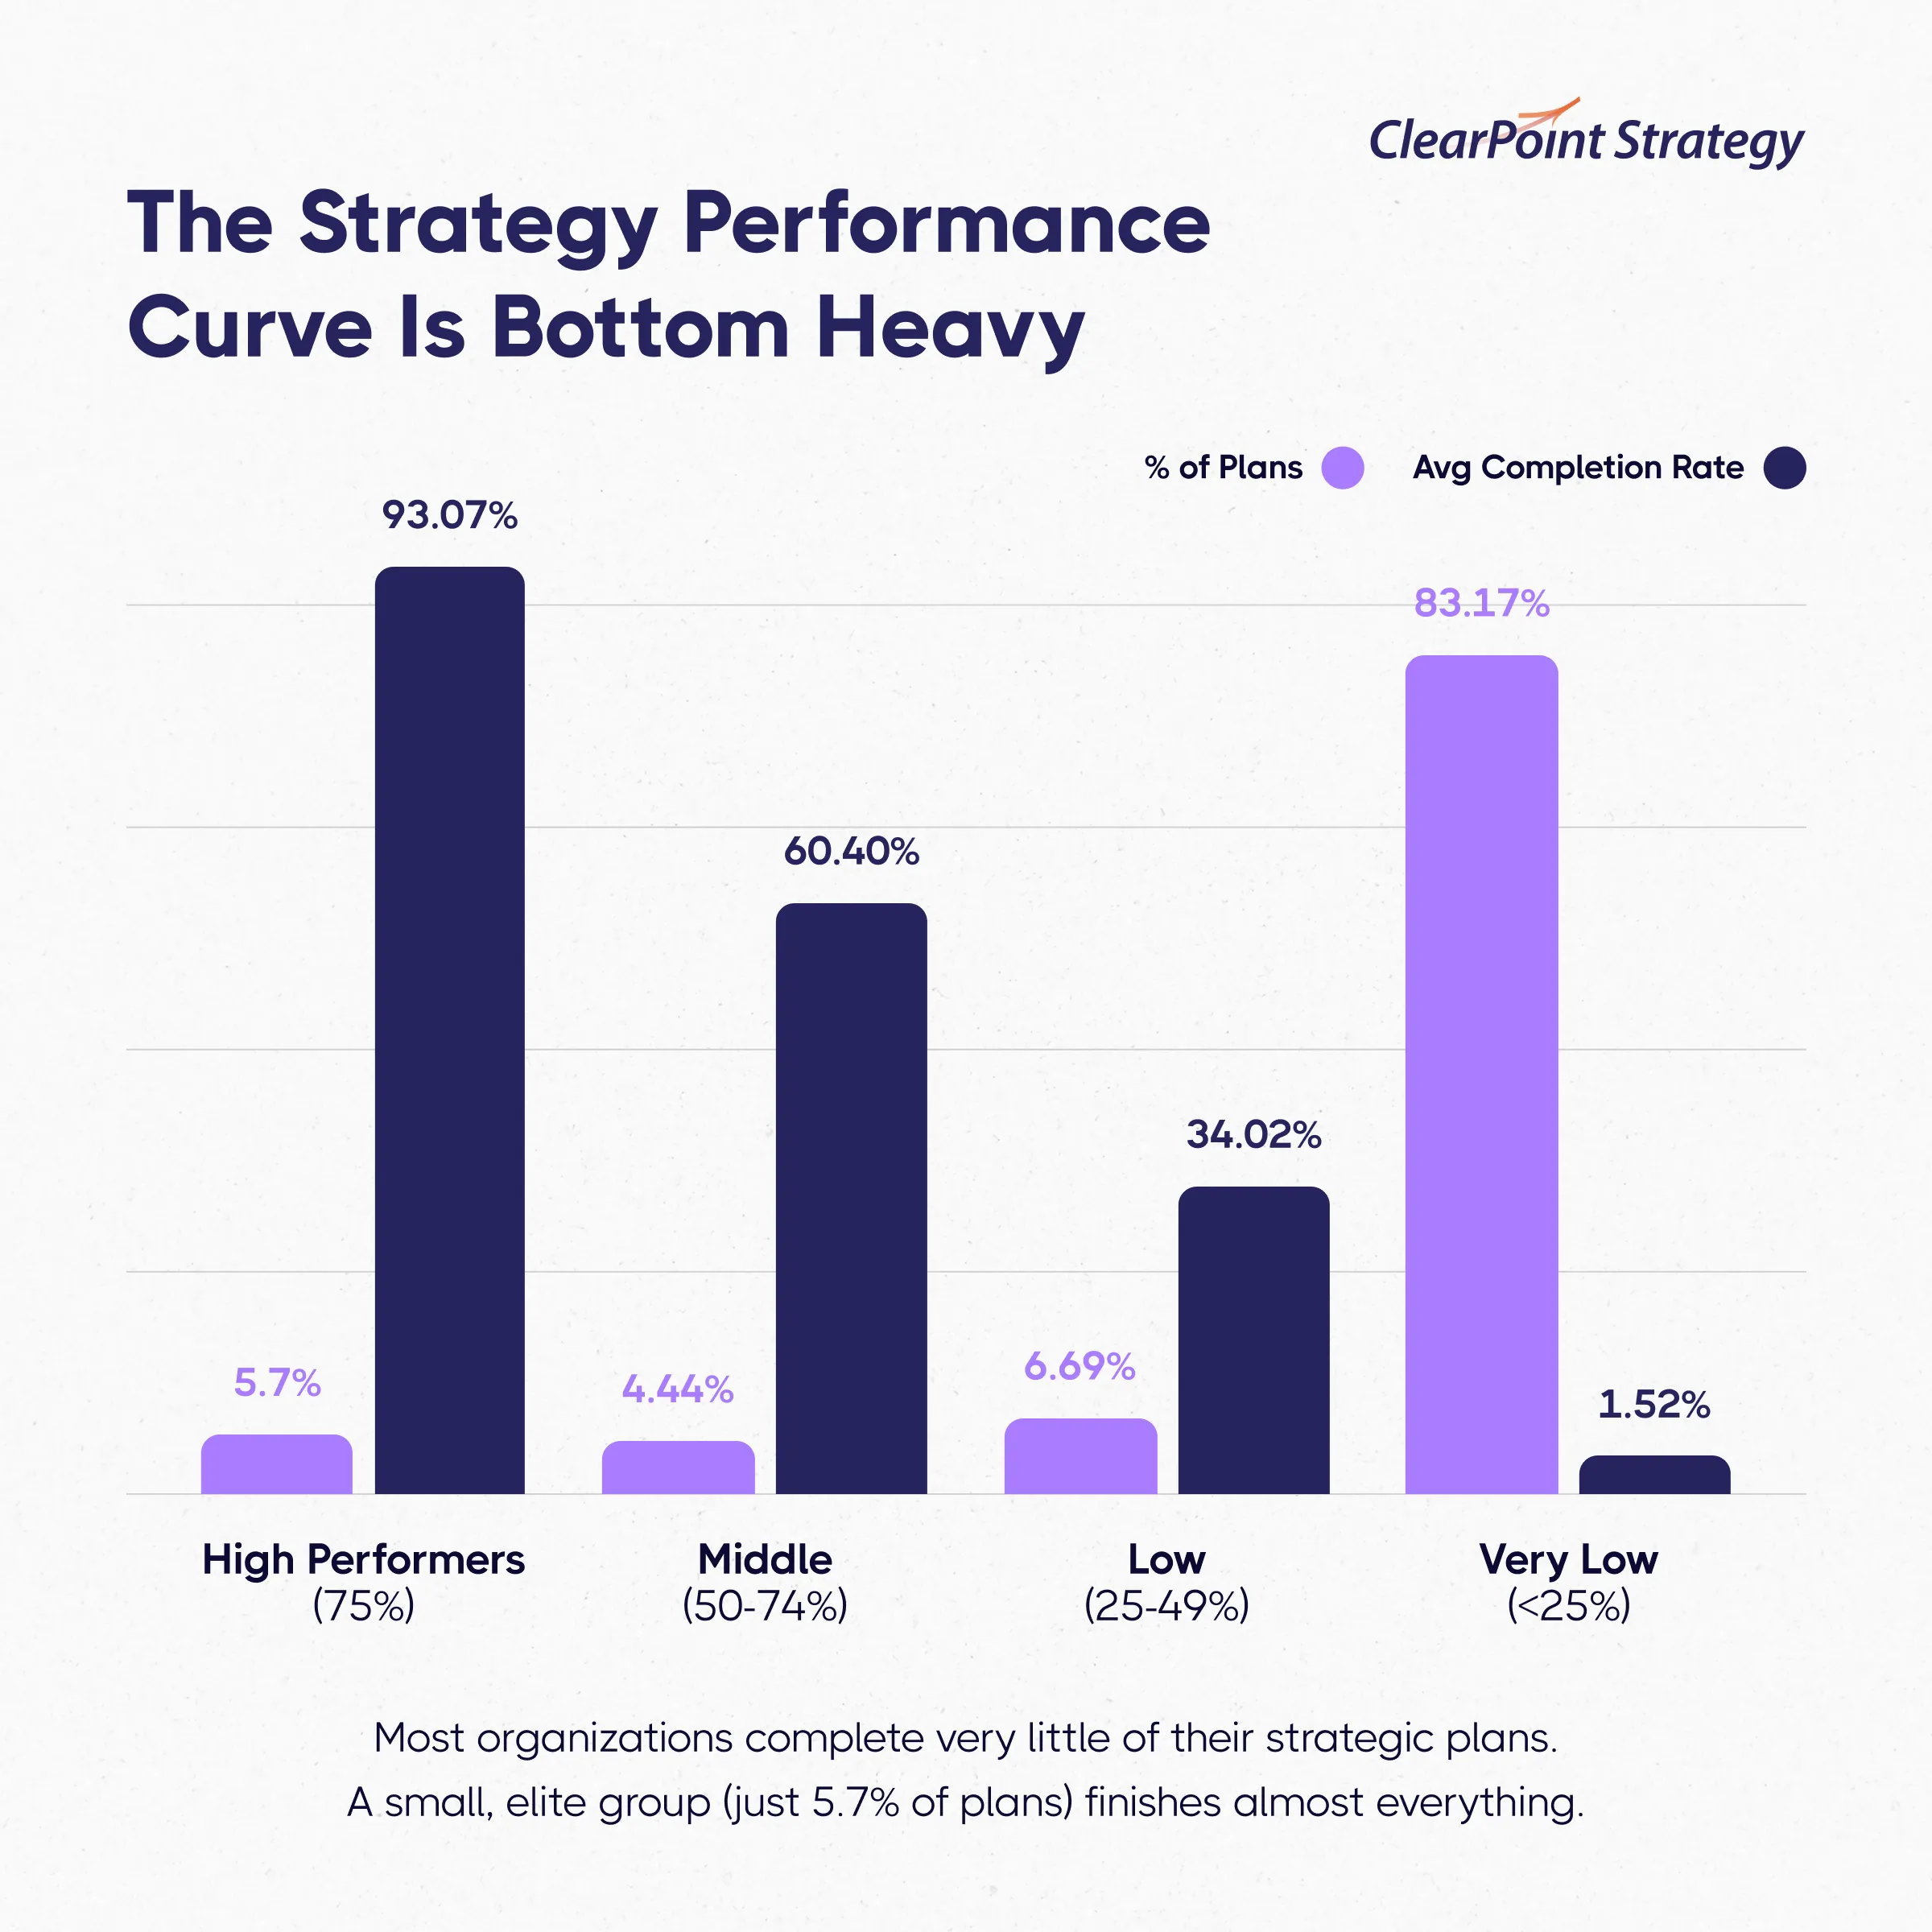
Project completion rate is the most direct measure of strategy execution. It answers the simplest question: Do organizations actually finish what they start?
The spread across industries is stark:
- Energy & Utilities: 25.81% — top performer by a wide margin
- Financial Services: 17.48%
- Government: 17.38%
- Manufacturing: 16.95%
- Education: 14.29%
- Professional Services: 9.05%
- Nonprofits: 5.29% — lowest of any sector
Even the best industry completes only about one in four strategic projects. That context matters. This isn’t a story about who’s succeeding and who’s failing. It’s a story about where the biggest gaps are and why they exist.
Plan Structure: Size Varies Significantly By Industry
How organizations structure their plans differs as much as how they execute them.
Goals — the top-level strategic priorities — vary widely by sector:
- Manufacturing, Nonprofits, and Professional Services: median of 10 goals — the highest
- Government and Financial Services: median of five goals — the leanest
That difference matters.
The data clearly shows that plans with fewer than 20 total elements succeed 68% of the time. Plans with 60 or more succeed just 8% of the time. Sectors with leaner goal counts tend to execute more cleanly.
Measures show even wider variation:
- Education tracks the most: median of 16
- Financial Services tracks the fewest: median of 11
Projects by industry:
- Education runs the most active projects: median of 13.9 — nearly double most other sectors
- Government, Financial Services, and Nonprofits: median around 5–6
Milestones show the biggest range of all:
- Energy & Utilities: median of 20 — highest by far
- Education: median of 13
- Nonprofits and Professional Services: median of 14
Team Size: Who Staffs Strategy and Who Doesn’t
Team size alone does not predict execution. Professional Services averages the most collaborators per plan and still ranks near the bottom on project completion. Government has far fewer owners and outperforms them significantly.
What the data actually shows is that the composition of the team matters more than its size:
- Energy & Utilities: 4.9 owners per plan, highest completion rate at 25.81%
- Professional Services: 17.3 collaborators per plan, completion rate of just 9.05%
- Government: 2.95 owners per plan, completion rate of 17.38%
More people with diffused accountability get less done than fewer people with clear ownership. More on that distinction — ownership — in the next section.
Ownership: The Gap That Runs Across Every Industry
No industry has solved the ownership problem. But some are closer than others.
Across the full dataset, the numbers are sobering:
- 74.3% of active strategic goals have no named owner
- 71% of measures lack an assigned owner
- 68.2% of milestones lack an assigned owner
- 56.75% of projects lack an assigned owner
And of the owners who are assigned, only 13.8% are active — meaning they’ve updated their element in the last 90 days. The other 86.2% are inactive.
This “phantom ownership” problem shows up across every sector. Plans look solid on paper. In practice, most elements are unowned and unmonitored.
The sectors that execute best — Utilities, Financial Services, Government — tend to have tighter ownership structures. Not perfect. But tighter.
What Each Industry Does Distinctively Well (and Poorly)
Energy & Utilities
Best at execution (25.81% completion). Highest milestone counts. Most owners per initiative. Regulatory discipline creates planning discipline.
The risk: Plans are complex, and complexity is always a threat.
Financial Services
Strong completion rate (17.48%). Lean goal counts and fewer measures suggest a focused, intentional approach to what gets tracked.
The risk: Small teams mean execution depends heavily on individual owners staying active.
Government
Solid completion (17.38%) relative to sector complexity. Government plans tend to be lean on goals (median of five) but heavy on milestones.
The risk: Wide variation in team size across jurisdictions creates inconsistent execution culture.
Manufacturing
Middle-of-the-pack completion (16.95%), with the most goals of any sector (median of 10).
The risk: High goal counts combined with complex project portfolios create overloaded plans that drag execution down.
Education
Below-average completion (14.29%) despite running the most projects of any sector (median 13.9).
The risk: Education organizations are doing a lot — the data suggests they may be doing too much. High activity, low completion is the signature of a plan that’s become an activity log rather than a strategic filter.
Nonprofits
Lowest completion rate (5.29%). Leanest teams. Highest ownership gaps.
The root cause isn’t effort — it’s structure. Missions are broad, teams are thin, and plans tend to grow to match the ambition rather than the capacity.
Professional Services
Surprising underperformer (9.05%) given the sector’s analytical sophistication. The data shows large teams but low completion — suggesting coordination complexity may be working against execution rather than for it.
The One Finding That Cuts Across Every Industry
Every industry struggles with the same fundamental problem: Plans are built to impress, not to run.
The high performers — in every sector — share three habits:
- Plans are small enough to govern without heroics (5–9 goals, 9–11 measures, 5–8 projects).
- Every element has one named owner, not a department or committee.
- Progress is reviewed quarterly, not annually.
The industry context changes the pressures. The execution fundamentals never change — period.
<p style="font-size:80%;"><em>Data sourced from ClearPoint Strategy’s 2026 Strategic Planning Report, which analyzed 31.2 million rows of activity data from 20,582 strategic plans spanning 2017 to 2024.</em></p>
<p style="font-size:80%;"><a href="https://www.clearpointstrategy.com/go/strategic-planning-report"><em>Download the full 2026 Strategic Planning Report</em></a><em> for complete benchmarks, methodology, and industry comparisons.</em></p>

%20OKRs%20Meaning%20A%20Practical%20Guide.png)