A gap analysis template you can fill in five lines, the four steps that close the gap, and the finding that reframes it: owned initiatives complete at 2.5x the rate.
- A gap analysis is a reading, not a report: where you are, where you said you'd be, and what the difference means.
- Across over 20,000 strategic plans, ClearPoint shows which strategic goals still need an owner.
- Give a goal an owner and it becomes nearly three times more likely to reach "on track": 42% of owned goals hit green.
- Projects can look healthy while the goals they serve lag, so check status at the goal level: 79% of projects that get a status are on track, versus 57% of goals.
- Run the four steps on one defensible metric, set a dated target, name the gap type, then build the plan around ownership.
A gap analysis is the discipline of comparing where you are to where you said you'd be, then diagnosing why the difference exists. Three questions do the work: where are we now, where did we plan to be, and what is the gap telling us. Most teams answer the first two and skip the third, which is the one that matters.
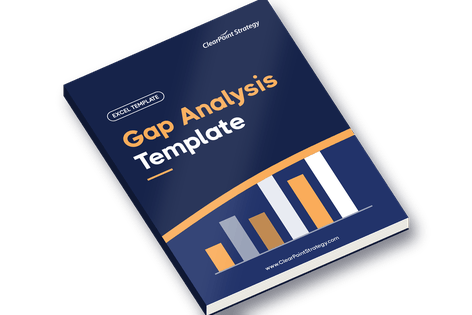
Here's the whole template in five lines. Copy it, fill it once per gap, and you've done a real gap analysis:
- Current state — the metric today, with a date and a source.
- Future state — the target, the deadline, and the assumption behind it.
- The gap — the difference, and which of four kinds it is (performance, tracking, definition, strategy).
- Root cause — five whys, run once, until you hit something you can change.
- Closing plan — one owner who controls the inputs, one action, one check-in date.
The structure is easy. Most gap analyses fail at line 5, when the gap goes to someone who can't move it. Across over 20,000 strategic plans we analyzed on the ClearPoint platform, the most common pattern is an ownership problem, not a strategy or math problem. Below are the numbers, a filled-in example, and the four steps.
A filled-in gap analysis template (steal this)
Templates are easier to use than to describe. Here is the five-line template filled in for a realistic example: a mid-size city trying to cut emergency response time. Swap in your own specifics.
If you'd rather build it than download a file, use the free gap analysis template. It works in the browser with no account, and asks for an email only if you want to export.
Look at what the template forced. A vague "improve response times" became a defended number, a dated target, a named gap type, and one owner who can pull the lever. Four of the five lines are easy. The fifth decides whether the strategy works.
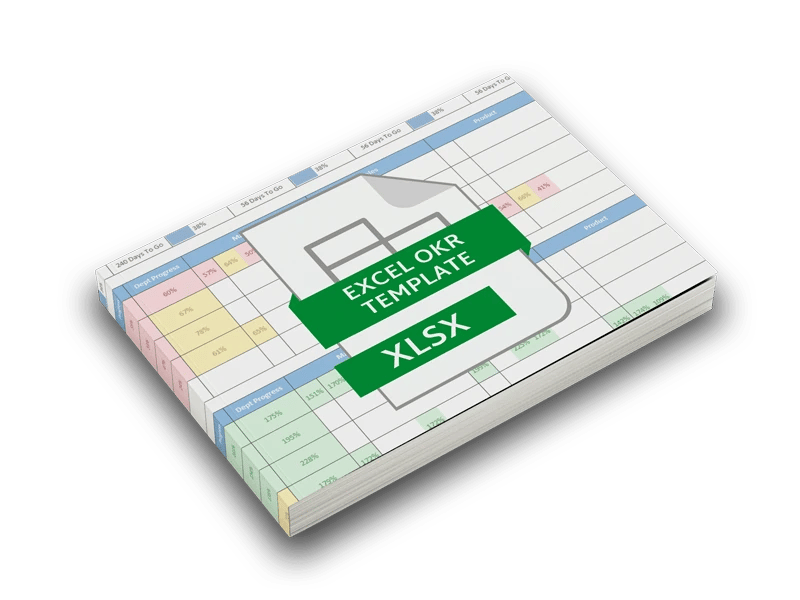
Download the gap analysis Excel template: the 5-line sheet, a worked example and all four gap types
What is a gap analysis, really?
Strip away the jargon and a gap analysis is a reading, not a report. You take where you are, hold it against where you said you'd be, and ask the difference what it means.
A gap analysis often pairs with a SWOT analysis earlier in the planning cycle. SWOT surveys the whole field, and a gap analysis measures the distance to one target inside it.
The third question is where most teams stop short. They treat the gap as a target to close. We've watched over 20,000 plans run, and the teams who close gaps reliably treat the gap as a diagnosis: a signal that something upstream is wrong. It may be the plan they built the goal from, the owner, the metric, or an assumption baked in years ago.
The rest of this article is about reading that diagnosis well. More often than not, it points to the same place.
The gap nobody measures: nobody owns the goal
Before the four steps, here are three findings from our platform that change the framing. They come from over 20,000 strategic plans, not a survey.
Finding 1 — Owned initiatives complete at 2.5× the rate
On our platform, initiatives with a named owner complete at 2.5× the rate (21.5% vs. 8.7%), and ClearPoint shows which objectives still need an owner. Unowned does not mean an owner who forgets to log in. It means no name in the box. The goal exists, it sits on a dashboard, and no one is accountable for moving it.
This is the gap your gap analysis can't see, because it's a gap in the plan's wiring, not in its numbers. You can run a flawless current-state-versus-target analysis and hand the result to no one.
Finding 2 — Give a goal an owner and it's nearly 3× more likely to be on track
This finding makes ownership the main issue rather than a nice-to-have. We split every objective into owned and unowned and looked at how many ever reached "on track."
Owned goals: 42% have hit green. Unowned goals: 15%. That's a 2.8× difference from one variable. It compounds, too: unowned goals are twice as likely to go their entire life without a single status update.
Finding 3 — Projects look healthy. The goals they serve don't.
This is the trap that catches everyone. Look at the work, meaning the initiatives and projects teams run to close gaps, and most of it looks fine. Among projects that get a status, 79% are on track. Now look at the goals those projects serve. Among the ones that get a status, 57% are on track, and ClearPoint shows which goals still need one.
Projects almost always look healthy. Goals often don't. Teams charter the project, work it, and ship it, and the goal it was meant to serve still isn't where the plan said it would be. If your gap analysis stops at "are we delivering the projects?" the answer is usually yes. That's not the gap that's hurting you.
After helping run gap analyses across more than 1,000 organizations, the pattern I keep seeing is this. Teams chase the number they can see, not the system that produced it. Closing a gap on paper is easy. Closing it in the dashboard takes ownership the org chart isn't drawn for.
How to do a gap analysis: 4 steps that actually close the gap
The structure works. Teams lose on execution. Here are the four steps, tied to what the data shows.
Step 1 — Anchor the current state to a metric you can defend
Pick one metric per gap analysis. It's tempting to run the analysis across every department at once, and the result is a 40-tab spreadsheet nobody reads. Defend the metric with three tests:
- It's owned by someone who controls the inputs.
- It updates at least monthly.
- A real person can answer "what would it take to move this by 10%?"
If it fails those tests, you don't have a metric. You have a placeholder. Good KPI examples help here. Borrow the metric definition instead of inventing one from scratch.
Tracking the right strategic objectives? Get the library of 56 strategic objectives
Step 2 — Set the target on a date, not a vibe
The future state needs three parts: the value, the date, and the assumption that justifies the trajectory. Most plans skip the third. This is where a disciplined strategic planning process pays off. The target should trace back to the same cycle that set the goal, not a number pulled fresh for this exercise.
"30% growth by 2029" is not a target. "30% growth by Q4 2029, assuming we close two enterprise deals per quarter and churn stays under 5%" is. The second version tells you exactly what to look for when the gap opens up. The assumption also matters for timing. The median strategic project on our platform takes nearly 10 months. If your target window is shorter than that and your plan needs new initiatives, the analysis is already wrong about timing.
Step 3 — Identify the gap, then ask what kind of gap it is
There are four kinds. They look identical on a chart. They need different fixes.
The 5 Whys exercise works as a triage here. Run it once. The answer at "Why #5" tells you which type of gap you're looking at. Across our platform, the most common "Why #5" is the same: the plan inherited the org chart instead of being designed around who can actually move the metric. A goal gets assigned to a department because the department's name matches the goal's keyword. Nobody checked whether that department could move it. When the strategy gap recurs across cycles, it is often a capability question, not an execution one. A quick VRIO framework pass will tell you whether the org has the resources to close it.
Step 4 — Build the closing plan around ownership, not action items
Once you know the kind of gap, the closing plan is short:
- Performance gap? Add an initiative. Set a 90-day check-in. Projects, on average, do get worked.
- Tracking gap? Assign a real owner before adding any new initiatives. There's no point launching a project to move a metric nobody is watching.
- Definition gap? Re-baseline. Move the target. Document the assumption that changed. It's politically uncomfortable and almost always right.
- Strategy gap? Pause the projects. Run a strategy review. This is rare. When it happens, doing more of what you were doing makes things worse.
Download the gap analysis Excel template and run these four steps on your own numbers
The four gap analysis mistakes we see most often
We get asked to look at gap analyses every week. These four show up over and over.
Mistake 1 — Running the analysis at the project level instead of the goal level
Teams ask "are our projects on track?" The answer is almost always yes. Then they wonder why the strategy is drifting. Run the gap analysis on the goal, not the work that's supposed to serve it. Check the goal against real strategic objective examples before you assume it was written well.
Mistake 2 — Confusing a delay with a gap
A project running 60 days late is a delay. A goal whose trend line is moving away from target is a gap. The delay can be project-managed. The gap has to be diagnosed. Treat one as the other and you lose months.
Mistake 3 — Never re-baselining
Targets set in 2022 against 2022 assumptions are still sitting in plans today. The gap they describe is partly real and partly an artifact of stale assumptions. Check for it in healthcare and higher education plans set before COVID. If a gap has stayed wider than 30% for four straight quarters, the issue may not be the work. It may be the target.
Mistake 4 — Assigning the goal to someone who can't move it
This is the big one, and the data backs it. Owned goals are nearly 3× more likely to hit green, so a closing plan that names the wrong owner, or no owner, goes nowhere. Before you finalize the closing actions, check that the named owner controls the inputs. If not, the gap is not where you think it is.
Get the ebook of 8 strategic planning templates
Two real gap analyses, two real turnarounds
Here's what this looks like in our customer base.
San Juan Regional Medical Center — the tracking gap that wasn't a strategy gap
San Juan Regional is a 198-bed Level III trauma center in Four Corners, New Mexico. Their gap analysis started simple: leadership needed faster, more reliable reporting against the hospital's Balanced Scorecard. The current state was half a day per management report, with departments tracking metrics in spreadsheets and printing them.
The team assumed the gap was a strategy execution problem. After running the diagnosis, it was a tracking gap. The old performance management software had been reduced to a data-storage tool. Reports couldn't be tailored. Metrics that once mattered were buried, no longer reviewed, no longer current.
The fix wasn't more strategy. It was giving each department its own scorecard tied to the master Balanced Scorecard, plus the ability to attach analysis and audit-traceable evidence. The result ClearPoint published with San Juan: an 89% reduction in reporting time for management reports and an 83% improvement in build time for new reporting requirements. Their DNV stroke accreditation audit, in the words of the hospital's quality control manager, "went flawlessly." The strategy hadn't been broken. The instrument measuring it had.
Source: ClearPoint case study — San Juan Regional Medical Center
City of Durham, NC — the gap analysis they had to run twice
Durham is the fourth-largest city in North Carolina, about 283,000 residents. The city launched its first formal strategic plan in 2011, on ClearPoint. By 2012, one year in, most departments had reverted to spreadsheets. A second gap analysis found the gap was in neither the strategy nor the software. It was in ownership. There was no clear accountability for performance measures. Updates were optional in practice. Without ownership, the plan went stale on contact with operations.
In 2014, Durham re-launched. This time, department directors were given explicit responsibility for their measures. Performance was linked to budget requests and employee evaluations. The city went from 22 spreadsheets with over 100 tabs to a single ClearPoint instance shared with Durham County for joint initiatives. The outcomes the city published:
- Reduced background-check staffing by four positions with no impact on community safety, because the data showed the workload didn't justify the headcount.
- Avoided hiring four to five communication officers per year after data showed the city was already hitting a 95% emergency-response level.
- A joint city-county CPR/AED training program that has trained over 1,700 Durham Public Schools students.
Durham's strategic plan project manager Jay Reinstein put it plainly: "With data now driving decision making, it's all about results." The first gap analysis Durham ran was correct on the math and wrong on the diagnosis. The second one, which worked, looked past the metrics to who was responsible for moving them.
Source: ClearPoint case study — City of Durham
Closing the gap with ClearPoint
A gap analysis produces three things at minimum: a defended metric, a target with a date, and a closing plan with an owner. ClearPoint's job, after the analysis, is to keep those three things from quietly falling apart over the ten months the work takes.
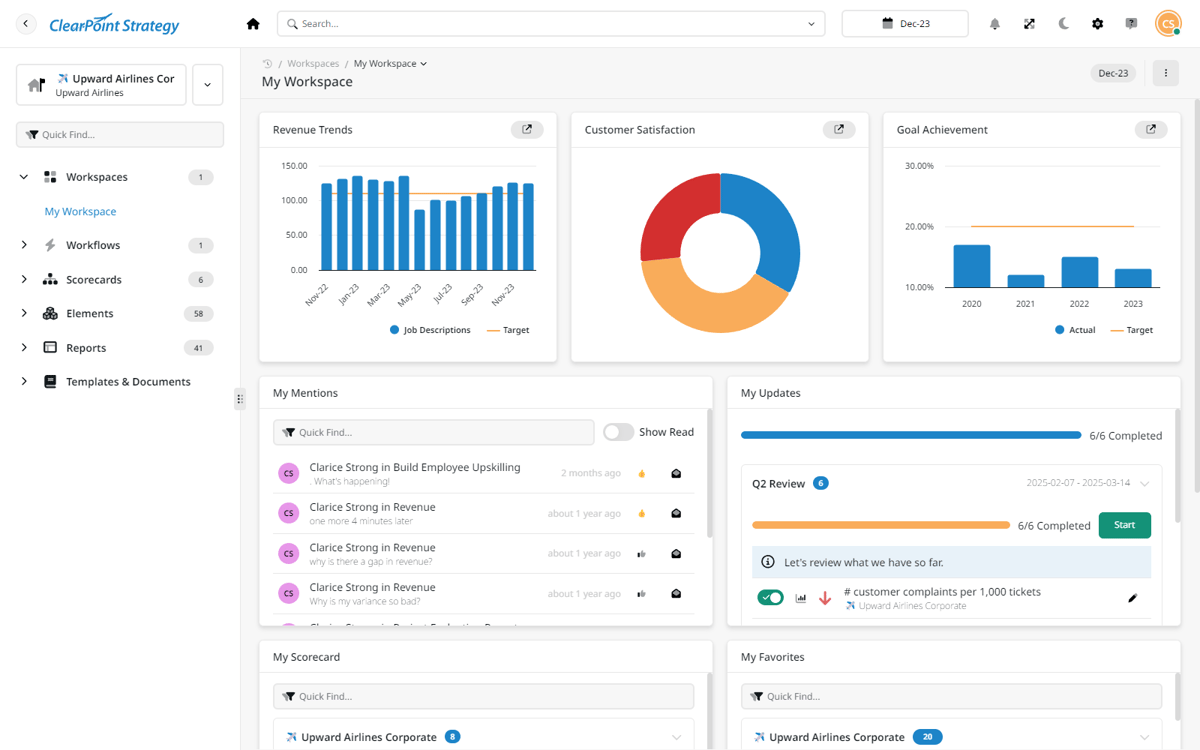
Wire each gap to the metric and the goal it serves. Every gap gets linked to the measure it tracks and the objective it supports. When the measure updates, the goal updates, and the dashboard shows the closing trajectory in real time. You stop running the gap analysis quarterly because the gap is reported daily.
Make ownership visible, and make missed updates visible too. The no-owner problem costs real money. ClearPoint shows the last-update date on every measure, sends automated reminders to assigned owners on the cadence you set, and escalates when measures go stale. Make accountability impossible to hide and the ownership gap starts to close.
Run the closing plan as projects, with the same rigor as the goal. Initiatives live alongside the measures they're meant to move, with dashboards, Gantt charts, RAG status and dependencies in one view. When an initiative is on track but the measure isn't, the system shows you the gap between the two. That's the diagnostic from Step 3, automated.
Report once, distribute everywhere. Reporting is what kills follow-through. ClearPoint assembles monthly, quarterly, and annual scorecards from the same data, so different audiences read one source of truth. San Juan's 89% reduction in reporting time is what happens when the report stops being built by hand.
See how ClearPoint would run your plan — book a demo
See your gap analysis through
A gap analysis is not a document. It's a question you keep asking until the answer stops surprising you. Most plans don't fail because the gap was too wide. They fail because the goal belonged to no one, and no strategic planning software closes a gap nobody was assigned to own. The hard part was never the math. It's making sure someone owns the gap you just found.
Download the gap analysis Excel template before you run your next one
Common questions
What is a gap analysis?
A gap analysis compares where you are now to where you planned to be, then diagnoses why the difference exists. It has three parts: the current state (a defended metric), the future state (a target with a date and an assumption), and the gap itself — read not as a number to close but as a signal about what's wrong upstream in the plan, the owner, the metric, or the assumptions.
What goes in a gap analysis template?
Five things: a current-state metric with a date and source; a target with a deadline and the assumption behind it; the gap and which of four types it is (performance, tracking, definition, strategy); a root cause from running the 5 Whys once; and a closing plan with a single owner who controls the inputs, one action, and a check-in date. The template is easy to fill — the discipline is in naming an owner who can actually move the metric.
What are the four types of strategic gap?
Performance, tracking, definition, and strategy. A performance gap means the work isn't producing the result. A tracking gap means the metric isn't being updated because no one is really watching it. A definition gap means the target was set against assumptions that no longer apply. A strategy gap means the projects are delivering but the goal is still wrong. Each looks identical on a chart and needs a different fix.
What is the most common mistake in a gap analysis?
Running it at the project level instead of the goal level. On the ClearPoint platform, projects that get a status are on track 79% of the time, and the goals they serve 57% of the time — and ClearPoint shows which goals still need an owner. Teams chase project completion and miss the gap between projects-delivering and goal-still-failing.
How often should you run a gap analysis?
Once a quarter as a formal exercise, but the underlying gap should be visible daily. The median strategic project on our platform takes nearly 10 months — long enough that quarterly reviews can lag the work. The teams who close gaps reliably treat the gap analysis as a continuous reading, not an annual event.