ClearPoint Strategy
2026 Strategic Planning Report

Media Kit

Want to reshare the data from our 2026 Strategic Planning Report in your news coverage or marketing? Below are some resources for you to use. If you have any questions or want to partner on a report together, email Alexandre Teulade at ateulade@clearpointstrategy.com.

The 2026 Strategic Planning Report by ClearPoint Strategy, cover with photos of city skylines
ClearPoint’s 2026 Strategic Planning Report offers an unprecedented view into organizational strategy. Our analysis of over 20,000 strategic plans over the last seven years reveals that the widest performance gap in business today is not strategic planning but strategic execution. The report highlights the factors that set top performers apart, proving that execution excellence is learnable — and achievable — for any organization.
‍🏅
The Execution Gold Standard
  • The 5-goal median is proving optimal. 
  • Lean KPI frameworks (9–11 measures) correlate with higher completion rates.
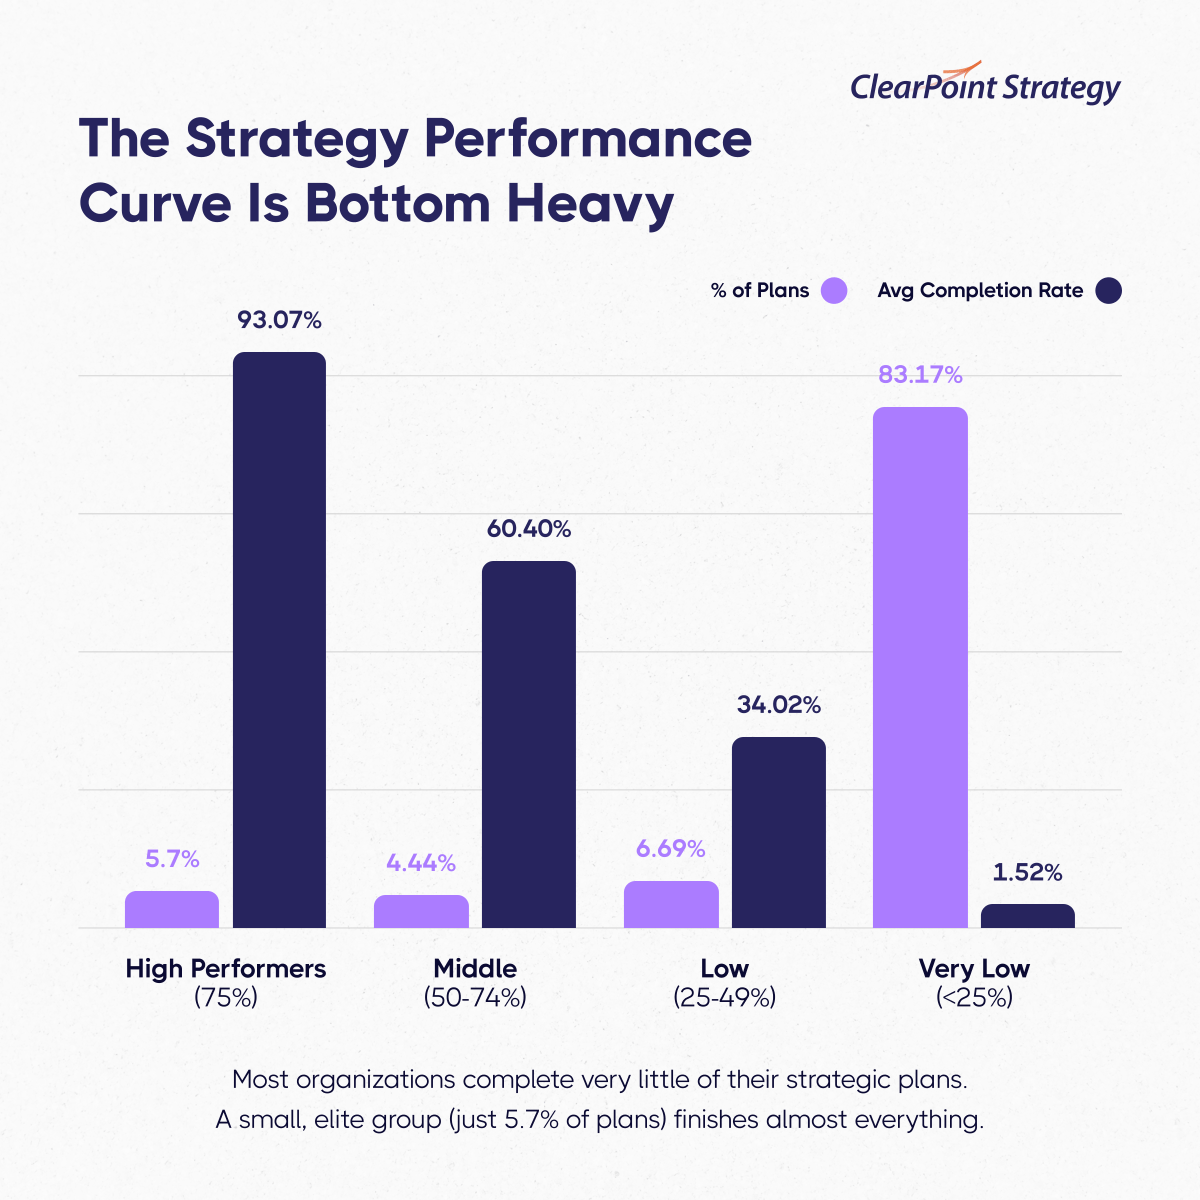
  • The top 5.7% of organizations average 93% strategy completion.
🏆
The Accountability Advantage
  • High performers have an average of 5 owners per strategic initiative.
  • 3–4 collaborators per owner promotes optimal performance.
  • Organizations that master strategic ownership will unlock 2–5x execution improvements.
‍📅
The Cadence Competency
  • Projects of 9–10 months show the strongest completion rates.
  • July is a natural strategic restart opportunity. 
  • August/September and early December review periods support high performance.
These are among the findings contained in our first annual 2026 Strategic Planning Report, which aggregates anonymized activity from ClearPoint accounts from 2017 to 2024. We analyzed 31.2 million rows of data spanning over 20,000 strategic plans, 117,547 active strategic goals, 317,809 active measures, and 130,324 active projects. We standardized the terminology, normalized accounts, and focused on medians and trends so comparisons are fair across organizations of different sizes.

To share the report, please link to:
https://www.clearpointstrategy.com/go/strategic-planning-report

Media Assets

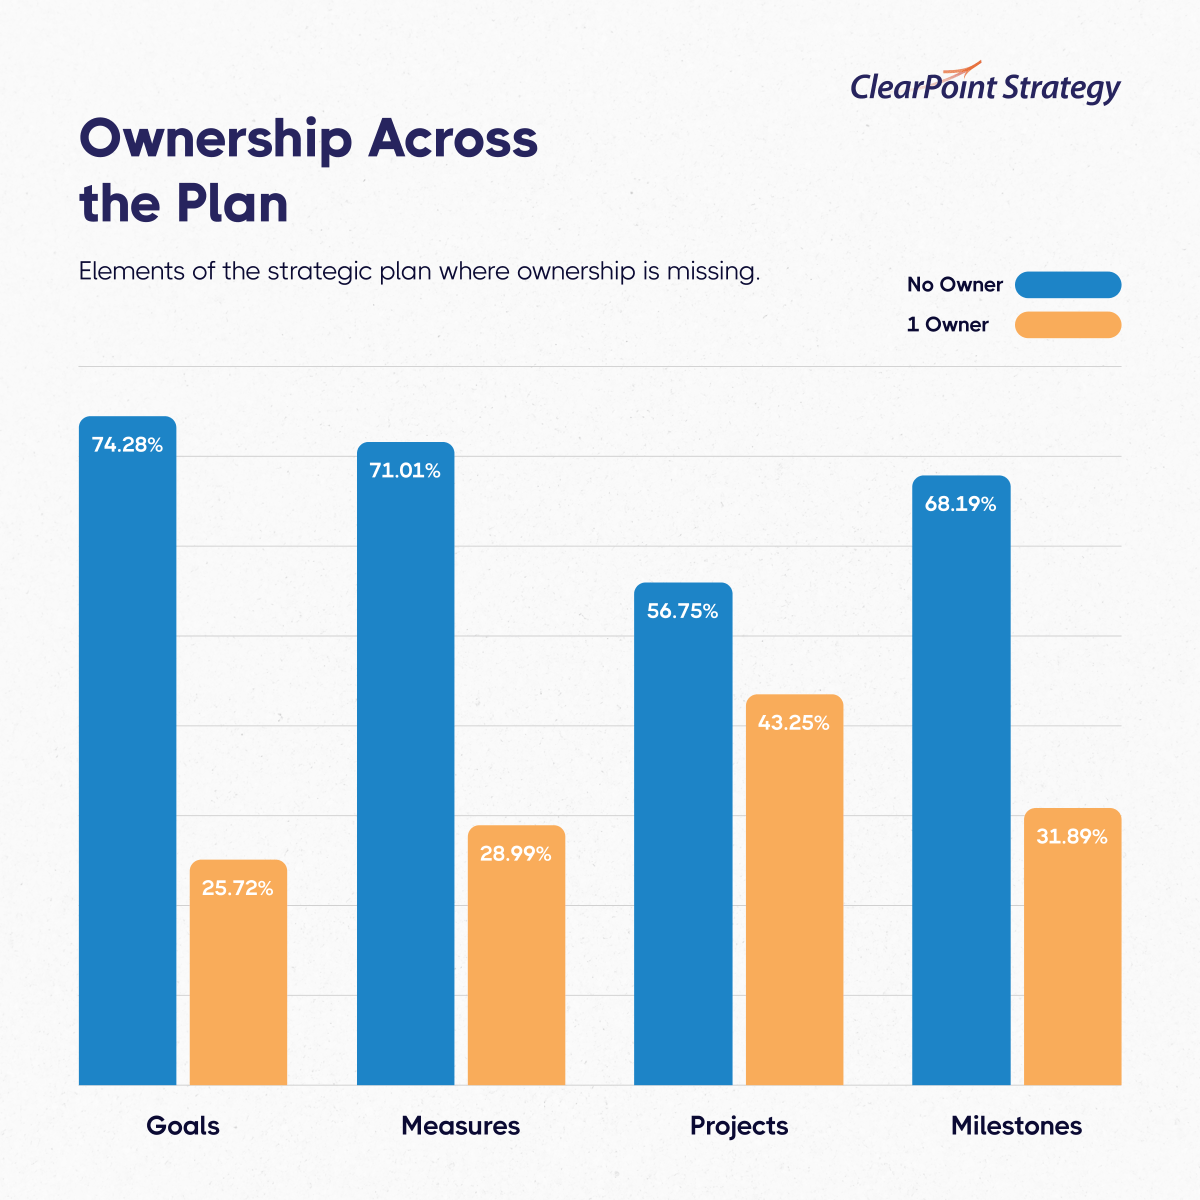
Ownership Across the Plan: bar chart of goals, measures, projects and milestones with no owner vs. one owner
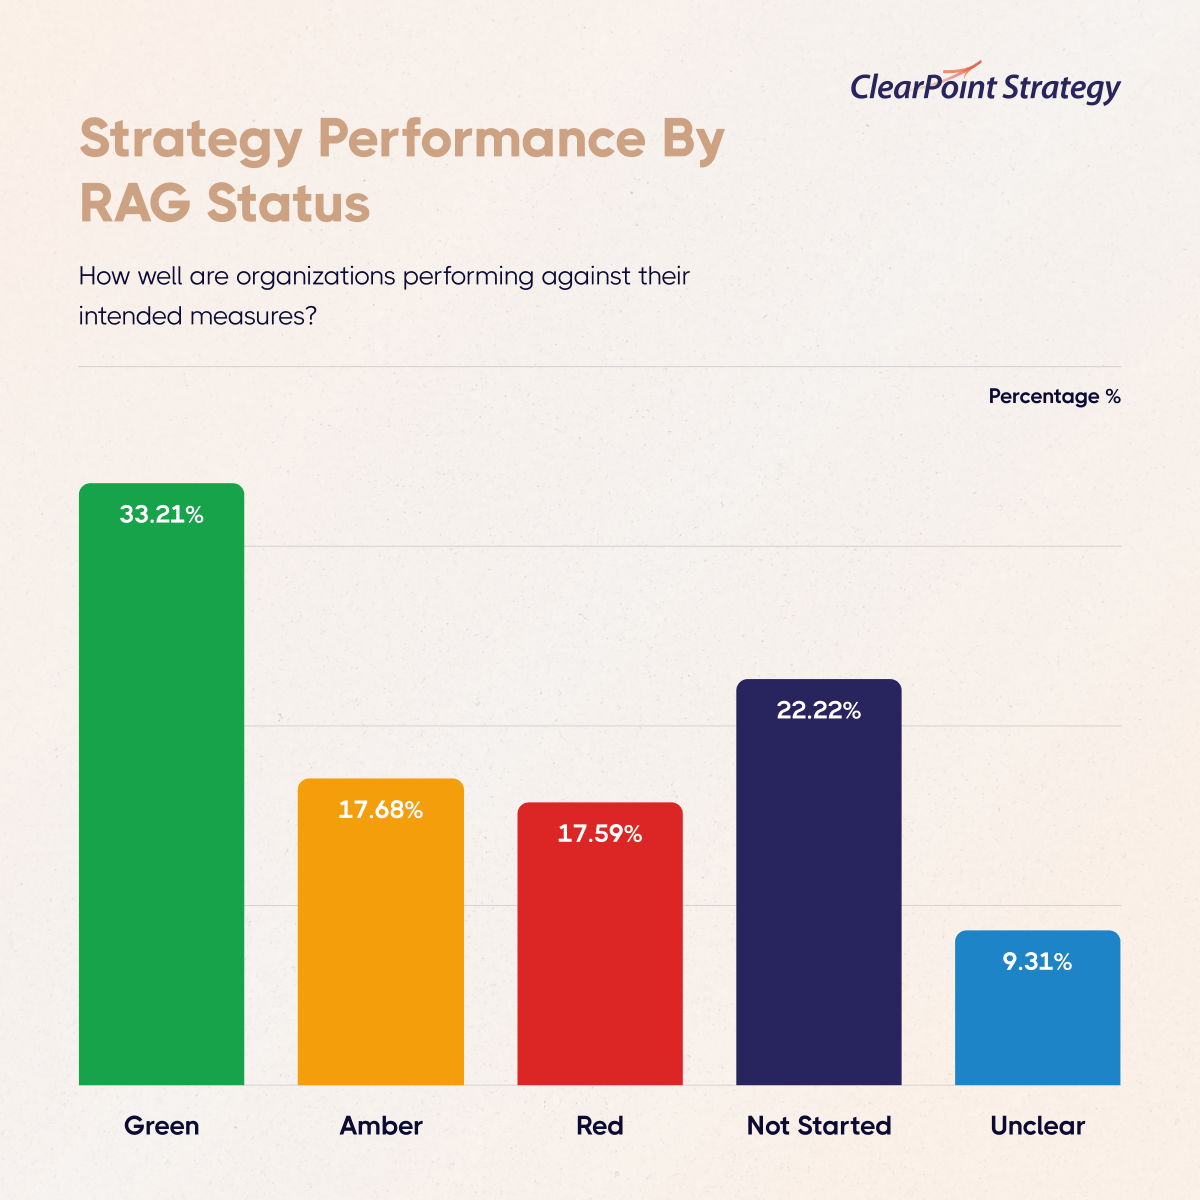
Strategy Performance by RAG Status: percentage of measures rated green, amber, red, not started or unclear
The Strategy Performance Curve Is Bottom Heavy: most organizations complete very little; a small elite group finishes almost everything
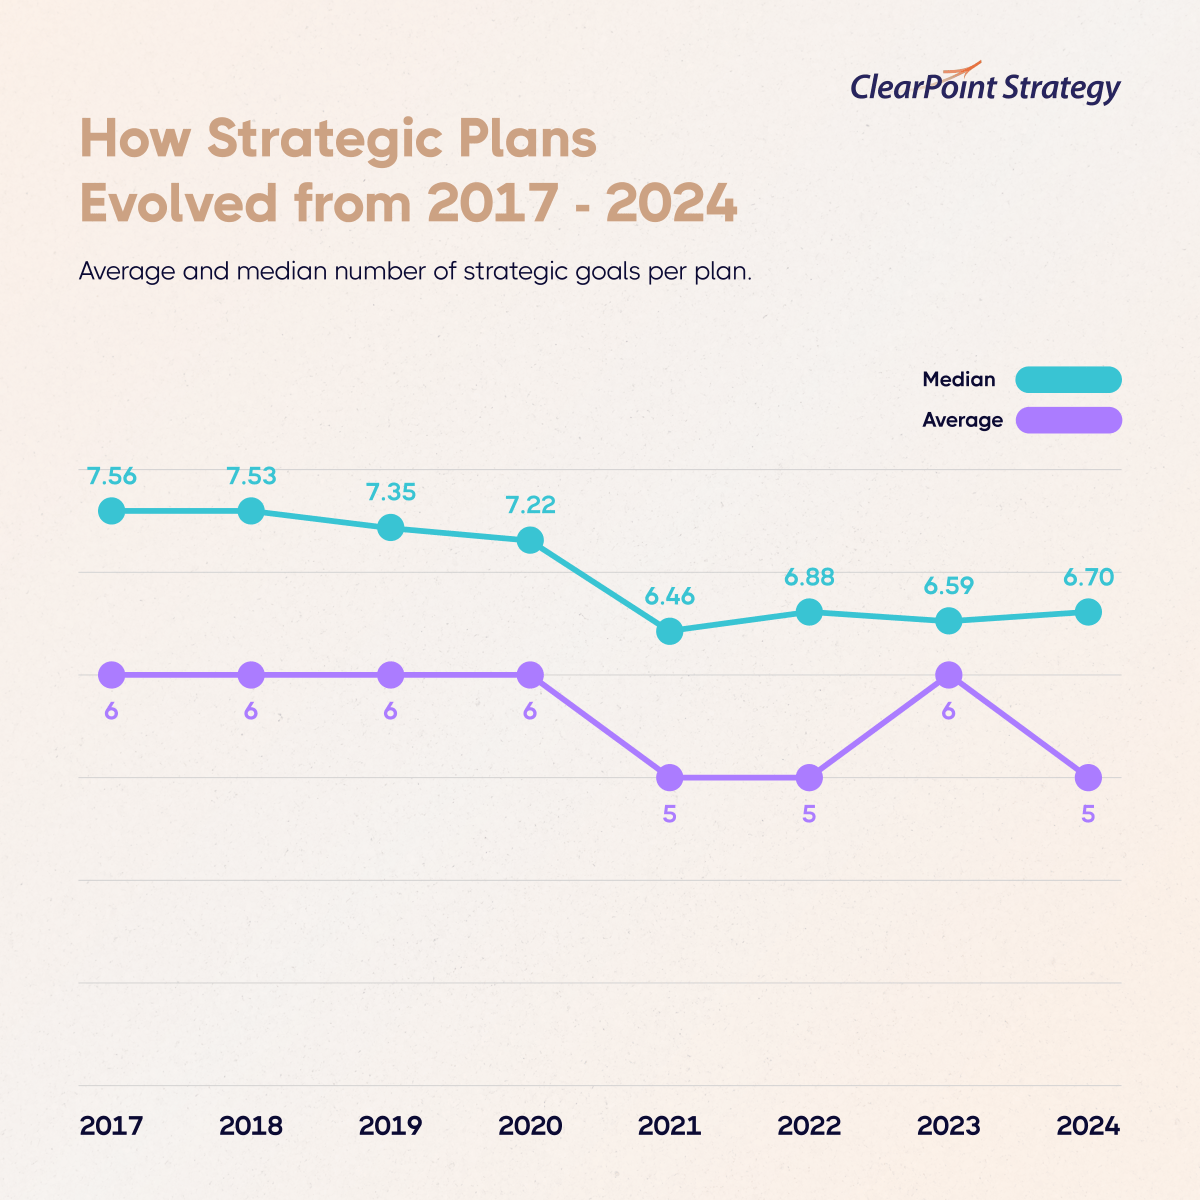
How Strategic Plans Evolved from 2017 to 2024: line chart of the average and median number of goals per plan
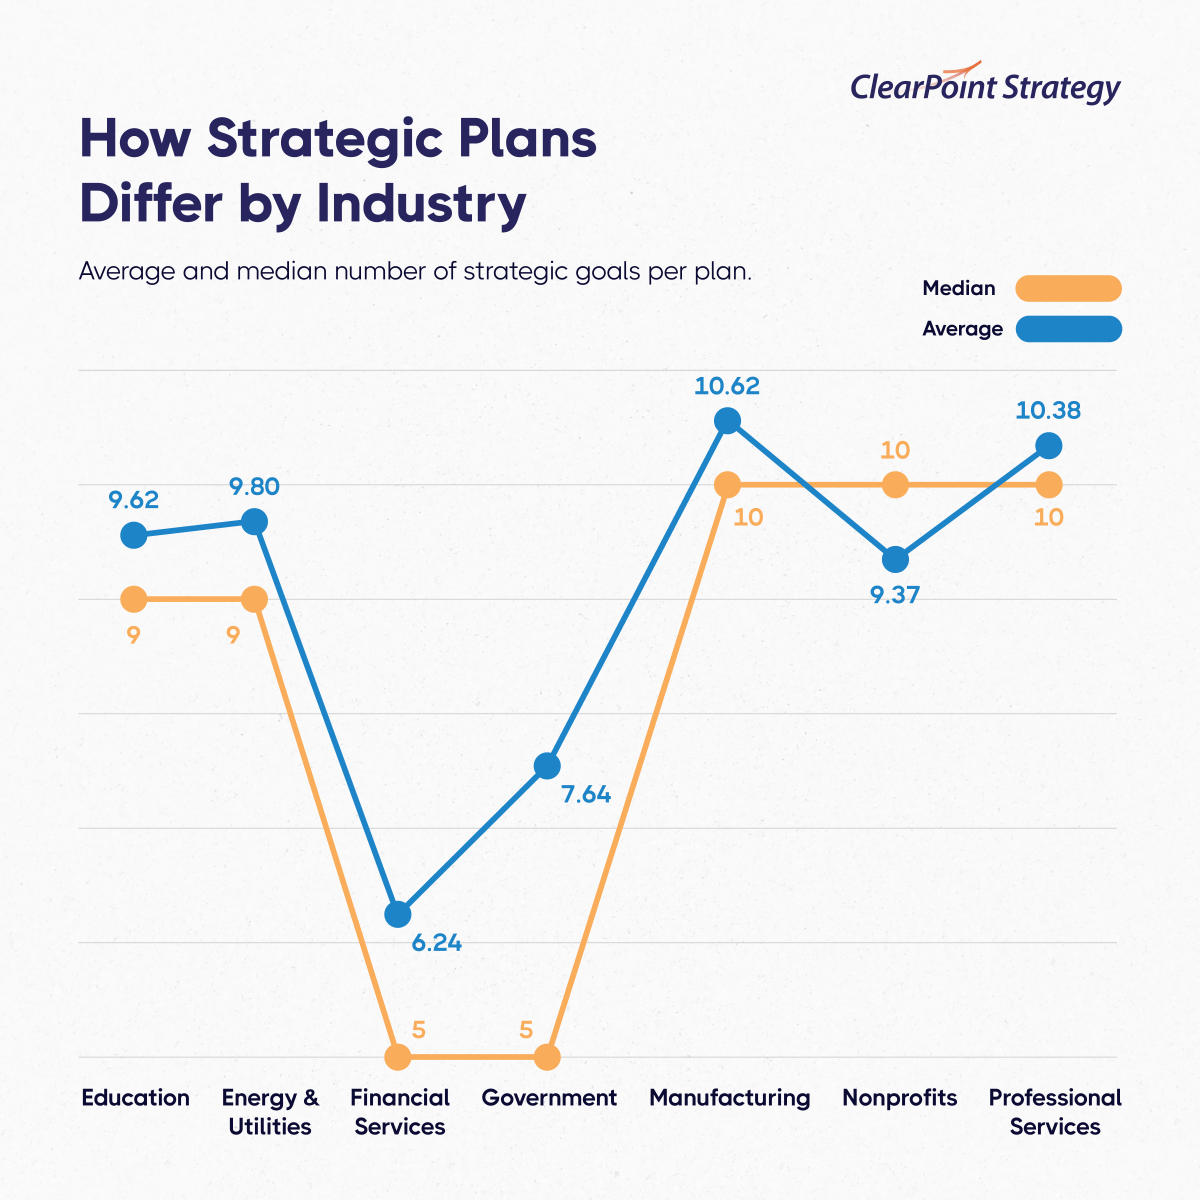
How Strategic Plans Differ by Industry: average and median number of strategic goals per plan, by industry
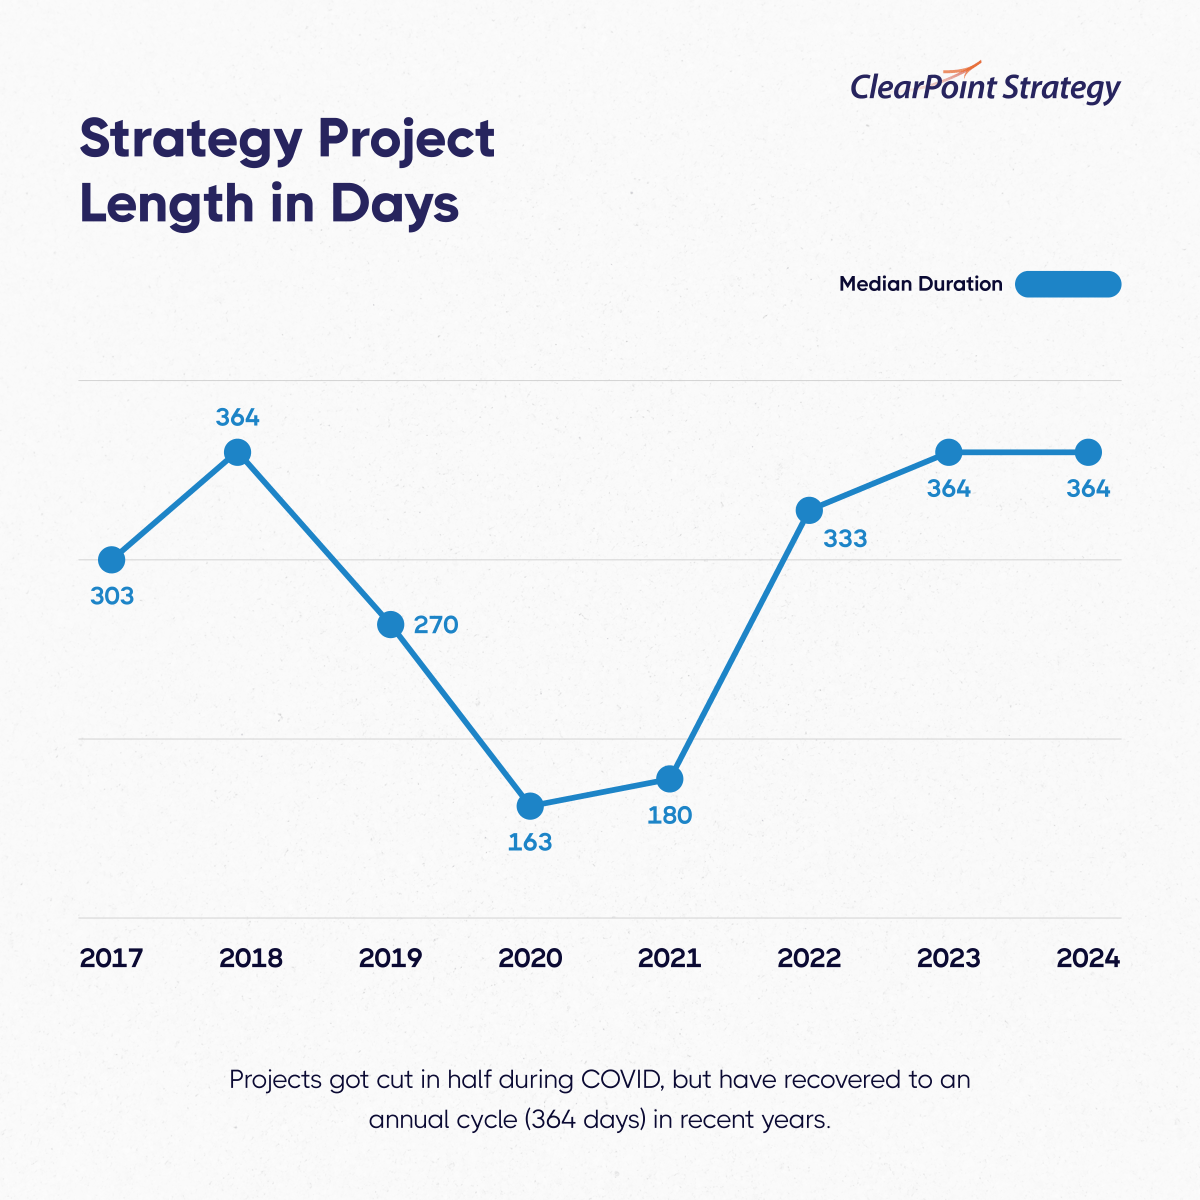
Strategy Project Length in Days, 2017–2024: projects were cut in half during COVID and have recovered to an annual cycle
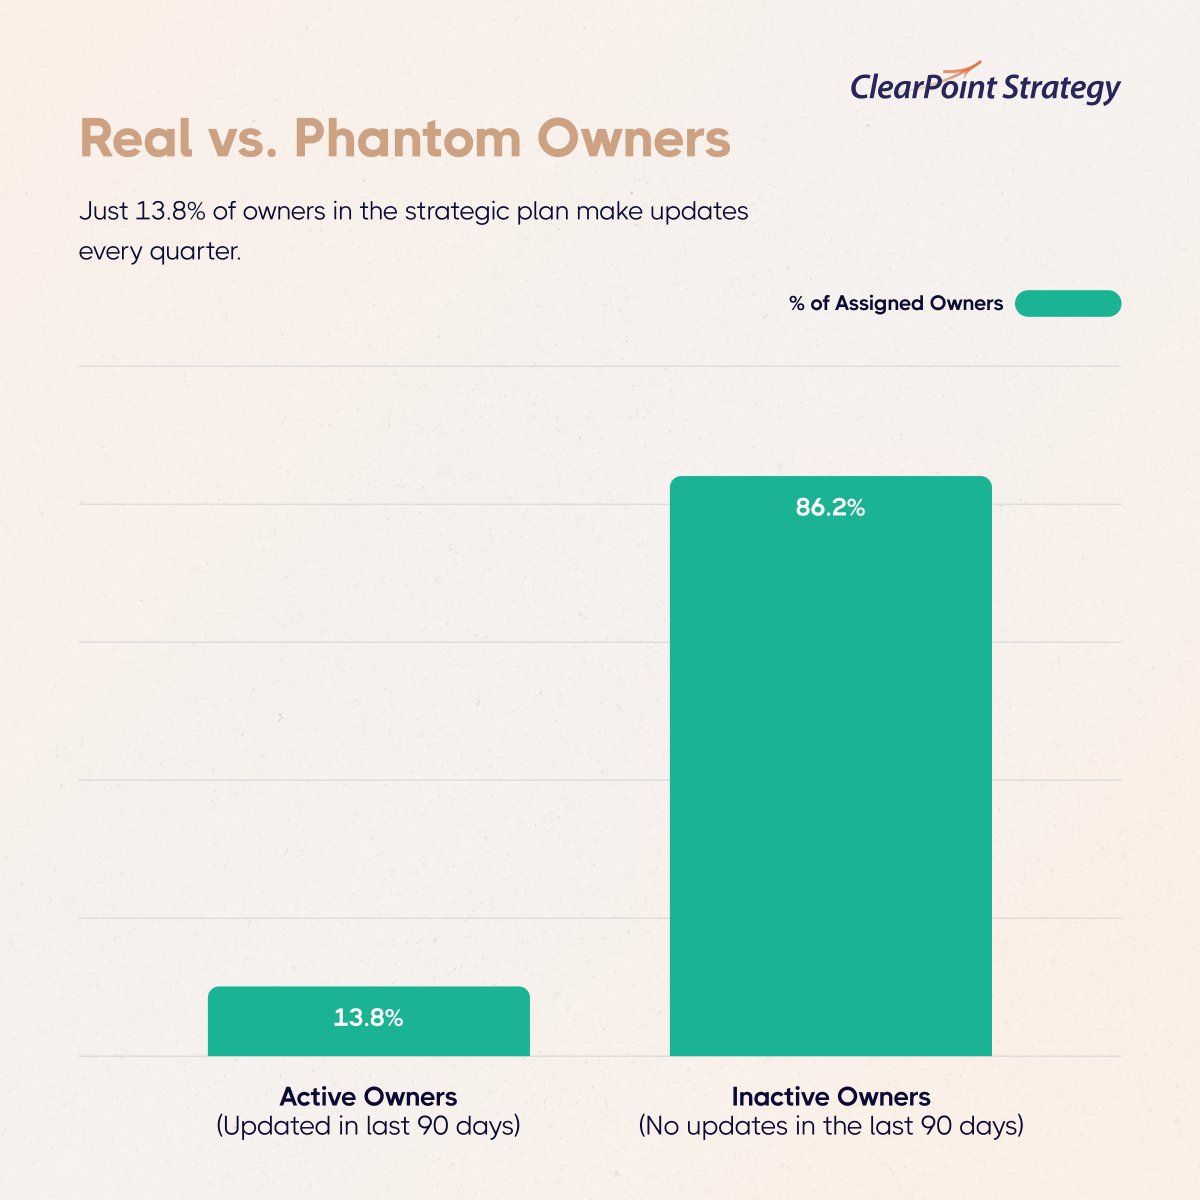
Real vs. Phantom Owners: bar chart showing most strategic plan owners made no update in the last 90 days
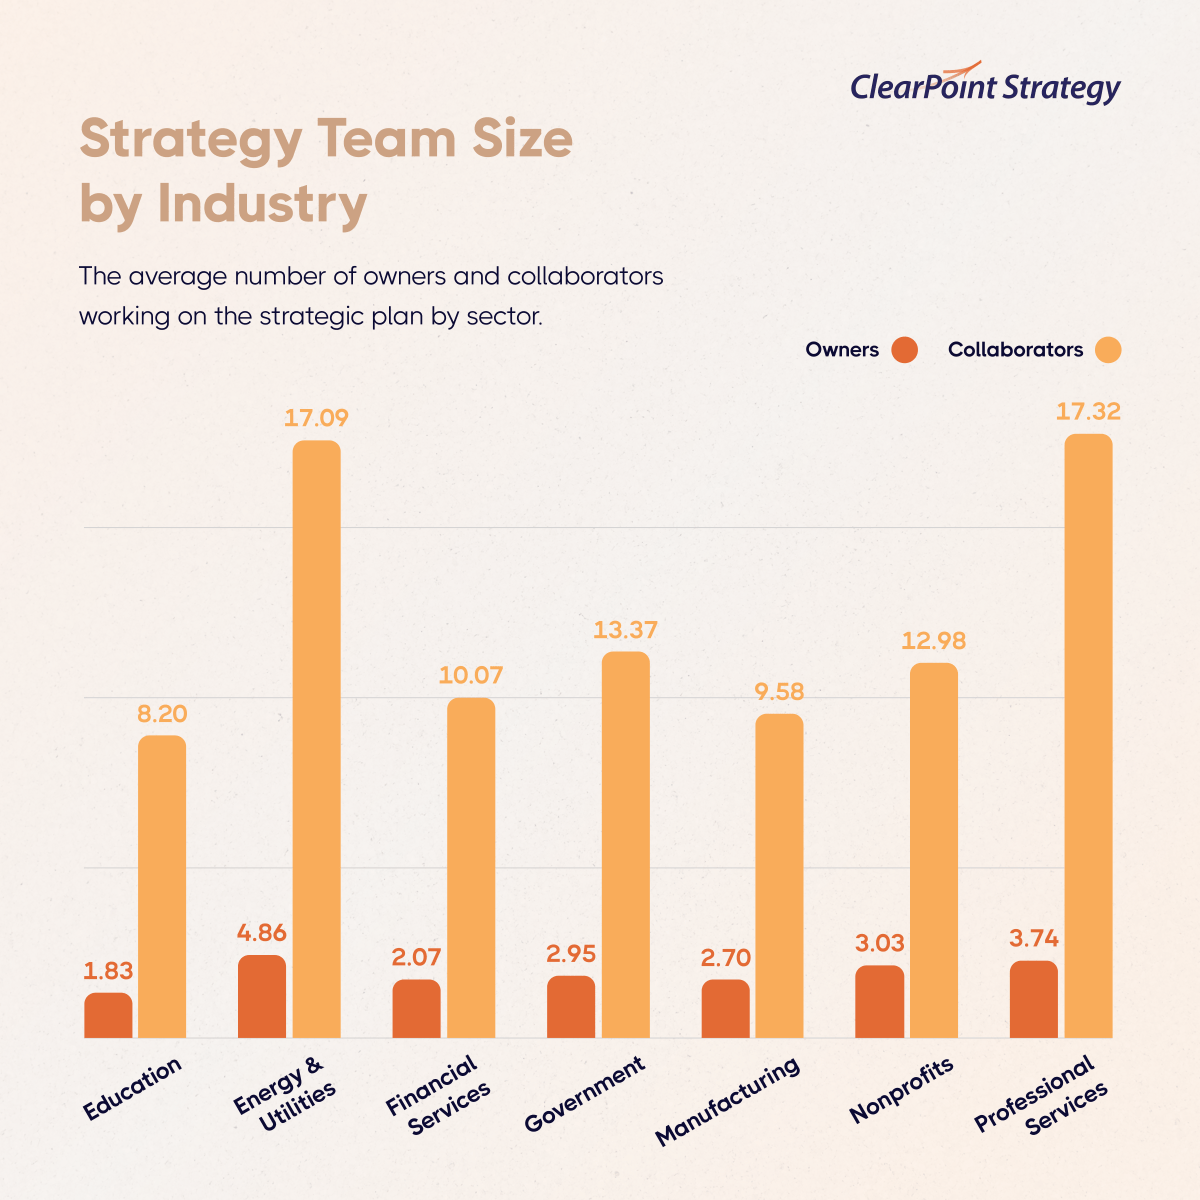
Strategy Team Size by Industry: average number of owners and collaborators working on the strategic plan, by sector
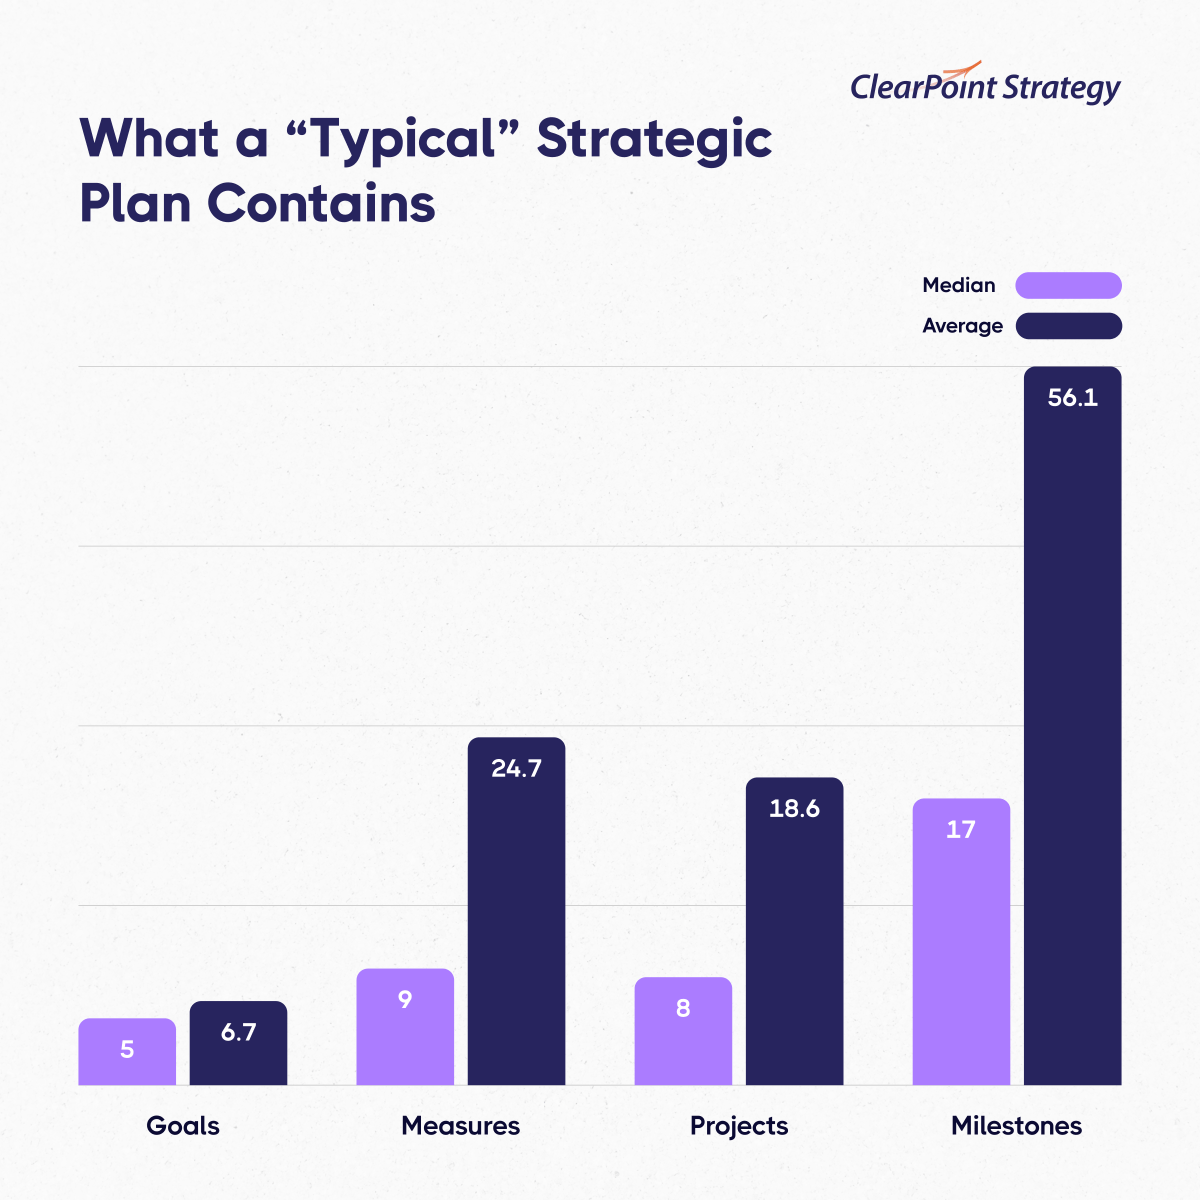
What a Typical Strategic Plan Contains: median and average number of goals, measures, projects and milestones
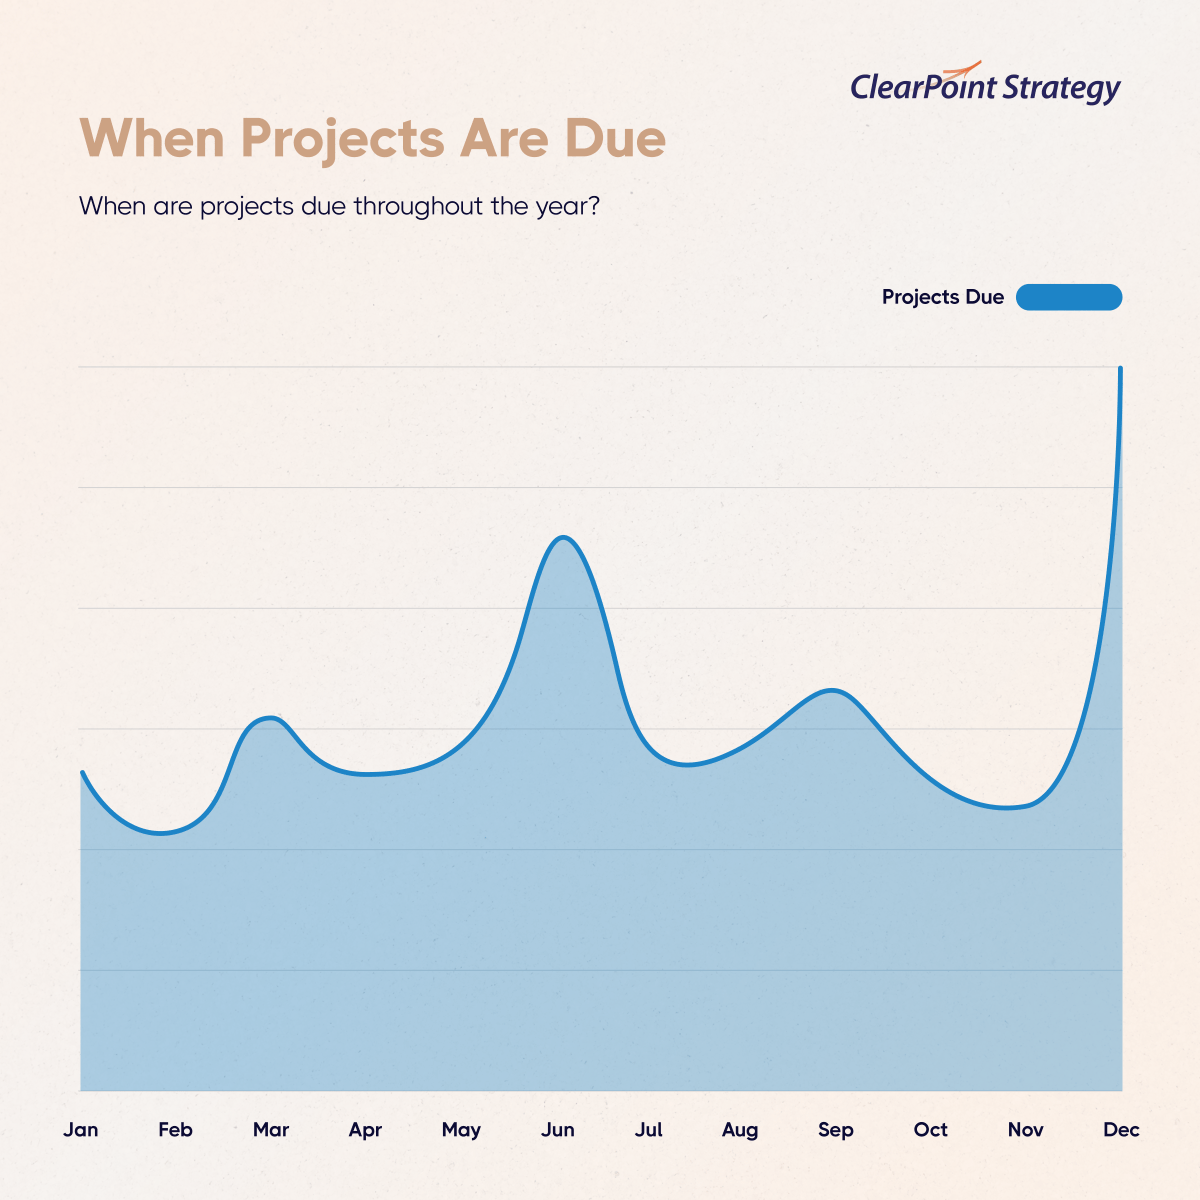
When Projects Are Due: area chart of project due dates by month, January to December
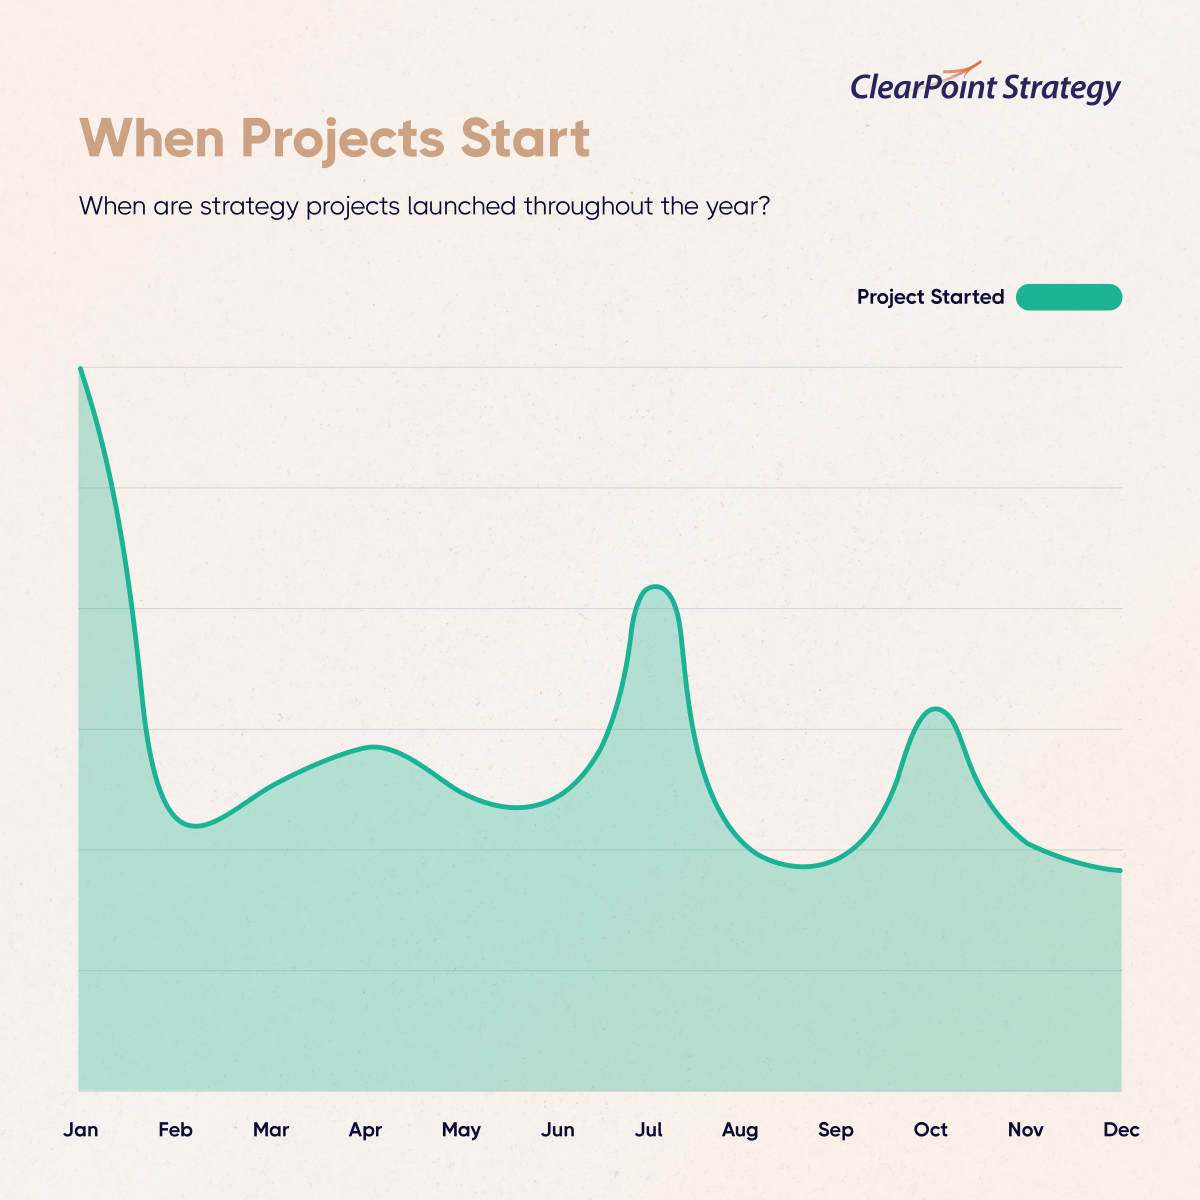
When Projects Start: area chart of when strategy projects launch, by month across the year
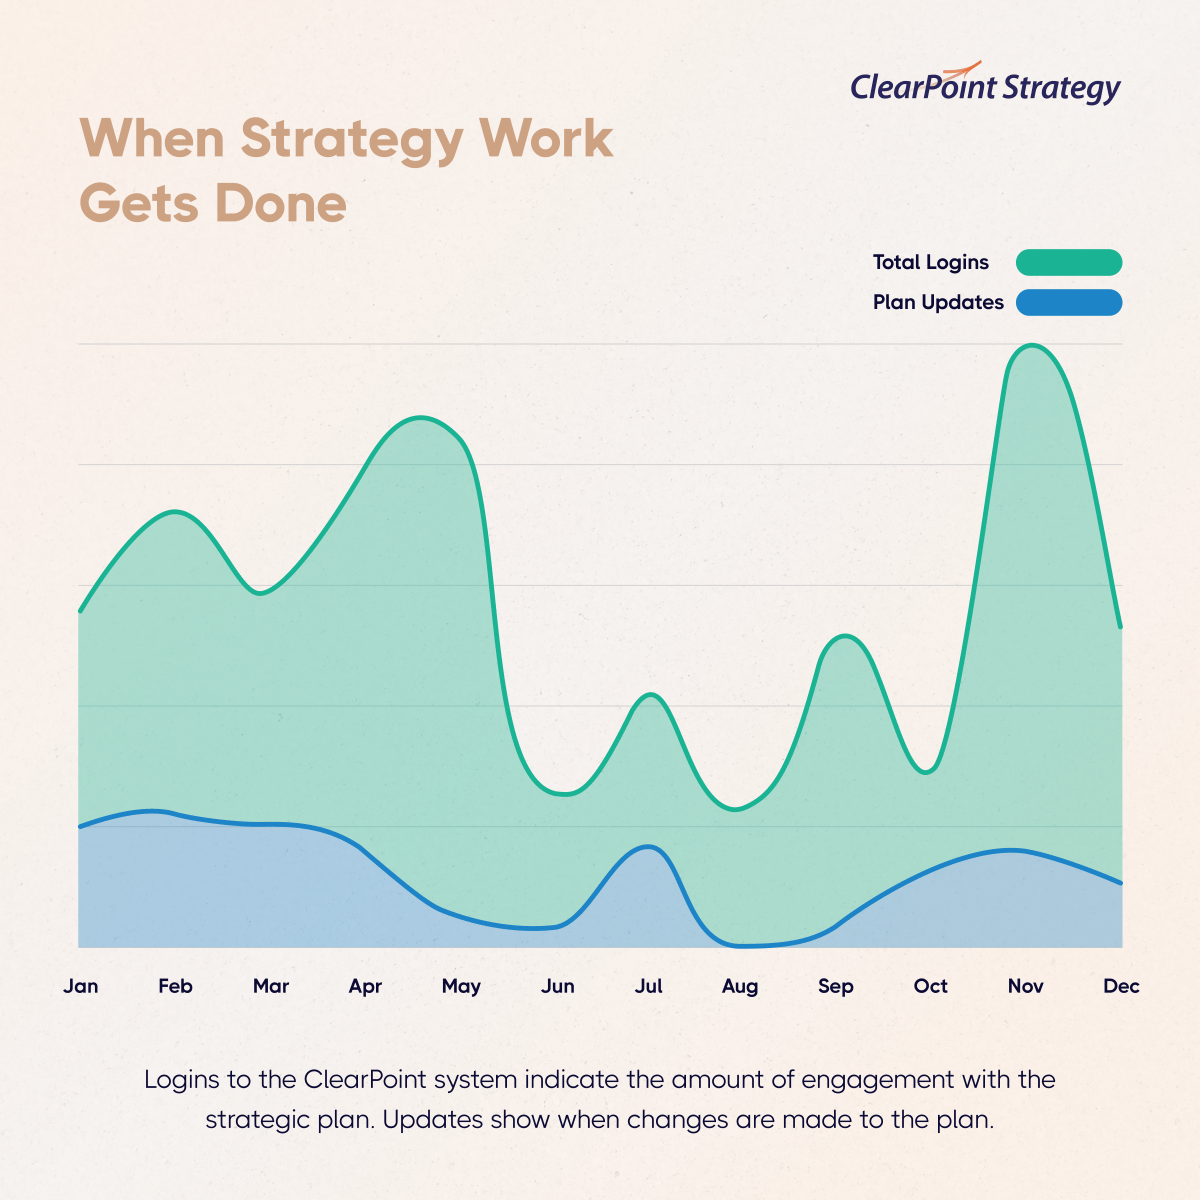
When Strategy Work Gets Done: monthly ClearPoint logins and plan updates across the year

Press Releases

ClearPoint Releases First-Ever Strategic Planning Report: Over 20,000 Plans Analyzed

Media Contact 

For interviews, partnership ideas, or speaking opportunities, contact Alexandre Teulade, Growth Marketing Lead,
at ateulade@clearpointstrategy.com.

SOC 2 Type 2 CertifiedClearPoint Strategy ranked in the Top 10 project management tools by Cubbie.com5-Star Capterra RatingSilver Stevie Award WinnerELGL Haverford Award WinnerG2 Top 50 Project Management SoftwareTX-RAMP Certified badge for ClearPoint Strategy