Enhance your business performance with these 15 crucial non-financial metrics every manager should track. Contact us for more information!
- Track non-financial measures beside financial ones. Financial KPIs lag; a marketing miss this quarter shows up as slow sales next quarter.
- Measure your mission with the metric that reflects it. If the mission is the best customer service, track customer satisfaction scores, not revenue.
- Use non-financial KPIs to trace swings in the bottom line. A spike in recruiting spend can trace back to high turnover and the cost of hiring.
- Choose measures across customer, internal process and learning and growth perspectives. Keep only those that fit your strategy; there are hundreds to choose from.
- Check each measure with the free Measure and Goal Evaluation Toolkit. Confirm it is specific, measurable and ladders up to a strategic objective.
Almost everyone has seen a company balance sheet or been part of an annual review that gives updates on the organization’s financial health. But not as many people are familiar with how success is determined without focusing on finances.
In this article, we’ll explain the basics and show specific examples of non-financial performance measures.
What Are Non-financial Performance Measures?
The easiest way to define non-financial performance measures is to explain what they aren’t. Non-financial KPIs are not expressed as monetary values—in other words, they aren’t directly associated with dollar signs. They focus on other aspects of the business and are often leading (forward-looking) measures, whereas financial KPIs are lagging measures.
While it’s true that non-financial KPIs aren’t associated with finances, that doesn’t mean they can’t be numeric. These types of measures can be either quantitative or qualitative. Many organizations view employees’ “soft skills” as the biggest contributors to non-financial performance, which can be measured in various ways.
Why Are Non-financial Performance Measures Important?
There are two primary reasons non-financial KPIs are important. First, they help explain and provide context for financial KPIs. As we previously mentioned, financial measures are typically lagging indicators, which are fairly easy to collect and analyze because they are backward-looking. Lagging measures report what has already happened, such as revenue generated or orders fulfilled for a specific time period.
But finances don’t always provide the full story. Why did sales revenue drastically drop in May? Why did the operating cash flow jump in Q2? Non-financial performance measures can fill in the gaps and give answers on monetary fluctuations. For example, if marketing efforts missed the mark one quarter, you can expect sales to be slow the next quarter.
Secondly, non-financial KPIs are easier to link to certain aspects of your overall strategy. More specifically, most organizations don’t have finance-based mission and vision statements. If your mission is to provide the best customer service in the industry, revenue numbers aren’t a good way to track that—but something like customer satisfaction scores are.
Get the Measure & Goal Evaluation Toolkit
Why Should Companies Track Non-financial Performance Measures?
There’s no doubt that tracking financial KPIs is critical and (arguably) the top priority for some organizations, but that doesn’t mean you should overlook other KPIs to keep things simple when managing performance. Companies need to track non-financial performance measures because they:
- Help capture strengths and weaknesses. If you excel at customer service but have long wait times before a customer reaches a representative, that will show up in a non-financial KPI such as a feedback survey. These measures can reveal your core competencies and highlight other areas you didn’t realize were suffering.
- Affect business performance. Over- or underperformance is eventually going to show up in your bottom line, and you can trace it back to the source with non-financial performance measures. For example, if the HR recruiting budget skyrocketed, you can see it’s because of the high employee turnover rate and exorbitant cost (in time and resources) of hiring.
- Give employees better feedback on how to meet strategic objectives. When properly constructed, non-financial KPIs are specific, measurable, and ladder up to the organization’s big-picture strategy. Team members are able to see exactly what they need to do to hit their goals and they also understand why they need to pull the same report every month or how their attendance rates lead to productivity. There’s a clear connection between daily tasks and strategic direction.
- Are better at adjusting for external factors. Every business faces external risks outside its control that can negatively impact measures like revenue and expenses. Recessions, war, and Acts of God are unavoidable and unpredictable. If you were just looking at financial KPIs in these situations, it would seem your company’s performance was beyond hope. But non-financial performance measures are largely within your control and can provide a different, more holistic perspective. If you’re getting high marks for company culture and customer satisfaction during one of these disruptions, you’re being successful in key parts of your strategy, and that should pay off in the long term.
15 Examples Of Non-Financial Performance Measures
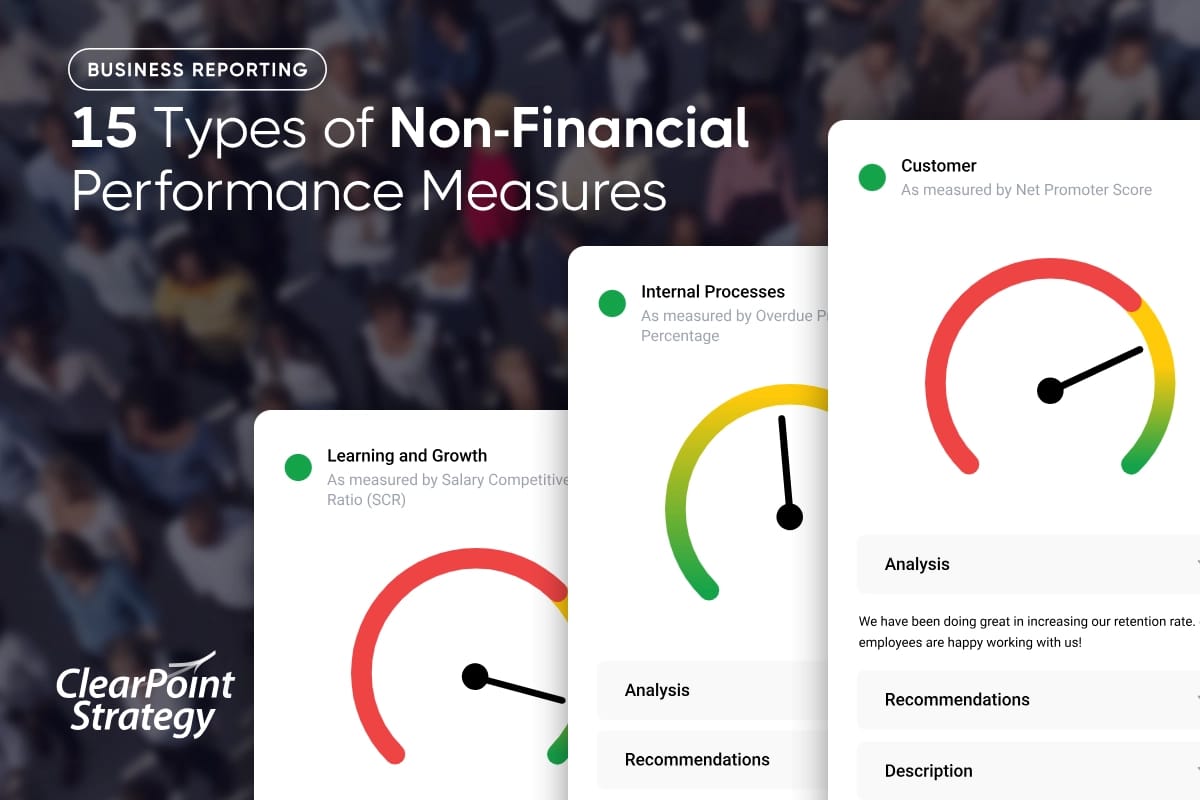
Taking the Balanced Scorecard approach, there are four perspectives involved in strategy management: customer, internal processes (operations), learning and growth (HR), and financial. Below are 15 examples of performance KPIs, organized by the three non-financial perspectives:
Customer
Conversion Rate
LeadingBetter when higherThe percentage of interactions that result in a sale.
- Formula
(Interactions with Completed Transactions) / (Total Sales Interactions) = (Conversion Rate)- Example
- 4,000 ÷ 160,000 = 2.5%.
- What good looks like
- e-commerce conversion typically runs 2–3%; well-optimized stores clear 4%+
- Weak → strong
- "Sell more online" → "Raise site conversion from 2.5% to 3.1% by Q3, owned by the ecommerce lead via checkout redesign".
Retention Rate
LaggingBetter when higherThe portion of consumers who remain customers for an entire reporting period.
- Formula
((Number of Customers at the Start of a Period) - (Customers Lost in a Given Period)) / (Number of Customers at the Start of a Period) = (Customer Retention Rate)- Example
- (1,050 − 100) ÷ 1,000 = 95%.
- What good looks like
- there is no universal number — retention varies sharply by industry and contract model, so benchmark against sector peers and track it by customer segment
- Weak → strong
- "Keep more customers" → "Lift customer retention from 95% to 96% this fiscal year, owned by the Head of Customer Success via an at-risk account program".
Contact Volume By Channel
LaggingThe number of support requests by phone and email.
- Formula
(Contacts in a channel ÷ total contacts) × 100.- Example
- 3,000 email ÷ 10,000 contacts = 30%.
- What good looks like
- there is no universal number — the right mix follows what customers prefer and what each channel costs, so watch month-to-month shifts and staff each channel to match
- Weak → strong
- "Move contacts to the right channels" → "Shift email from 30% to 40% of monthly contacts by Q4 while holding satisfaction steady, owned by the support operations manager".
This allows the organization to not only compare which method customers prefer, but also to track the number of support requests month-to-month.
Show all 5 Customer KPIs
Customer Satisfaction Index
LaggingBetter when higherGauge of a company’s success at meeting customers’ needs.
- Formula
(Satisfied responses ÷ total responses) × 100.- Example
- 880 satisfied ÷ 1,000 = 88%.
- What good looks like
- 75–85% satisfied is a common 'good' band, but the trend and the reasons behind your detractors matter more than the absolute score
- Weak → strong
- "Keep customers happy" → "Maintain a 90%+ CSAT on post-resolution surveys, owned by the support manager, reviewed monthly".
Net Promoter Score
LaggingBetter when higherThe likelihood that customers will recommend a brand to others.
- Formula
(% of Respondents Who Are Promoters) - (% Who Are Detractors) = (Net Promoter Score)- Example
- 60% promoters − 15% detractors = +45.
- What good looks like
- any positive score means more promoters than detractors; across 150,000+ organizations the 2025 median is +44 and the top quartile is +72 or higher, though norms vary widely by industry
- Weak → strong
- "Grow loyalty" → "Raise relationship NPS from +45 to +55 by year-end, owned by the VP of Customer Experience".
Customers rate how likely they are to recommend you on a scale up to 10; promoters usually answer 9-10 and detractors under 6.
Internal Processes
6. Customer Support Tickets
The number of new tickets, the number of resolved tickets, and resolution time.7. Product Defect Percentage
LaggingBetter when lowerThis will give you the percentage of defective products in a specified timeframe.
- Formula
(Number of Defective Units in a Given Period) / (Total Number of Units Produced in a Given Period) = (Product Defect Percentage)- Example
- 15 defects ÷ 1,000 units = 1.5%.
- What good looks like
- lower is better — there is no universal number across industries, so cut it against your own baseline and attack the few defect types that cause most of the failures
- Weak → strong
- "Reduce defects" → "Cut the defect rate from 1.5% to 1.0% within two quarters, owned by the quality manager via root-cause fixes on the top three defect types".
8. On-Time Rate
LaggingBetter when higherThe percentage of time products were delivered promptly as scheduled.
- Formula
(Number of On-Time Units in a Given Period) / (Total Number of Units Shipped in a Given Period) = (On-Time Rate)- Example
- 950 on-time ÷ 1,000 = 95%.
- What good looks like
- leading supply chains target 95%+ on-time-in-full; slipping below ~90% starts to erode customer trust
- Weak → strong
- "Ship orders on time" → "Hit 98% on-time delivery against promised dates, owned by the fulfillment lead, reviewed weekly".
Show all 5 Internal Processes KPIs
9. Efficiency Measure
Efficiency can be measured differently in every industry, so this common KPI will vary.
For example, the manufacturing industry can measure efficiency by analyzing how many units are produced every hour and the plant’s uptime percentage.
10. Overdue Project Percentage
LaggingBetter when lowerThe number of projects that are late or behind schedule.
- Formula
(Number of Overdue Projects in a Given Period) / (Total Number of Projects in a Given Period) = (Overdue Project Percentage)- Example
- 6 ÷ 40 = 15%.
- What good looks like
- lower is better; in PMI's 2017 survey, top-performing organizations finished an average of 88% of projects on time, while underperformers managed only 24%
- Weak → strong
- "Have fewer late projects" → "Cut overdue projects from 15% to under 10% of the portfolio by year-end, owned by the PMO director, reviewed monthly".
This can be pulled from your project status dashboard.
Learning & Growth
Salary Competitiveness Ratio (SCR)
LeadingThe competitiveness of compensation options.
- Formula
(Average Company Salary) / (Average Salary Offered from Competitors (or Average Salary Offered by Industry)) = (SCR).- Example
- $76,000 ÷ $80,000 = 0.95.
- What good looks like
- a ratio of 1.0 means you pay at market and below 1.0 makes hiring and retention harder; set the target by role family against your chosen market position rather than one company-wide number
- Weak → strong
- "Pay competitively" → "Raise the salary competitiveness ratio from 0.95 to 1.0 for hard-to-fill roles within two budget cycles, owned by the Compensation Manager".
Employee Productivity Rate
LaggingBetter when higherWorkforce efficiency measured over time.
- Formula
(Total Company Revenue) / (Total Number of Employees) = (Employee Productivity Rate).- Example
- $40,000,000 ÷ 200 employees = $200,000.
- What good looks like
- there is no universal number — it swings widely by industry and business model, so compare it with direct peers and your own trend, and watch it alongside margin and service quality
- Weak → strong
- "Be more productive" → "Grow revenue per employee from $200,000 to $220,000 by next fiscal year, owned by the COO via process automation".
Turnover Rate For Highest Performers
LaggingBetter when lowerThe success of retention efforts for top performers and plans for talent replacement.
- Formula
(Number of High Performers Who Departed in Past Year) / (Total High Performers Identified) = (High Performer Turnover Rate).- Example
- 4 ÷ 50 = 8%.
- What good looks like
- there is no universal number — lower is better, and it should sit well below your overall turnover rate; treat every top-performer exit as a signal worth reviewing
- Weak → strong
- "Keep our best people" → "Cut top-performer turnover from 8% to 5% within the year, owned by HR Business Partners via stay interviews".
Show all 5 Learning & Growth KPIs
Average Time To Hire
LaggingBetter when lowerThe efficiency of the hiring process measured by time to recruit, interview, and hire.
- Formula
Total days from requisition opening to offer acceptance ÷ number of hires.- Example
- 1,560 days ÷ 40 hires = 39 days.
- What good looks like
- SHRM's 2026 benchmarking puts median time-to-fill at 39 calendar days for nonexecutive roles; lower is better, but compare by role family rather than one blended number
- Weak → strong
- "Hire faster" → "Cut average time to hire from 39 to 32 days by Q4, owned by the Talent Acquisition Manager via structured interview scheduling".
Internal Promotion Rate
LeadingThe successful retention and growth of top performers.
- Formula
(Internal moves ÷ total roles filled) × 100.- Example
- 12 internal moves ÷ 40 roles = 30%.
- What good looks like
- employees who made an internal move had a ~75% chance of staying two years versus ~56% for those who did not, so a rising internal-fill share usually pays off in retention
- Weak → strong
- "Promote from within" → "Fill 35% of open roles internally, up from 30%, by year-end, owned by the Talent Acquisition Manager via posting every role internally first".
(The Number of Promoted Individuals) / (Total Number of Employees) = (Internal Promotion Rate).
Remember to track the non-financial measures that best fit your organization’s needs. There are hundreds of KPIs to choose from—focus on the ones that make the most sense for your strategy.
Measure Success Beyond Numbers with ClearPoint Strategy Software
Are you ready to unlock the full potential of your organization by focusing on non-financial performance measures?
ClearPoint Strategy offers the tools you need to track, analyze, and optimize these critical metrics, ensuring a holistic approach to performance management. Our software enables you to monitor key indicators such as customer satisfaction, employee engagement, and operational efficiency, providing valuable insights for informed decision-making.
Book a personalized demo with ClearPoint Strategy today and start measuring what truly matters.
Common questions
What are the different types of non-financial performance measures?
Different types of non-financial performance measures include:
- Customer Satisfaction: Metrics like Net Promoter Score (NPS) and customer satisfaction surveys.
- Employee Engagement: Measures such as employee satisfaction surveys, turnover rates, and retention rates.
- Quality Metrics: Indicators like defect rates, product returns, and quality control assessments.
- Operational Efficiency: Metrics such as cycle time, process improvements, and productivity ratios.
- Innovation: Measures including the number of new products developed, patents filed, and R&D spending.
- Sustainability and Social Responsibility: Metrics like carbon footprint, energy usage, and community impact initiatives.
How do you measure non-financial performance?
To measure non-financial performance:
- Define Objectives: Clearly outline the goals and objectives related to non-financial aspects.
- Select Relevant Metrics: Choose appropriate metrics that align with your objectives.
- Collect Data: Use surveys, feedback forms, audits, and observation to gather relevant data.
- Analyze Data: Evaluate the data to identify trends, strengths, and areas for improvement.
- Benchmark: Compare your performance against industry standards or competitors.
- Report and Review: Regularly report findings to stakeholders and review them to inform strategic decisions.
What are some examples of non-financial performance measures?
Examples of non-financial performance measures include:
- Customer Loyalty: Net Promoter Score (NPS) and repeat customer rates.
- Employee Morale: Employee satisfaction survey results and turnover rates.
- Product Quality: Defect rates and the number of customer complaints.
- Innovation: Number of new products launched and R&D expenditure.
- Operational Efficiency: Process cycle time and productivity improvements.
- Environmental Impact: Carbon footprint and energy consumption levels.
What are the benefits of using non-financial performance measures?
The benefits of using non-financial performance measures include:
- Holistic View: Provides a comprehensive view of organizational performance beyond financial metrics.
- Employee Engagement: Helps in understanding and improving employee satisfaction and retention.
- Customer Focus: Enhances focus on customer satisfaction and loyalty, leading to long-term success.
- Innovation and Improvement: Encourages innovation and continuous improvement in products and processes.
- Sustainability: Supports sustainability goals and corporate social responsibility initiatives.
- Strategic Alignment: Ensures that all aspects of the organization are aligned with strategic objectives.
How can non-financial performance measures be used to improve organizational performance?
Non-financial performance measures can be used to improve organizational performance by:
- Identifying Strengths and Weaknesses: Highlighting areas that need improvement and those that are performing well.
- Informing Decision-Making: Providing data-driven insights to support strategic decisions.
- Enhancing Customer Satisfaction: Focusing on customer feedback to improve products and services.
- Boosting Employee Engagement: Using employee feedback to create a better work environment and increase productivity.
- Driving Innovation: Measuring and encouraging innovative activities to stay competitive.