Lagging and leading indicators can help your business tremendously.
- Set the lagging indicator for each goal first. Profits, revenue or renewals show whether you hit the goal, but not what will happen next.
- Ask which process or input moves that result, and measure it. For customer renewals, track midyear check-in completion or conference attendance.
- Test candidate leading indicators against historical data. Keep the metrics that change before the outcome does.
- Skip leading indicators when you enter an unfamiliar market. They tell people what to do, which stifles the experimentation innovation needs.
- Review leading and lagging indicators together on a regular basis. Start from these KPI examples to pair drivers with outcomes.
As a business person, you’re constantly trying to figure out how to accomplish your organization’s goals. To do this, you need “key indicators” (also referred to as “measures”, “metrics”, "lead measures", "leading indicators", or “KPIs”). They tell you whether or not you’re accomplishing your goals and whether you’re on the right track to accomplish future goals.
There are two different types of indicators: leading and lagging. In general, leading indicators can be thought of as drivers, and lagging indicators can be thought of as outcomes. But, of course, that’s an oversimplified definition. So within this article, we’ll do an in-depth exploration of what both leading and lagging indicators are and why leading indicators are so vital for your business.
Lagging Indicators
To understand leading indicators, you need to first understand lagging indicators. Lagging indicators offer the most concrete way to understand if you’ve accomplished your goals or not. You can come up with solid lagging indicators that tell you what happened for that goal over the last quarter or the last year by examining your outputs and outcomes. Lagging indicators aren’t predictors of what is going to happen, but they’re great at telling you what did happen. When you create lagging indicators, you need to consider what a good predictor for your goals might be. What are the processes or inputs that lead to that result? These are important elements to understand.
Here are a few examples of lagging indicators:
Profits
LaggingBetter when higherThe amount of money an organization makes after taking out all expenses and other costs.
- Formula
Income − expenses- Example
- $2,500,000 − $2,200,000 = $300,000.
- What good looks like
- U.S. public companies keep ~10% of revenue as net profit on average, but it is highly sector-dependent, so compare your margin with peers and your own trend
- Weak → strong
- "Make more profit" → "Increase net profit from $300,000 to $350,000 this fiscal year through pricing and cost reviews, owned by the CFO."
Revenue
LaggingBetter when higherThe total income an organization receives.
- Formula
Price of goods × number of goods sold.- Example
- $50 × 20,000 = $1,000,000.
- What good looks like
- there is no universal number — judge it against plan, prior periods, and market growth, and read it alongside margin so growth stays profitable
- Weak → strong
- "Grow the business" → "Grow annual revenue from $1,000,000 to $1,200,000 by fiscal year-end, owned by the Chief Revenue Officer".
Expenses
LaggingBetter when lowerThe total costs an organization incurs during a reporting period, including marketing, sales, and operations costs.
- Formula
Cost of goods sold + operating expenses + other expenses.- Example
- $5,000,000 + $3,200,000 + $300,000 = $8,500,000.
- What good looks like
- there is no universal number — judge expenses against revenue and output, since spending that grows slower than revenue is the real goal
- Weak → strong
- "Spend less" → "Hold total expenses at $8,500,000 this fiscal year while revenue grows 5%, owned by the CFO."
Show all 5 Lagging Indicators
Number of Customers
LaggingAllows companies to track the size of their customer base over time.
- Formula
Customers at start of period + new customers − lost customers.- Example
- 2,000 + 300 − 100 = 2,200 customers.
- What good looks like
- there is no universal number — the healthy signal is steady net growth, with new customers outpacing lost customers period after period
- Weak → strong
- "Grow our customer base" → "Grow active customers from 2,200 to 2,500 by year-end, owned by the Chief Revenue Officer via new acquisition and churn reduction".
Percent Renewal
LaggingBetter when higherA good indicator of whether clients find a service useful. If this rate is low, companies may need to determine why clients are not renewing.
- Formula
Clients who renew ÷ total clients whose previous licenses came to an end.- Example
- 860 ÷ 1,000 = 86%.
- What good looks like
- as a revenue-based reference point, bootstrapped B2B SaaS companies with $3M–$20M ARR report median gross revenue retention of 91%, with the top 10% at 100%
- Weak → strong
- "Get more clients to renew" → "Lift renewal rate from 86% to 90% this fiscal year, owned by the renewals manager".
Leading Indicators
A leading indicator is any measure or observable variable that corresponds with a future change in another variable of interest. Leading indicators are valuable as they provide insight into likely future outcomes giving organizations the ability to act accordingly in the present.
I mentioned that indicators tell you how you’re progressing toward a goal. A leading indicator (or driver) forces you to ask yourself, “What process or variables will make me achieve this goal better or faster? What do I need to do well in order to improve my outcome measure or my goal?”
Once you understand your lag indicators (which help you understand if you’ve met your goal), you move to the predictors, which allow you to look forward: your leading indicators. Lead indicators ask, “What are the best things we can do to help us get to our future goals and targets?”
Leading indicators are different based on the goal. For a goal of “improve customer renewals”, some leading indicators might be as follows:
Percent of customers that complete the midyear check in process
LeadingBetter when higherThe share of active customers who complete a scheduled midyear review of goals, usage, and outcomes with their account team.
- Formula
(Customers completing the midyear check-in ÷ eligible customers) × 100.- Example
- 340 ÷ 400 = 85%.
- What good looks like
- there is no universal number — aim for nearly every active account to complete it, and treat accounts that skip the check-in as an early renewal-risk flag
- Weak → strong
- "Do more check-ins" → "Raise midyear check-in completion from 85% to 95% of active accounts by July 31, owned by the customer success manager".
Number of customers that attend the annual conference (or webinar, or other activity)
LeadingNumber of customers that attend the annual conference (or webinar, or other activity).
- Formula
Count of unique customer accounts attending the event.- Example
- 180 customer accounts attending = 180.
- What good looks like
- there is no universal number — compare attendance with your active customer base and the prior year, and watch whether attending accounts renew and expand more than non-attendees
- Weak → strong
- "Get more customers to the conference" → "Grow annual conference attendance from 180 to 225 customer accounts next year, owned by the customer marketing manager".
Number of products a customer purchases
LaggingThe average number of distinct products each active customer buys.
- Formula
Total distinct products bought across customers ÷ number of active customers.- Example
- 3,600 ÷ 2,000 = 1.8 products.
- What good looks like
- there is no universal number — it depends on how broad your product line is, so grow it against your own baseline and watch that added products stay profitable
- Weak → strong
- "Sell customers more of our products" → "Raise products per customer from 1.8 to 2.1 within one year, owned by the account management lead via bundled offers".
For a goal of “increase customer purchases”, a lagging indicator might be the number of products purchased, but the leading indicators might be the number of product bundles for sale or the number of discounts of products or the number of products recommended based on previous purchases. Depending on your business, it could be the number of seasonal products or seasonal sales that occur. All could drive customer purchases.
Example: Employee Satisfaction
There are two important lagging indicators for employee satisfaction: what employees will tell you when they fill out a survey (i.e. what they say) and what they actually do. The best correlation for what they actually do is absenteeism. If they miss work frequently, that can mean they’re not very satisfied with work. If they say they aren’t very satisfied and they’re absent a lot, you can look at tried and true inputs and processes for employee satisfaction.
The inputs you might look at could include:
- Do you have the right people working for you? (Do you have the right skill sets for the job?)
- Are your managers good? (Can you tell through 360 evaluations?)
- Do you have a nice work environment? (Are there complaints about the kitchen, bathrooms, chairs, working hours, or culture?)
The processes you might look at could include:
- Do you have a good performance management process? (i.e. Annual review process)
- Do you give appropriate raises and bonuses?
- Do people have flexibility to choose their projects or job mobility within the organization?
You can come up with indicators that would tell you these things and help you improve your future employee satisfaction.
When You Should Use Leading Indicators (& When You Shouldn’t)
If you have a high degree of confidence of what you need to do in order to achieve your goal, you can likely benefit from leading indicators.
For example, if you run the Department of Motor Vehicles (DMV), you know that citizens must renew their driver's licenses on a fixed schedule. Thus, you have a good idea of how many people you can expect on a yearly, weekly, and daily schedule. You know you need to be able to manage the length of the lines, update information accurately, remind people to come in with appropriate documentation, and more. In other words, you know exactly what the leading indicators are.
But let’s say you’re trying to introduce your product to a market where you have never operated. You are unfamiliar with the business climate and purchasing culture for your products. Therefore, you have no idea what the indicators should be. And you really shouldn’t be concerned with them, because lead indicators may stifle innovation. They’re great at telling you what you should be doing; but if you’re being innovative, you want people to experiment and try new things, so leading indicators would do more harm than good. Of course, there are always exceptions to every rule. A pharmaceutical company may have their research and innovation process down pat, and thus may be able to benefit from using some lead indicators. But as a general rule of thumb, steer clear of them if you want to give people the freedom to experiment and determine what works in a changing environment. It may be the best way to achieve real stretch goals.
In Conclusion
If you only looked at your lagging indicators it would be really hard to drive your performance forward. You might find yourself stagnating or being blindsided by the future.
If you look at your lagging and leading indicators, and question them regularly, you can begin to drive better than average performance. And you can start to predict whether you’re going to meet the end-of-year (or five-year) targets. Outside of stifling some innovation when you’re launching something new, they can be extraordinarily helpful for the future of your business.
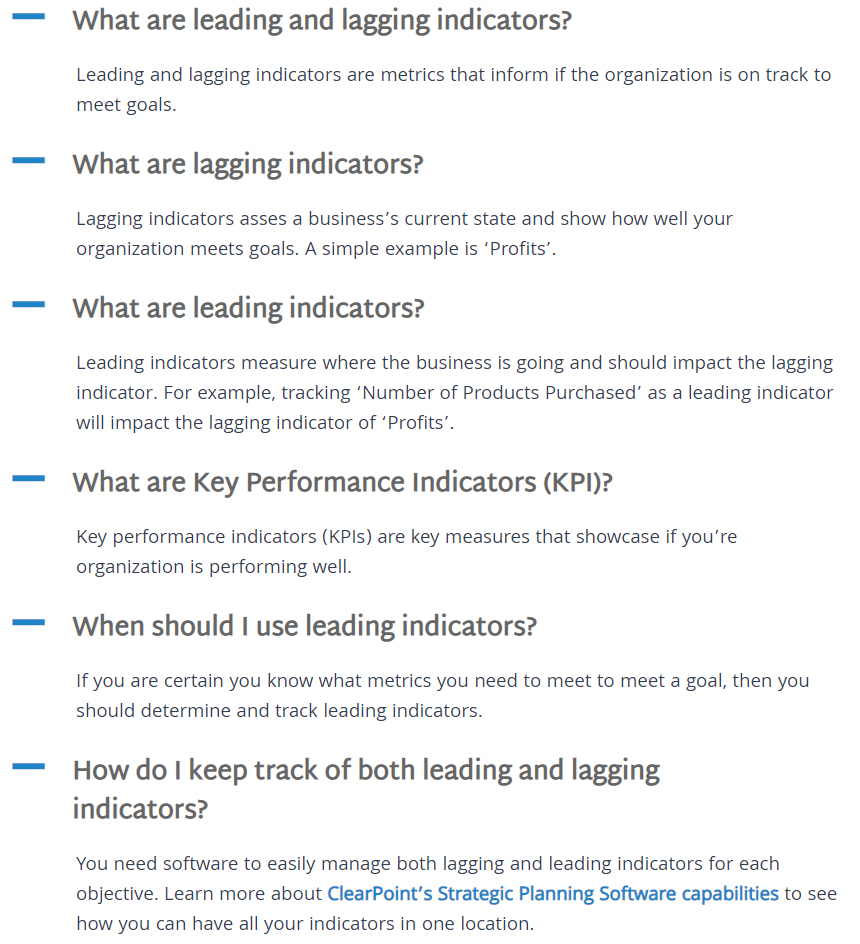
Common questions
How do you identify leading indicators?
- Define Goals and Objectives: Identify what you want to achieve or improve.
- Review Historical Data: Look for correlations between past performance and outcomes.
- Analyze Metrics: Identify metrics that change before the desired outcome.
- Consult Experts: Seek input from subject matter experts or stakeholders.
- Test Hypotheses: Formulate and test hypotheses to validate leading indicators.
Why are leading indicators important?
- Early Warning: They provide early signals of potential future performance or outcomes.
- Actionable Insights: Enable proactive decision-making to influence future results.
- Performance Tracking: Help track progress towards goals before final outcomes are realized.
- Strategic Alignment: Align efforts with strategic objectives and focus resources effectively.
What are the leading indicators of the economy?
Leading economic indicators include:
- Stock Market Trends
- Consumer Confidence Index
- Building Permits
- Unemployment Claims
- Manufacturing Activity
These indicators often change before the economy as a whole starts to follow a certain trend.
How do leading indicators work in project management?
In project management, leading indicators:
- Predict Outcomes: They forecast project success or failure based on early data.
- Guide Decision-Making: Help project managers adjust strategies or allocate resources proactively.
- Monitor Progress: Provide continuous feedback on project health and performance.
How does benchmarking help a business?
Benchmarking helps businesses by:
- Identifying Best Practices: Learn from industry leaders and competitors.
- Setting Goals: Establish realistic performance targets based on industry standards.
- Improving Processes: Drive continuous improvement and efficiency.
- Measuring Performance: Evaluate and compare performance against industry benchmarks.