
Collecting this data turned up a virtual treasure trove of insights—all of which you can use to get ahead.
I've been in the strategic planning software business long enough to have seen a lot of plans. Good ones, bad ones, and everything in between. But until recently, I never had a way to separate what actually works from what just sounds good in a boardroom. That changed when we compiled eight years’ worth of anonymized data from ClearPoint accounts — 31.2 million rows covering:
👉20,582 strategic plans
👉117,547 goals
👉317,809 measures
👉130,324 projects
It's the kind of dataset that lets you see patterns that would be invisible from the vantage point of any single organization. What emerged wasn't what I expected. Some conventional wisdom held up. Some didn't. And a few insights were genuinely surprising, the kind that make you rethink assumptions you've held for years. Here are the five biggest takeaways that actually matter for how you build and execute your strategic plan.
Takeaway #1: Your Plan Is Probably Too Big
Let's start with portfolio size, because this is where most organizations set themselves up for failure before they even begin.
The median strategic plan contains:
- 5 goals
- 9 measures
- 8 projects
- 17 milestones
That's about 39 total elements. Seems reasonable, right?
But here's what the data actually shows:
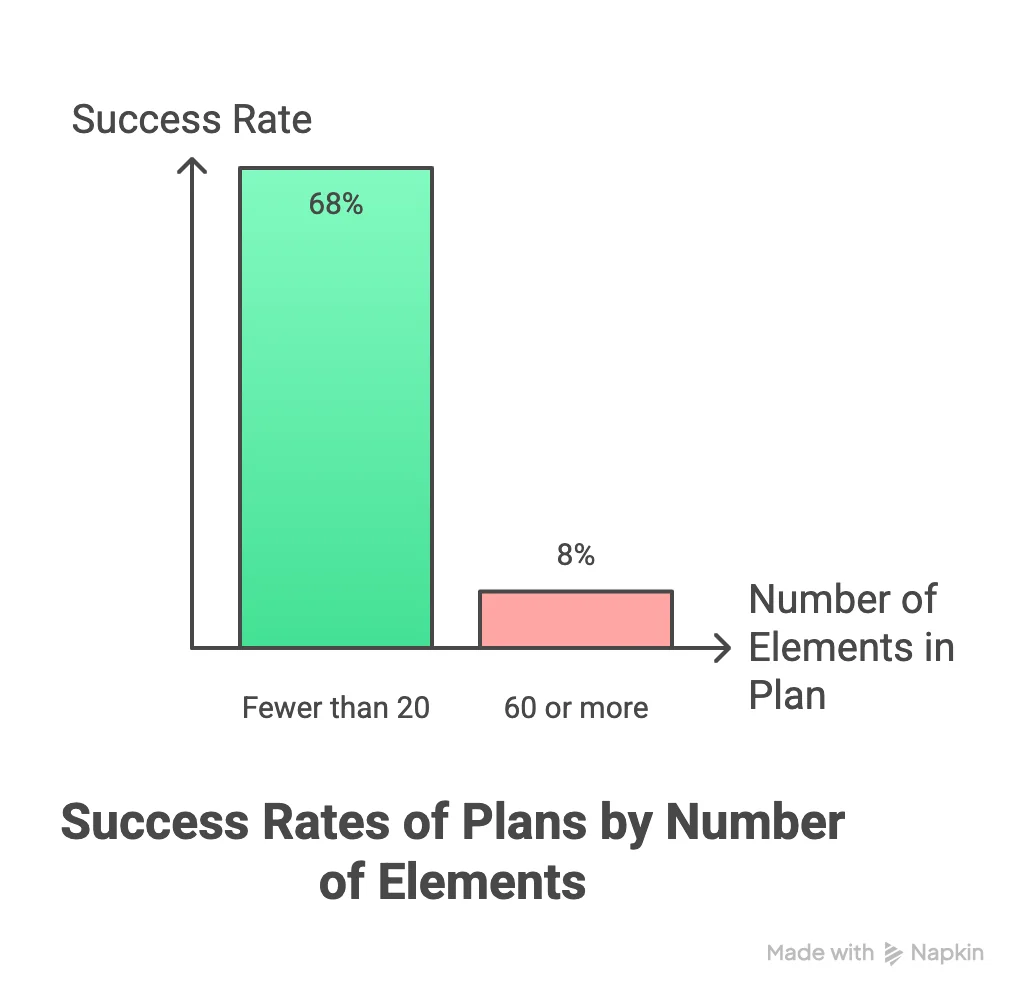
- Plans with fewer than 20 total elements succeed 68% of the time.
- Plans with 60 or more elements succeed just 8% of the time.
Think about that ratio. You're not sacrificing a little bit of success for comprehensiveness. You're destroying your chances of execution.
And it gets worse:
From 2017 to 2024, the number of active projects per plan increased 60% by median (from 5 to 8) and 48.8% by average (12.52 to 18.63). Milestones nearly doubled on average, climbing to 56 per plan.
Organizations aren't getting better at execution; they're drowning themselves in complexity.
I get it. When you're in the planning process, everything feels important. Every department has legitimate priorities. Every stakeholder wants their initiatives included. The pressure is to add, not subtract.
👉Case in point: Durham, North Carolina
Government leaders of Durham, North Carolina learned this lesson the hard way. When they first implemented strategic planning software in 2011 with over 500 performance measures to track, they quickly discovered that comprehensiveness doesn't equal effectiveness. Within a year, most staff had reverted to Excel because the system was too complex to manage.
Their breakthrough came in 2014. Instead of asking "What should we track?" they asked "What can we actually execute?" They rebuilt their entire performance management structure around focused, manageable portfolios with clear ownership at every level.The result? Over 100 actively engaged employees, $1.8 million in budget savings from eliminating non-strategic spending, and a triple-A bond rating maintained through ecnomic challenges.
The uncomfortable truth: If you want to execute your strategy, you need to ruthlessly prioritize. Not everything can be strategic. Not everything deserves to be tracked. The organizations that finish what they start are the ones that start with less.
Takeaway #2: Goals Are Shrinking While Projects Are Growing (And That's A Good Thing)

Here's a pattern that caught my attention: From 2017 to 2024, the median number of goals dropped slightly from six to five. Meanwhile, projects increased from five to eight, and milestones climbed from 15 to 17.
At first glance, this looks like organizations are just shuffling deck chairs — fewer goals, more projects, what's the difference?
But when you dig into the successful organizations, you see something deliberate happening. They're narrowing their focus at the top while expanding execution capacity below. They're doing more of what matters, not just doing more.
"Goals are shrinking while projects are growing — and that contrast says everything. The best strategy leaders are narrowing their focus at the top while expanding execution capacity below. It's not about doing more. It's about doing more of what matters."
—Ted Jackson, Co-founder of ClearPoint
👉Case in point: Fort Lauderdale, FL
Fort Lauderdale, Florida exemplifies this shift. When they launched "Press Play Fort Lauderdale" in 2013, they started with 12 goals, 38 objectives, 191 initiatives, and 142 key performance indicators. It was comprehensive, community-driven, and completely overwhelming. Their management system involved cross-departmental meetings with over 100 staff every two months. The meetings covered topics that weren't relevant to most attendees. People felt busy but not productive. Frustration mounted.
The turning point came when Kristin Tigner, their Structural Innovation Manager, embraced a "simplify, excel, and expand" philosophy. Instead of trying to execute everything simultaneously, they narrowed their strategic focus while building deeper execution capability on fewer priorities.
The lesson: Strategic focus isn't about having fewer things to do; it's about having fewer things to think about at the strategic level.
When your leadership team is focused on five clear goals instead of twelve competing priorities, they can direct resources more effectively. When those five goals cascade into eight well-designed projects instead of 191, teams can actually finish what they start.
Takeaway #3: Ownership Is The Execution Crisis Nobody Talks About

The single biggest execution gap in strategic planning has to do with ownership.
Here's what the data revealed:
- 74.3% of goals have no owner assigned.
- 71% of measures lack an owner.
- 68.2% of milestones have no owner.
- 56.8% of projects have no owner.
And it gets worse. When we looked at the owners who are assigned, only 13.8% had actually updated their work in the last 90 days. That means 86.2% of "owners" are what we call "phantom owners" — names on a page with no real accountability.
For every active owner, there are roughly 6.3 inactive ones. This isn't a software problem or a process problem. This is a culture problem masquerading as a planning problem.
Organizations treat ownership as an administrative detail, something you fill in on a spreadsheet to make the plan look complete. But ownership is the fulcrum of execution. Without it, even the most brilliant strategy is just an expensive wish list.
👉Case in point: Carilion Clinic
Carilion Clinic in Virginia figured this out early. When they developed their performance management system starting in 2007, they didn't just assign owners — they made ownership meaningful. They created scorecards for individual physicians, departments, and sections, then linked compensation to patient-centered care outcomes.
Darren Eversole, the Director of Finance, explains the impact: "Everyone is rowing in the same direction, physicians and providers have control of their results as an individual, which contributes to the overall performance of the scorecard. When people actually <em>own</em> their metrics, behavior changes. Carilion was eventually managing around 300 scorecards through ClearPoint. The system worked not because they had sophisticated technology but because they had real accountability at every level.</p>
"Stop naming committees. Name a person. One champion with 3-4 helpers beat crowds every time."
—Robin Champ, VP, LBL Strategies
The fix isn't complicated: Every goal, every measure, every project, every milestone needs one person who's accountable. Not a team. Not a department. A person. And if that person hasn't updated in 90 days, reassign or remove them.
Additionally, put them on page one of your strategic plan where everyone can see them.
Make ownership real, or don't bother planning at all.
Takeaway #4: The Calendar Reveals More Than You Think

When I first looked at the seasonal patterns in our data, I expected to see some clustering around fiscal year boundaries.
What I didn't expect was how dramatically the calendar shapes execution and how predictably organizations follow the same patterns year after year.
- February records the most updates at 2,045,105.
- January launches 1.8 times more projects than all of Q4 combined.
- November records the most logins to ClearPoint. That's when leaders are building next year's strategic plan, aligning goals, and ensuring a smooth transition.
- December sees 29% of project completions; no other month exceeds 10%.
What does this tell us? Organizations have naturally developed a "launch in January, close in December" cadence.
But that cadence creates predictable bottlenecks.
When 29% of your projects are due in December, you're not just creating a busy month — you're guaranteeing that quality suffers, resources get stretched thin, and projects get delayed because everyone is drowning in year-end work.
👉Case in point: JEA
JEA, one of the nation's largest utilities serving 2,200 employees, recognized this problem. To address it, they are deliberate about spreading work throughout the year. Each quarter, they produce comprehensive strategy reports with "more visuals and fewer tables" to tell the story quickly. This regular cadence keeps momentum going year-round instead of creating artificial pressure at year-end.
The elite performers in our dataset do something similar:
They set a guardrail that no single month should contain more than 15% of planned finishes. They pull work forward from December and June into Q2 and Q3, creating mid-quarter finish windows that smooth out the workload.
This isn't about working faster but about working steadier.
When you spread execution across the calendar, you maintain momentum without burning out your team.
The calendar also revealed something about project timelines: During COVID in 2020, median project duration dropped to 163 days — cut nearly in half from 2017's 303 days. Organizations proved they could move fast when they had to.
But by 2023-2024, project timelines had stabilized back at 364 days. Was this a regression? Not exactly. It was more like a recognition: Strategic transformation takes sustained, deliberate effort.
The lesson: Your calendar is telling you something about your execution capacity. If 47% of your projects are finishing in just two months, you don't have an execution problem — you have a scheduling problem.
Fix the calendar, and you'll fix a lot of execution issues you thought were about capability.
Takeaway #5: Industry Matters Less Than You Think
This one surprised me.
When we segmented the data by industry, we saw predictable differences in portfolio size:
- Manufacturing, Non-Profits, and Professional Services set twice as many goals (median of 10) as Governments and Financial Services (5).
- Education tracks the most measures (a median of 16).
- Energy & Utilities show the highest milestone intensity (median of 20).
These differences make sense. A utility managing physical infrastructure needs more milestones than a financial services firm. A nonprofit juggling multiple funding sources needs more goals than a government agency with a clear mandate.
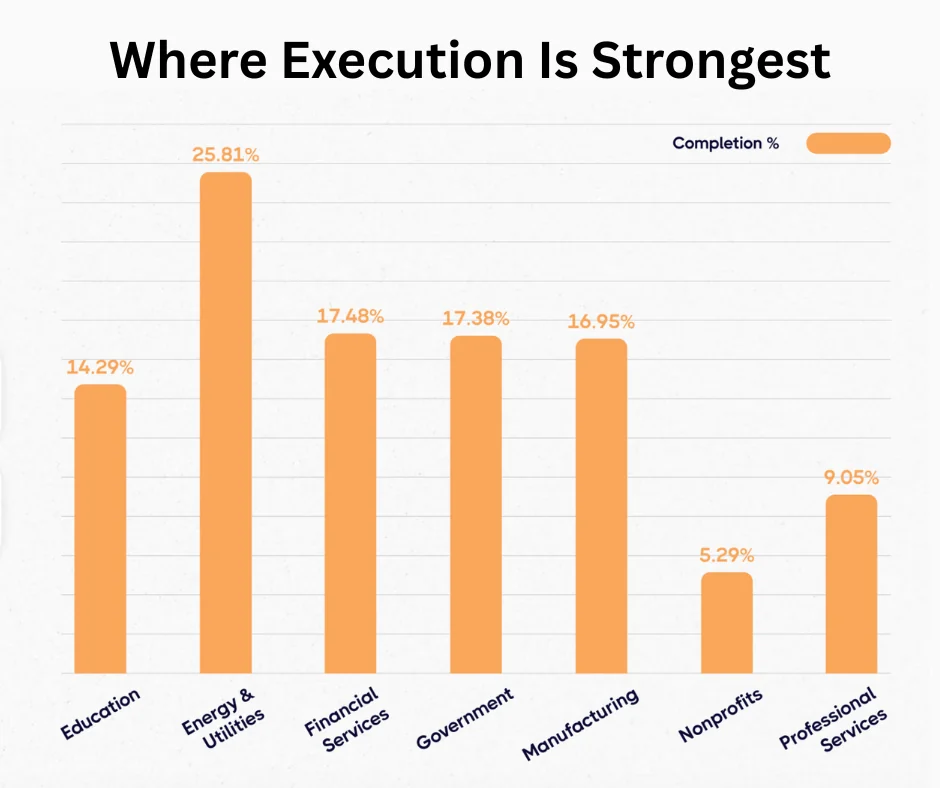
But when we looked at completion rates, which is the metric that actually matters, the spread was narrower than I expected.
Energy & Utilities leads at 25.81% completion. Nonprofits bring up the rear at 5.29%.
That's a 5x difference, which sounds dramatic until you realize that even the best-performing industry is only completing about one-quarter of its strategic projects.
Every industry has the same fundamental challenge: finishing what they start.
The organizations in the top 5.7% — the ones completing 93% of their projects — come from every sector. Durham is in local government. Fort Lauderdale is in local government. Carilion Clinic is in healthcare. JEA is in utilities.
Different industries, different contexts, different constraints. What they share isn't their sector; it's their commitment to execution fundamentals.
👉Case in point: JEA
<p style="padding-left: 30px;">JEA manages an incredibly complex operation as a major utility, but Kendra Cash explains their approach simply:</p>
<p style="padding-left: 30px;">"Our day-to-day metrics live in internal systems, but anything related to our strategy lives in ClearPoint. It keeps things clean and eliminates confusion."</p>
<p style="padding-left: 30px;">They use Power BI for operational data, embed it live into ClearPoint for strategic visibility, and track hundreds of tasks while keeping leadership focused on what matters. The collaborator field lets them break down silos.</p>
<p style="padding-left: 30px;">"Now you can see Technology is working with Customer, and HR has a piece in that same objective."</p>
That visibility and clarity works whether you're managing a utility, running a hospital, or operating a city government.
The uncomfortable truth: if your organization isn't executing well, you can't blame your industry.
Yes, healthcare is complex.
Yes, governments have constraints.
Yes, utilities have regulatory burdens.
But organizations in your industry are executing at elite levels.
The question isn't whether it's possible—the data proves it is. The question is whether you're willing to implement the disciplines that make it possible.
Being in a "challenging" industry isn't an excuse for strategic failure. It's an opportunity to outperform competitors who use industry as an excuse.
What The Data Doesn't Tell You (But You Need To Know Anyway)
After gathering all this data and doing the analysis, I've learned that numbers only tell part of the story.
For example, the data shows that Durham, Fort Lauderdale, and Carilion Clinic all succeeded in their strategic endeavors. What it doesn’t show is:
- The years of refinement and failed first implementations.
- The difficult conversations with leadership about what a data-driven organization should look like.
- The frustration of early meetings.
- The courage of strategy leaders in advocating for focus over comprehensiveness.
- The careful studying of and learning about frameworks like the Balanced Scorecard.
- The incremental expansion of strategy, from leadership scorecards to provider scorecards to department scorecards.
- The work that goes into structuring focus areas and building quarterly reporting processes that executives actually use.
Here's what I've learned: Data can tell you what works, but it can't tell you how hard it is to implement. Every organization in the top 1% of execution faced setbacks. Every one of them had to unlearn old habits. Every one of them had to make uncomfortable changes.
Shari Metcalfe, Durham's Strategy and Performance Manager, captures this perfectly:
"A big turning point for our performance management was getting a system that we could use to manage all that data. It's just easier. Less time putting numbers in a system and more time actually looking at the numbers and making decisions based on them."
That shift—from data entry to data-driven decision-making—sounds simple.
But it required three years of organizational learning, a complete reimagining of their governance structure, and leadership commitment to actually change how the city operated.
The data tells you what to do. Experience tells you that doing it is hard. Both are true.
Data can tell you what works, but it can't tell you how hard it is to implement. Every organization in the top 1% of execution faced setbacks. Every one of them had to unlearn old habits. Every one of them had to make uncomfortable changes.
Start With What You Can Control
If you've read this far, you're probably wondering: What do I actually do with these insights?
Start by auditing your current state against the five takeaways:
1. Rightsize Your Portfolio
- Count your total elements (goals + measures + projects + milestones)
- Calculate where you sit: under 20 (68% success rate), 20–60 (declining success), or over 60 (8% success rate)
- If you're over 40 total elements, start cutting.
2. Narrow Your Strategic Focus & Build Execution Capability
- Count your strategic goals.
- Count your projects.
- Ask: Are we narrowing focus at the top while building execution capacity below?
- If you have more than nine goals, consolidate.
3. Build In Accountability
- Calculate what percentage of your elements have no owner.
- Pull a report of all owners who haven't updated in 90 days.
- Decide: Will you reassign or remove them?
- Track "% unowned elements" and "% active owners" on page one.
4. Optimize Your Calendar
- Map when your projects are due throughout the year.
- Calculate what percentage finishes in December and June.
- If any month exceeds 15%, start moving projects.
- Create mid-quarter finish windows in Q2 and Q3.
5. Check Your Reality
- Stop comparing yourself to industry averages.
- Start comparing yourself to execution fundamentals.
- Ask: are we implementing the disciplines that work across all sectors?
This isn't transformation. This is tuning. The organizations that excel at execution didn't revolutionize their approach—they implemented basic disciplines consistently.
And here's the thing about disciplines: They compound.
Durham didn't see results in year one. Fort Lauderdale didn't simplify overnight. Carilion didn't build 300 scorecards in a month. JEA didn't break down silos with a memo.
They built execution capacity incrementally, learning from each cycle, refining their approach based on what worked.
The data shows this is possible. Your job is to make it actual.
The 83% Question
I'll leave you with this: 83% of organizations complete less than 25% of their strategic projects.
Meanwhile, 5.7% of organizations average 93% completion.
That's not a 10% gap or a 20% gap. That's a chasm.
And the uncomfortable part? Both groups are making strategic plans. Both are holding planning sessions. Both are creating goals and measures and projects. Both are assigning owners and tracking progress.
The difference isn't in what they're doing—it's in how they're doing it.
What are the 5.7% doing differently?
After analyzing eight years of data, I can tell you exactly what separates these groups:

<p style="padding-left: 30px;">The 83% who fail treat strategic planning as an event. The successful 5.7% treat it as a system.</p>
<p style="padding-left: 30px;">83% confuse comprehensiveness with effectiveness. 5.7% associate focus with impact.</p>
<p style="padding-left: 30px;">83% assign owners administratively. 5.7% create real accountability.</p>
<p style="padding-left: 30px;">83% let the calendar happen to them. 5.7% design their execution flow.</p>
<p style="padding-left: 30px;">83% blame their industry for execution challenges. 5.7% implement disciplines that work regardless of sector.</p>
Which side of that gap do you want to be on?
The data says it's your choice. And unlike most strategic challenges, this one has a clear path forward.
You just have to start walking.