

Get answers like this one, first.
Google’s AI Overviews now favor the sources you choose. Add ClearPoint once, and our research shows up in your AI answers — badged and prioritized.
Add ClearPoint as a Preferred SourceFree · one click · applies only to your own Google results.
Learn how to establish RAG status for your KPIs, ensuring clear project insights and effective decision-making with practical steps and expert tips.
KPIs are crucial for understanding your organization's strengths and weaknesses. But let's be honest, staring at reports and relying on gut feelings isn't effective. You need a clear, objective way to evaluate your progress. A RAG status system provides just that. Using a simple red, amber, green rating, you can quickly see if you're on track, facing challenges, or cruising to success. This post explores how a robust RAG status system transforms KPI management, helping you spot roadblocks and celebrate wins. Want to steer your strategy with more confidence? Keep reading.
This is where ClearPoint Strategy comes in. Our software helps you efficiently manage and track your KPIs, providing clear, objective insights into your performance.
See ClearPoint Strategy in action! Click here to watch a quick DEMO on the software
Key Takeaways
- Establish clear criteria for RAG statuses: Define specific, measurable thresholds for red, amber, and green statuses based on your KPIs, incorporating both quantitative and qualitative factors. Ensure everyone is on the same page by documenting and sharing these criteria with all stakeholders.
- Tailor tolerances to each KPI: Start with standard tolerances, but adjust them based on the specific KPI and project phase. Factors like predictability, criticality, and your team's familiarity with the activity should inform your tolerance ranges. Regularly review and update these tolerances as needed.
- Use RAG statuses to drive action: Reporting statuses is just the first step. Develop clear action plans for each status—green, amber, and red—and ensure your team follows through. A platform like ClearPoint Strategy can help centralize reporting, improve communication, and streamline action planning.
Free KPI library
400+ KPI examples to set your RAG thresholds against
The Super KPI Kit — definitions, formulas and benchmarks by function and industry.
What is a RAG Status?
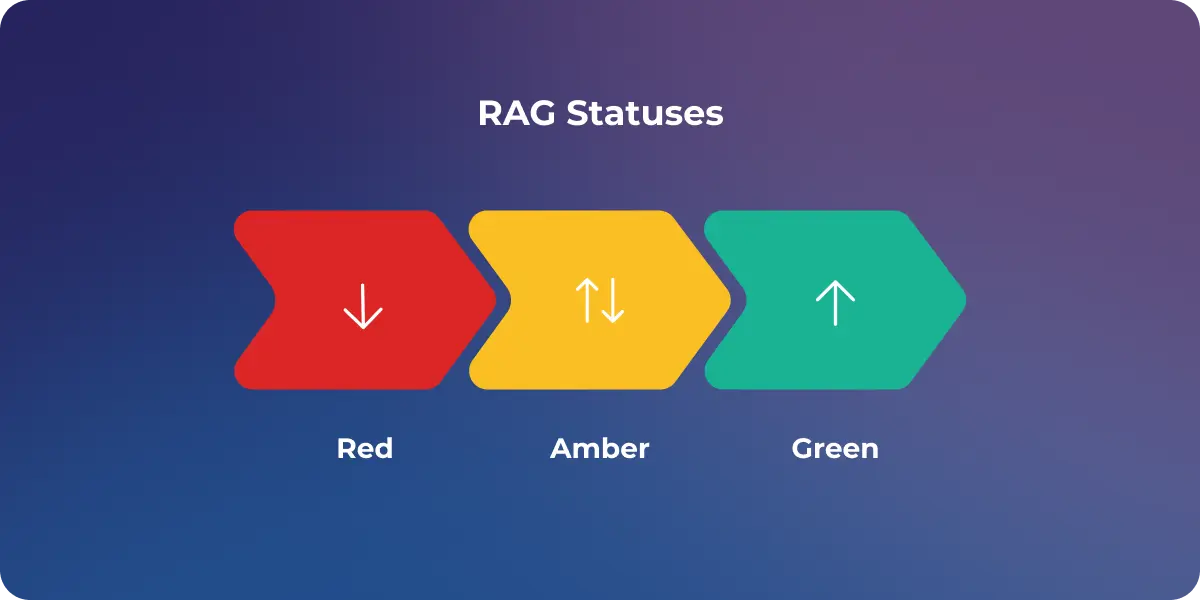
In project management RAG—or red, amber, green—statuses act as a KPI traffic light: red is an alert, amber (or yellow) signals caution, and green means you’re in the clear.
Within this article, we’ll walk through how you can establish your RAG statuses and tolerances. We’ll also explore how to know if you need to revise those tolerances and what circumstances might call for this editing.
What Does Each RAG Color Mean?
While the core colors remain consistent, their interpretations can be tailored to your organization's specific needs. Generally:
- Red: Indicates significant issues requiring immediate attention. Think missed deadlines, budget overruns, or major roadblocks. The project is seriously off track and may require significant intervention to recover. It's like a flashing red light—you can't ignore it.
- Amber: Signals potential problems or minor deviations from the plan. Perhaps a deadline is approaching quickly, or the budget is starting to creep up. While not critical yet, it warrants closer monitoring and proactive measures to prevent it from becoming a red status. Consider it a yellow light—proceed with caution.
- Green: Everything is proceeding as planned. The project is on track to meet its objectives and within budget. It's a green light—full speed ahead!
Beyond the traditional Red, Amber, Green, some organizations incorporate additional colors like Blue for completed projects or Gray to indicate insufficient information. These additions can provide a more nuanced view of project status. For example, using blue to signify completion adds a visual cue that helps everyone quickly grasp the overall project landscape.
Why is RAG Status Important?
RAG status provides a simple, universal language that everyone can understand, from project team members to senior executives. This shared understanding fosters transparency, facilitates quicker decision-making, and helps prioritize resources where they're needed most. Just like a traffic light system keeps traffic flowing smoothly, RAG statuses keep projects moving forward efficiently.
Accurate RAG reporting also requires a culture of trust and open communication within the project team. Team members need to feel comfortable reporting potential issues early on, even if it means assigning a yellow or red status. This transparency allows for timely intervention and prevents small problems from escalating into major crises. Think of it like a GPS for your projects—it helps you stay on course and alerts you to potential detours ahead. This is where a platform like ClearPoint Strategy can be invaluable, providing a centralized location to track and report RAG status updates, fostering that crucial transparency.
<div class="index-cards"><div class="index-card"><div class="index-card-title">RAG Data Holds The Key To Performance Improvement</div><div class="index-card-content"><p>Our <a href="https://www.clearpointstrategy.com/go/strategic-planning-report">2026 Strategic Planning Report</a> revealed that 51% of active projects are green — proof that success is achievable. Thanks to RAG status, organizations can also <em>see</em> where execution succeeds and where strategy stalls:</p><ul><li>39% of <strong>goals</strong> are green BUT…</li><ul><li>74% of goals overall have no owner.</li><li>To get a quick win: Assign every goal an owner.</li></ul><li>33% of <strong>measures</strong> are green BUT…</li><ul><li>The average number of measures is 2.5 times more than it should be.</li><li>To get a quick win: Reduce your measures to the ideal 9.</li></ul><li>45% of <strong>milestones</strong> are green BUT…</li><ul><li>They are only updated an average of 2x per year.</li><li>To get a quick win: Make more frequent updates.</li></ul></ul><p>Use these opportunities to your advantage! Require monthly RAG status updates for every goal, measure, project, and milestone, and intervene <em>before</em> failure occurs.</p><p><img src="https://cdn.prod.website-files.com/637e14518f6e3b2a5c392294/6972856b5801aab49c95af8d_rag-data-holds-the-key-to-performance-improvement.webp" alt="RAG Data Holds The Key To Performance Improvement - Active Projects" width="550" height="461" /></p></div><div></div>
Setting RAG Statuses: Where Do I Begin?
You’ll have to determine what you’re measuring or evaluating first—which should be pulled from your scorecard. Following that, you’ll need to determine a measure owner and a KPI target.
You’ll also have to decide whether you’re going to evaluate more than one series in a measure. A series is a way of displaying information in a measure, like a “target” and an “actual.” Many organizations only evaluate their KPIs based on actuals, but some also look at the year-to-date actual or the end-of-year forecast.
Regardless of what you decide on, you need to think about whether your target will change from one quarter to the next or if it will stay the same. For example, if you’re examining changes in revenue with a goal of one million dollars in net profit, it may change drastically each quarter: $250,000 in quarter one, $500,000 in quarter two, and so on. On the flip side, you might be trying to keep the employee retention rate at 90%, which would not and should not shift over each quarter.
If you’re not sure how to get started with this process, don’t worry—we’ve created a step-by-step toolkit, which you can download for free. (You’ll find it at the end of this article.)

Defining Your RAG Status Criteria
Now that you’ve laid the groundwork, it’s time to define what “red,” “amber,” and “green” actually mean in the context of your KPIs. Think of it like setting the thresholds for your strategy traffic light. Too sensitive, and everything will trigger a red light; not sensitive enough, and you might miss crucial warning signs. The key is to find the right balance—ClearPoint Strategy’s reporting features can help you strike that balance by providing a clear visual representation of your progress.
- Quantitative Metrics: Use measurable data points whenever possible. Hard numbers leave less room for interpretation. For example, “Green if within 5% of budget, Amber if within 6-10%, and Red if exceeding 10%.” Or, “Green if customer satisfaction is above 90%, Amber if between 80-89%, and Red if below 80%.” Having these specific ranges makes reporting objective and consistent. For more tips on using quantitative metrics for RAG status, check out this resource from Best Outcome.
- Qualitative Assessments: Not everything can be neatly quantified. For aspects that are harder to measure with numbers, establish clear descriptions. For instance, “Green if stakeholder feedback is positive and enthusiastic, Amber if there are minor concerns or suggestions for improvement, and Red if significant dissatisfaction is expressed or major roadblocks are encountered.” Replicon offers additional guidance on using qualitative assessments in RAG reporting.
Documenting and Communicating Your Criteria
Imagine a traffic light where no one agrees on what the colors mean. Chaotic, right? The same applies to your RAG status criteria. Once you’ve defined them, document them clearly and share them with all stakeholders. This ensures everyone is on the same page and understands how RAG statuses are assigned. A centralized platform like ClearPoint Strategy can be invaluable for maintaining and communicating these guidelines, and even allows you to link your RAG criteria directly to your KPIs, simplifying reporting and analysis. This shared understanding is crucial for transparency and quicker decision-making. Enov8 discusses the importance of clear communication with RAG statuses in more detail.
What's the Right Tolerance Range for My RAG Status?
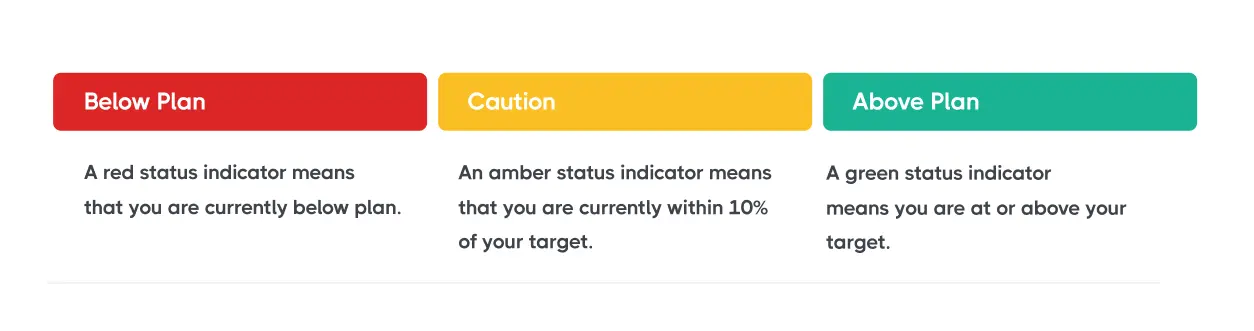
It’s important to have a starting place for your tolerance ranges. This is a good place to begin:
- Green: At or above your target.
- Amber: Within 10% of your target.
- Red: Less than 10% of your target.
But keep in mind that this is only a guideline. There are many situations where you will need to modify this to make your RAG statuses fit better in line with the KPI you’re measuring—which leads us to our next question.
Strict or Flexible: What's the Best Approach for RAG Status Tolerances?
Your amber status might need to be tighter—perhaps within 3-5% of your target (instead of 10%)—in the following situations:
- If you are very familiar with the element you are measuring and your results are highly predictable. This may be the case for an activity that you repeat frequently, like answering the phone in your call center.
- If it is critical to act quickly when the measure goes off track. For instance, any safety, uptime, and call response time measures are going to need to have a tighter tolerance. This is critical to the vitality of your business, so being 10% off of something like safety should likely be indicated as red.
Your amber RAG statuses might need to be looser—perhaps within 20% of your target (instead of 10%)—for these reasons:
- If there’s not a lot of volume for the activity. Consider a situation where you are tracking renewal rates and you have a very small percentage of customers who are renewing. If your tolerance is set too tight, you might trigger a red status when it should be yellow.
- If you’re not as familiar with an activity. Let’s say you are integrating a new innovation at your company, or you’re trying to reduce waste and become more green. If you haven’t done something like this before, you’re probably not sure what to expect. In response, consider loosening your RAG statuses, so you don’t trigger red when you should still be amber.
Tailoring Tolerances to Project Phase
Consider adjusting tolerances based on the project phase. Early stages, when you're still gathering data and experimenting, might allow for more flexibility (a wider tolerance range for amber, for example). Think of it like giving your team some breathing room as they find their footing. Later, as you approach deadlines, stricter controls and tighter tolerances become crucial. At that point, even small deviations could snowball into big problems, so early warnings are essential.
Regularly Reviewing and Adjusting Tolerances
Your strategy isn't static, and neither should your RAG status tolerances. As projects progress and circumstances change, it's essential to revisit your tolerances to ensure they remain relevant and effective. What was an acceptable variance a few months ago might be a red flag today. Don't be afraid to adjust them as needed. Regular reviews, perhaps quarterly or tied to key project milestones, can help you stay on top of these shifts. For a more streamlined approach, a platform like ClearPoint Strategy can centralize your data and track changes over time.
Claim your FREE Project Management Field Guide for project success
Streamline Your KPI Management with ClearPoint Strategy
Ready to take control of your KPI management and eliminate guesswork? ClearPoint Strategy is here to streamline your process. Our comprehensive software solution helps you set, track, and adjust your RAG statuses effortlessly, ensuring your KPIs are always aligned with your strategic goals.
Book a personalized demo with our experts and see how our software can help you achieve precise, data-driven insights.
Book your FREE 1-on-1 DEMO with ClearPoint Strategy
FAQ:
Adding RAG Status in Excel: A Quick How-To
To add RAG status in Excel:
- Create a new column for RAG status.
- Use Conditional Formatting: Select the cells in the RAG status column, go to the Home tab, click on Conditional Formatting, and choose 'New Rule.'
- Set the Rules: Define rules based on your criteria (e.g., Green for values >= 90%, Amber for 70%-89%, Red for < 70%).
- Apply Formatting: Choose the appropriate color fill for each condition (Red, Amber, Green) and click OK.
Determining RAG Status: A Simple Guide
RAG status is determined by:
- Setting Criteria: Define specific thresholds for Red, Amber, and Green based on performance metrics.
- Evaluating Performance: Compare actual performance against these thresholds.
- Green: Indicates performance is on or above target.
- Amber: Indicates performance is slightly below target and may need attention.
- Red: Indicates performance is significantly below target and requires immediate action.
RAG Status in Project Management: What Does It Mean?
In project management, RAG status is a color-coded system used to indicate the health of a project:
- Red: Significant issues or delays; immediate action required.
- Amber: Potential issues that need monitoring; some corrective actions may be needed.
- Green: On track; no immediate issues or risks.
Presenting RAG Status in PowerPoint: Best Practices
To show RAG status in PowerPoint:
- Insert a Table or Shapes: Use a table or shapes to represent different status indicators.
- Color Coding: Manually fill the cells or shapes with Red, Amber, or Green colors based on the status.
- Add Labels: Include labels or legends to explain the meaning of each color.
- Use Icons: Alternatively, use color-coded icons (traffic lights) to represent each status.
What is a RAG Status Report, and Why Do I Need One?
A RAG status report is a visual tool used in project management to provide a quick overview of the project’s health:
- Red: Highlights areas with significant issues or high risks.
- Amber: Indicates areas with potential issues or moderate risks.
- Green: Shows areas that are on track and performing well.
The report helps stakeholders quickly assess project status and identify areas needing attention.
Responding to RAG Statuses: Taking Action
Green Status: Staying the Course
While a Green status is positive, it doesn’t mean you can become complacent. Regularly review your key performance indicators (KPIs), continue monitoring progress, and communicate regularly with your team to ensure the project stays on track. Think of it like tending a garden—even when your plants are thriving, they still need water and occasional weeding to prevent issues from cropping up.
Amber Status: Investigating and Course Correcting
An Amber status signals a potential detour. Investigate the underlying causes, increase monitoring frequency, and implement corrective actions to steer the project back on course. Open communication with stakeholders is crucial at this stage. Ask yourself, “What’s causing this yellow light? Is it a temporary blip or a sign of a larger problem?” Early intervention is key to preventing the situation from escalating.
Red Status: Taking Decisive Action
A Red status requires immediate attention and decisive action. Conduct a thorough analysis to understand the root causes, develop a recovery plan, and communicate transparently with stakeholders. Be prepared to make difficult decisions, including potentially stopping the project if recovery is deemed unfeasible. A Red status is like a fire alarm—it’s time to act swiftly and decisively. ClearPoint Strategy can help you manage this process, providing a central platform for communication and action planning.
Beyond the Basics: Advanced RAG Status Techniques
Using RAG Status for Different Project Aspects
RAG status isn’t just for overall project health. Apply it to individual aspects like budget, schedule, scope, and risk to gain a more granular view of project performance. This is like getting a detailed health check-up instead of just a general overview. It helps you pinpoint specific areas for improvement.
Scaling RAG Status for Different Project Sizes
For smaller projects, a single overall RAG status might suffice. However, for larger, more complex projects, consider using hierarchical RAG statuses, breaking down the project into smaller components, each with its own RAG status. This allows for more targeted interventions and a clearer understanding of where challenges lie. Think of it like managing a large team—you need to delegate and monitor performance at different levels to ensure overall success.
Common Pitfalls to Avoid with RAG Status Reporting
Oversimplification
While simplicity is a strength of RAG status, avoid oversimplifying complex situations. Use RAG status as a starting point for deeper conversations and analysis, not as a replacement for them. Don’t just treat the symptoms; diagnose the underlying disease.
Subjectivity and Bias
Establish clear, objective criteria for assigning RAG statuses to minimize subjectivity and bias. Regularly review and calibrate your criteria to ensure consistency across projects and teams. A platform like ClearPoint Strategy can help enforce these objective standards and maintain consistency.
Lack of Follow-Through
Assigning RAG statuses is only the first step. The real value lies in the actions taken in response to those statuses. Develop clear action plans for each status and ensure accountability for follow-through. A traffic light is useless if drivers ignore it. Similarly, RAG statuses are only effective if they trigger appropriate action. Establish clear processes and responsibilities to ensure your team responds effectively to each status.


