
![Why Strategic Planning Fails (And What To Do About It) [DATA]](https://cdn.prod.website-files.com/637e14518f6e3b2a5c392294/69792f326ab0b1ac3cc24675_why-strategic-planning-fails-and-what-to-do-about-it-data-blog-header.webp)
Get answers like this one, first.
Google’s AI Overviews now favor the sources you choose. Add ClearPoint once, and our research shows up in your AI answers — badged and prioritized.
Add ClearPoint as a Preferred SourceFree · one click · applies only to your own Google results.
![Why Strategic Planning Fails (And What To Do About It) [DATA]](https://cdn.prod.website-files.com/637e14518f6e3b2a5c392294/688a2e9e7c35a603fab4b409_Dylan_Miyake_1.webp)
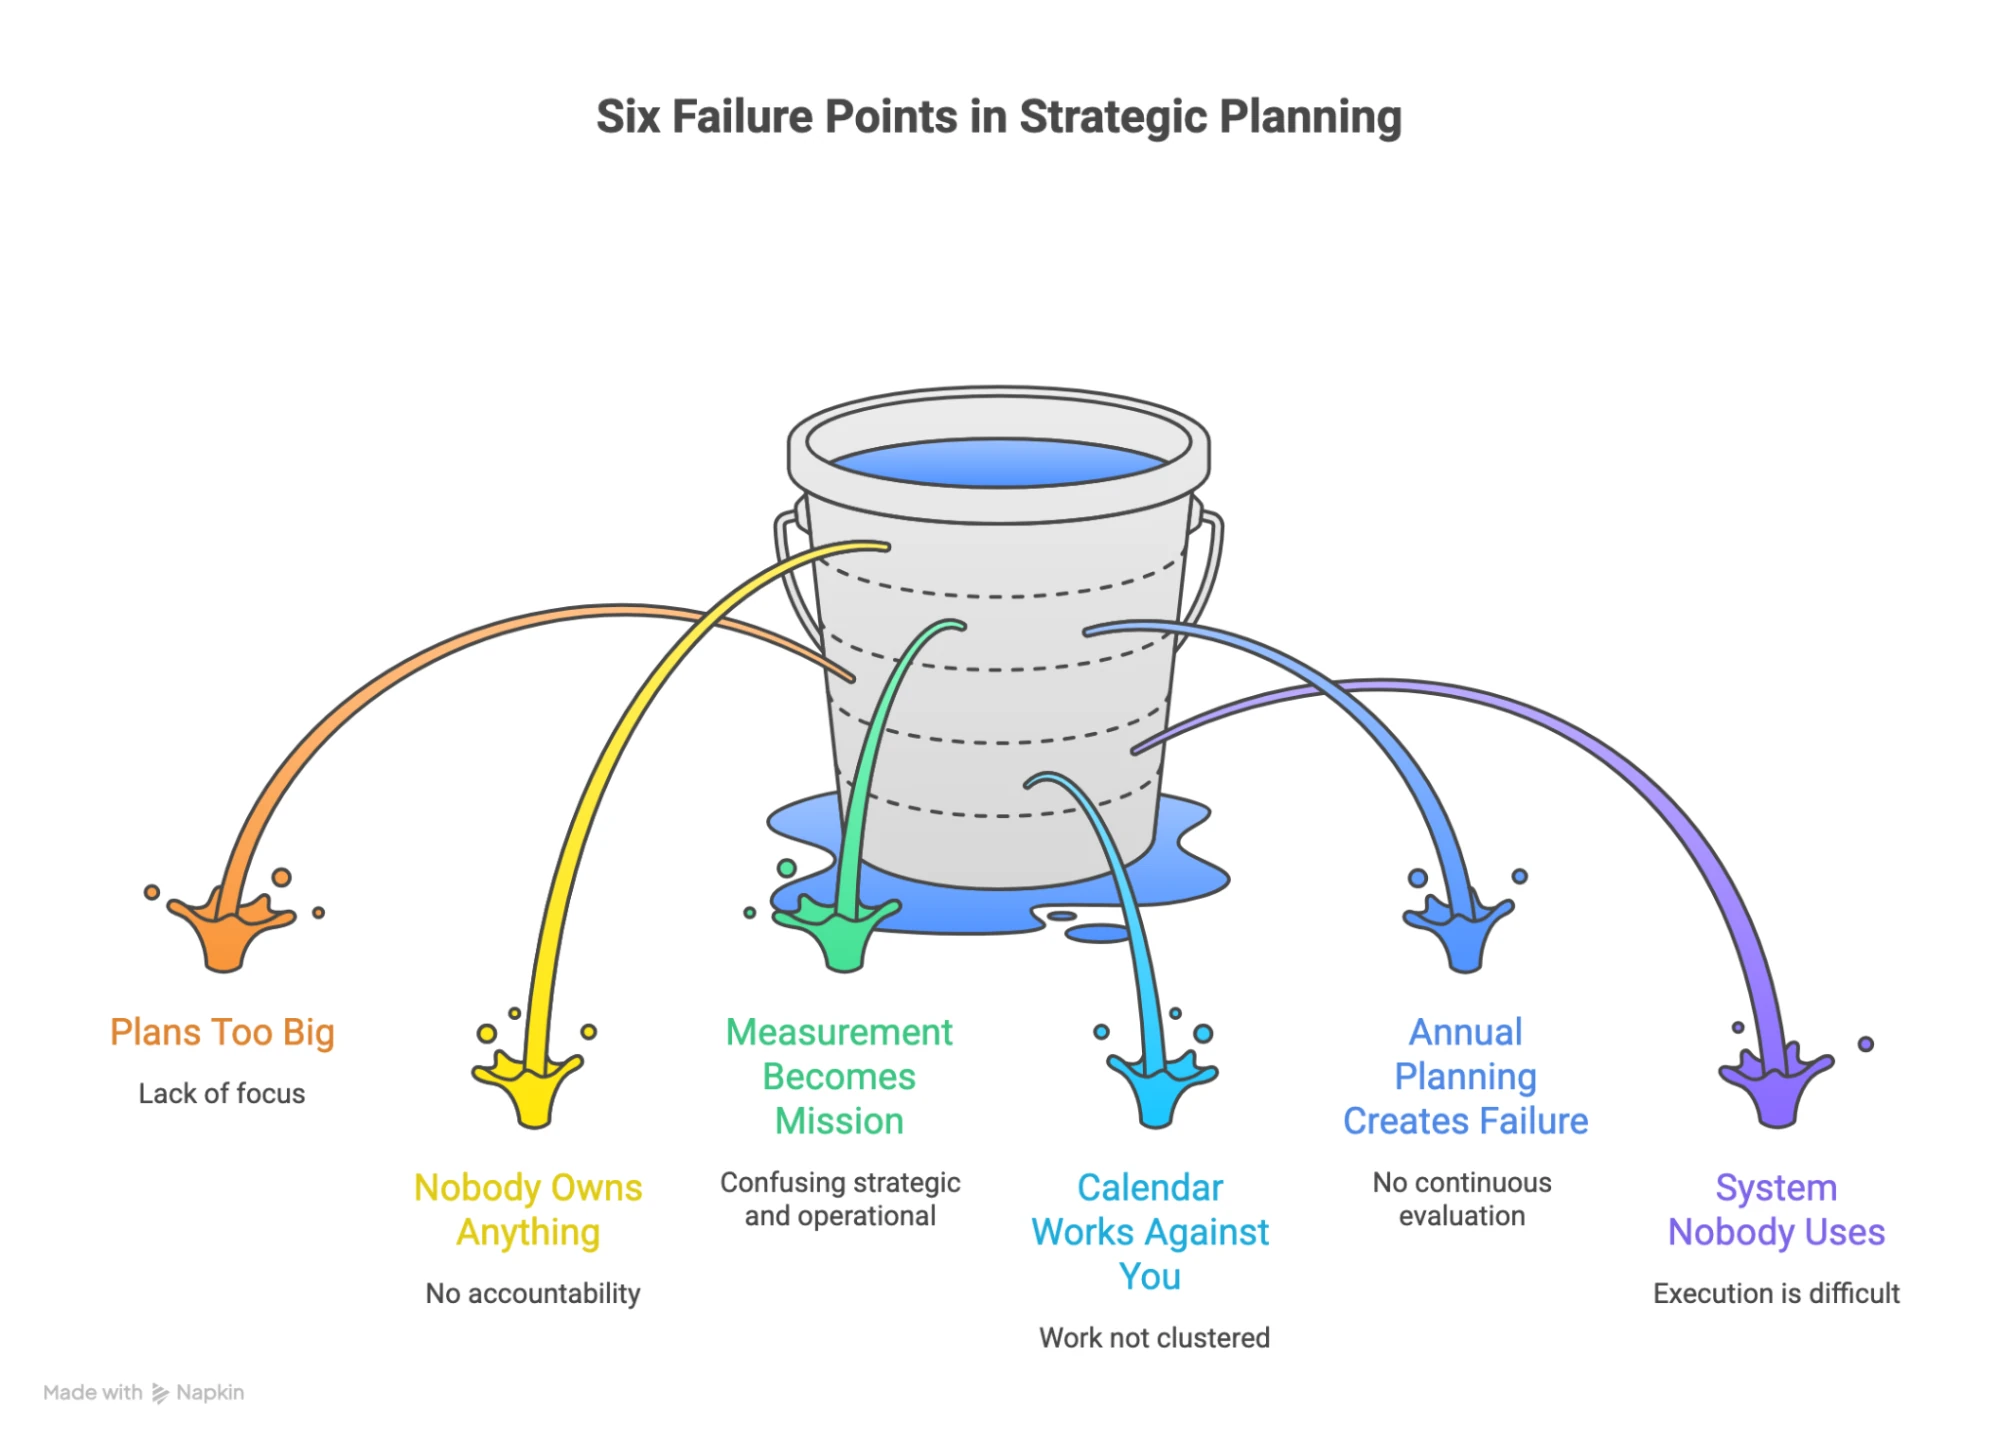
There are primarily six reasons why most organizations fail to achieve their goals—here’s what they are and how you can overcome them.
Let me start with the statistic that should change how you think about strategic planning: 83% of organizations complete less than 25% of their strategic projects.
- Strategic planning fails for six predictable, avoidable reasons, starting with plans too big to execute mathematically.
- Plans with fewer than 20 elements succeed 68% of the time; ownership is the silent killer, with 74.3% of goals unowned.
- Measurement becomes the mission when teams confuse tracking with progress; 22% of measures are set up but never collected.
- The calendar works against execution: 29% of projects end in December and January launches 8.5 times more projects than December.
- Annual planning creates annual failure; the fix is a Week 1 audit against all six failure points, then cutting scope before adding reporting.
Not “struggle with.” Not “take longer than expected.” “Complete.”
Less than 25%.
The typical strategic plan is 75% failure by design. Organizations pour months into planning sessions, hire consultants, conduct stakeholder interviews, build beautiful frameworks, create impressive presentations—and then fail to execute three-quarters of what they committed to doing.
After analyzing 31.2 million rows of data from 20,582 strategic plans across eight years, I can tell you exactly why strategic planning fails. More importantly, I can show you what organizations that actually execute are doing differently.
The failures are predictable. And they're avoidable.
Failure Point #1: Plans Are Too Big To Execute
The first failure happens before execution even begins: Organizations create strategic plans that are mathematically impossible to complete.
Here's what the data shows:
- Plans with fewer than 20 total elements succeed 68% of the time
- Plans with 60 or more elements succeed just 8% of the time
Eight percent. When you build a 60-element plan, you're building for failure.
Organizations keep doing this because planning sessions reward comprehensiveness over focus. "What about this priority?" "We should include that initiative." "This department needs representation in the plan."
Soon you have 12 goals, 38 objectives, 191 initiatives, and 142 KPIs.
<p style="padding-left: 30px;">👉<strong>Fort Lauderdale, Florida</strong> discovered this when they launched "Press Play Fort Lauderdale" in 2013 with exactly those numbers: 12 goals, 38 objectives, 191 initiatives, 142 KPIs. They developed a management system with cross-departmental meetings involving over 100 staff every two months.</p>
<p style="padding-left: 30px;">Kristin Tigner, their Structural Innovation Manager, recalls the result: limited collaboration, increased frustration, more work without more resources.</p>
<p style="padding-left: 30px;">The breakthrough came when Tigner advocated for "simplify, excel, and expand." Instead of executing 191 initiatives simultaneously, they focused on fewer priorities. Execute well. Expand to new areas. Repeat.</p>
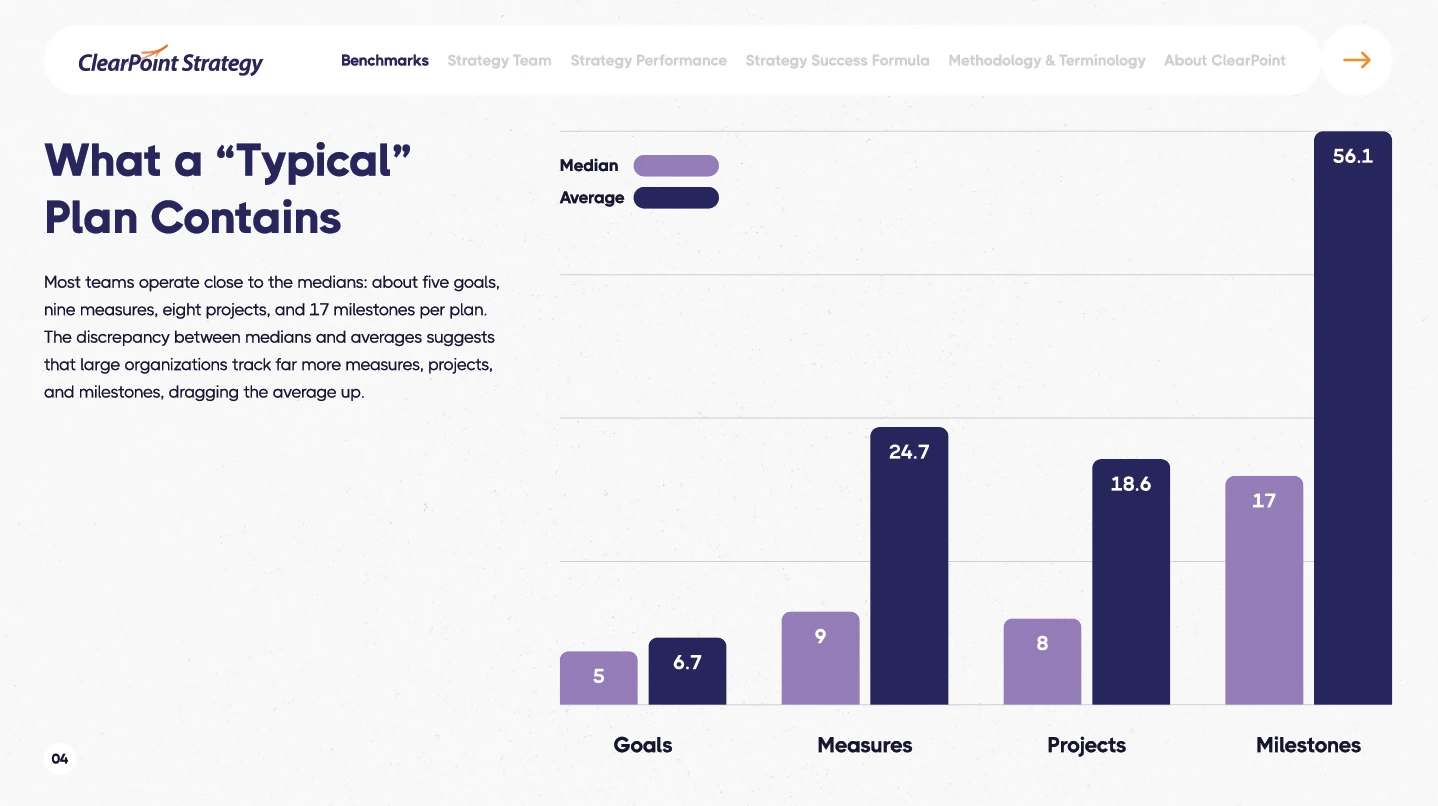
<div class="index-cards"><div class="index-card"><div class="index-card-title"><h3><strong>The Optimal Plan Size…</strong></h3></div><div class="index-card-content"><p>Successful plans have roughly 40 elements or fewer:</p><ul><li>5-9 strategic goals (median: 5)</li><li>9-11 measures (median: 9)</li><li>5-8 projects (median: 8)</li><li>15-20 milestones (median: 17)</li></ul><h3><strong>How To Fix Your Plan:</strong></h3><p>Audit your current plan. Count the total elements. If you're over 40, start cutting. Every element over 40 reduces your probability of success by roughly 2-3%.</p></div><div></div>
Germantown, Tennessee operates within the optimal range. When they developed "Germantown Forward 2030"—their 15-year strategic plan that helped them win the Malcolm Baldrige National Quality Award—they focused on what matters for customer satisfaction (they call citizens "customers") and strategic outcomes.
The lesson: Strategic planning fails when plans are too big to execute.
Failure Point #2: Nobody Actually Owns Anything
The second failure point is invisible in most strategic plans but deadly to execution: the ownership gap.
The data reveals the extent of this failure:
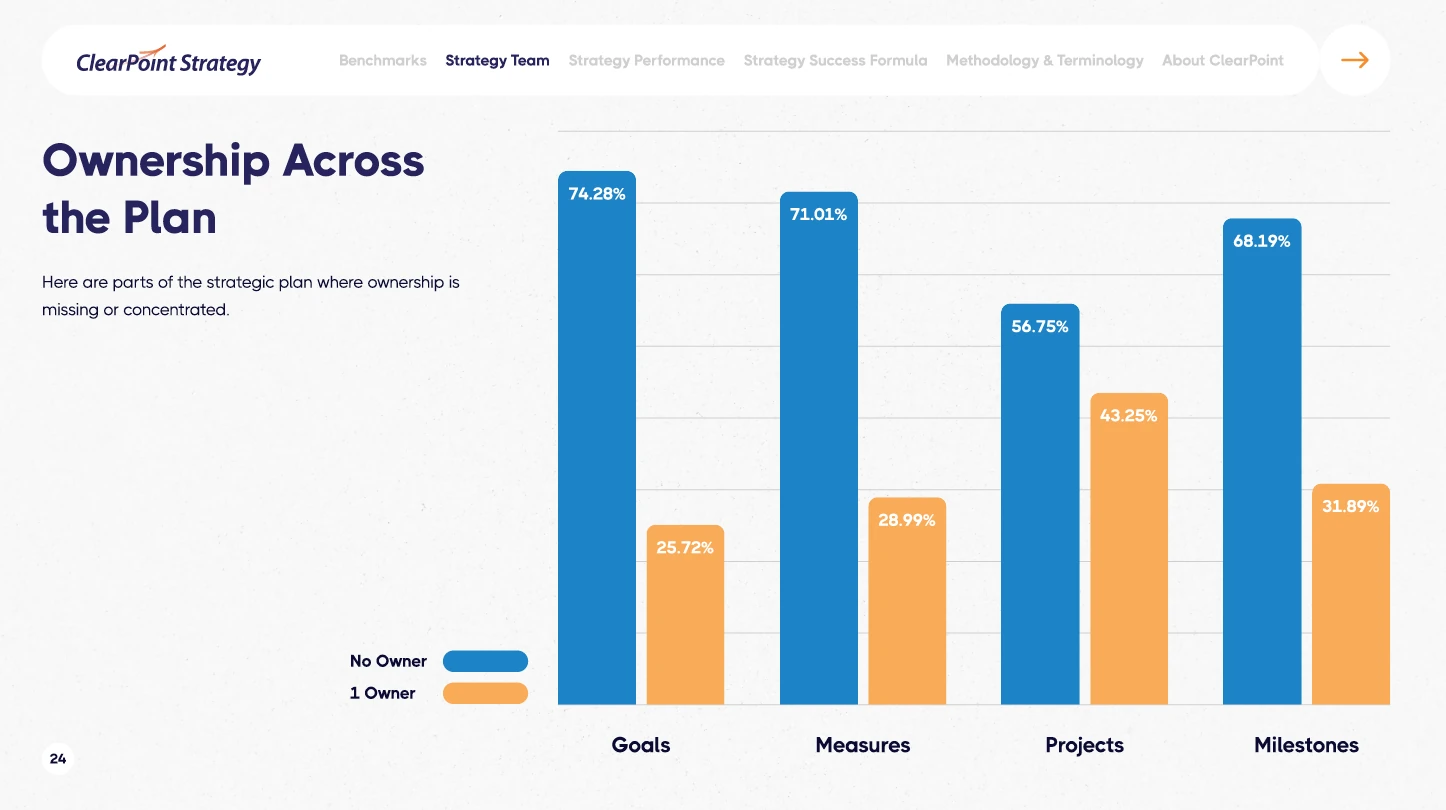
- 74.3% of goals have no owner assigned
- 71% of measures lack an owner
- 68.2% of milestones have no responsible party
- 56.8% of projects have no designated owner
Even when ownership exists on paper, it's often phantom ownership. Only 13.8% of assigned owners actually updated their work in the last 90 days.
That means 86.2% of people listed as "owners" aren't actively working on what they supposedly own.
Administrative ownership happens during planning sessions: "Let's put Sarah's name here. Let's assign this to the Operations team."
Real ownership happens daily: Sarah wakes up thinking about the project and knows whether it moved forward yesterday.
<p style="padding-left: 30px;">👉<a href="https://www.clearpointstrategy.com/customers/city-of-durham"><strong>Durham, North Carolina</strong></a> solved this by making ownership real at every level. When they rebuilt their performance management structure in 2014 after their first implementation struggled, they created <a href="https://www.clearpointstrategy.com/blog/strategy-needs-accountability">accountability</a> structures that made ownership matter.</p>
<p style="padding-left: 30px;">Shari Metcalfe, Durham's Strategy and Performance Manager, leads a team of just two people overseeing performance management for the entire city. That lean structure only works because ownership is distributed and real throughout the organization.</p>
<p style="padding-left: 30px;">Durham now operates with over 100 trained employees who actively manage their portions of the strategic plan. Each has clear ownership. Each knows who's watching their progress. Each understands that phantom ownership won't cut it.</p>
<p style="padding-left: 30px;">The city's integration of performance data into budget decisions creates additional accountability. When your department's funding depends on demonstrated progress toward strategic objectives, ownership stops being theoretical.</p>
<div class="index-cards"><div class="index-card"><div class="index-card-title"><h3><strong>How To Fix The Ownership Gap</strong></h3></div><div class="index-card-content"><p>1️⃣ <strong>Implement the 90-day rule.</strong> Every goal, measure, project, and milestone needs one person accountable. If that person hasn't updated their work in 90 days, reassign or cancel. No exceptions.</p><p>2️⃣ <strong>Track two metrics visibly:</strong> "% elements without owners" and "% active owners." Put them on page one of your strategic plan. Review them monthly.</p></div><div></div>
Failure Point #3: Measurement Becomes The Mission
The third failure point looks like good management: Organizations confuse measuring progress with making progress.
The data shows this clearly:
- 22% of measures never even get started—set up but never collected
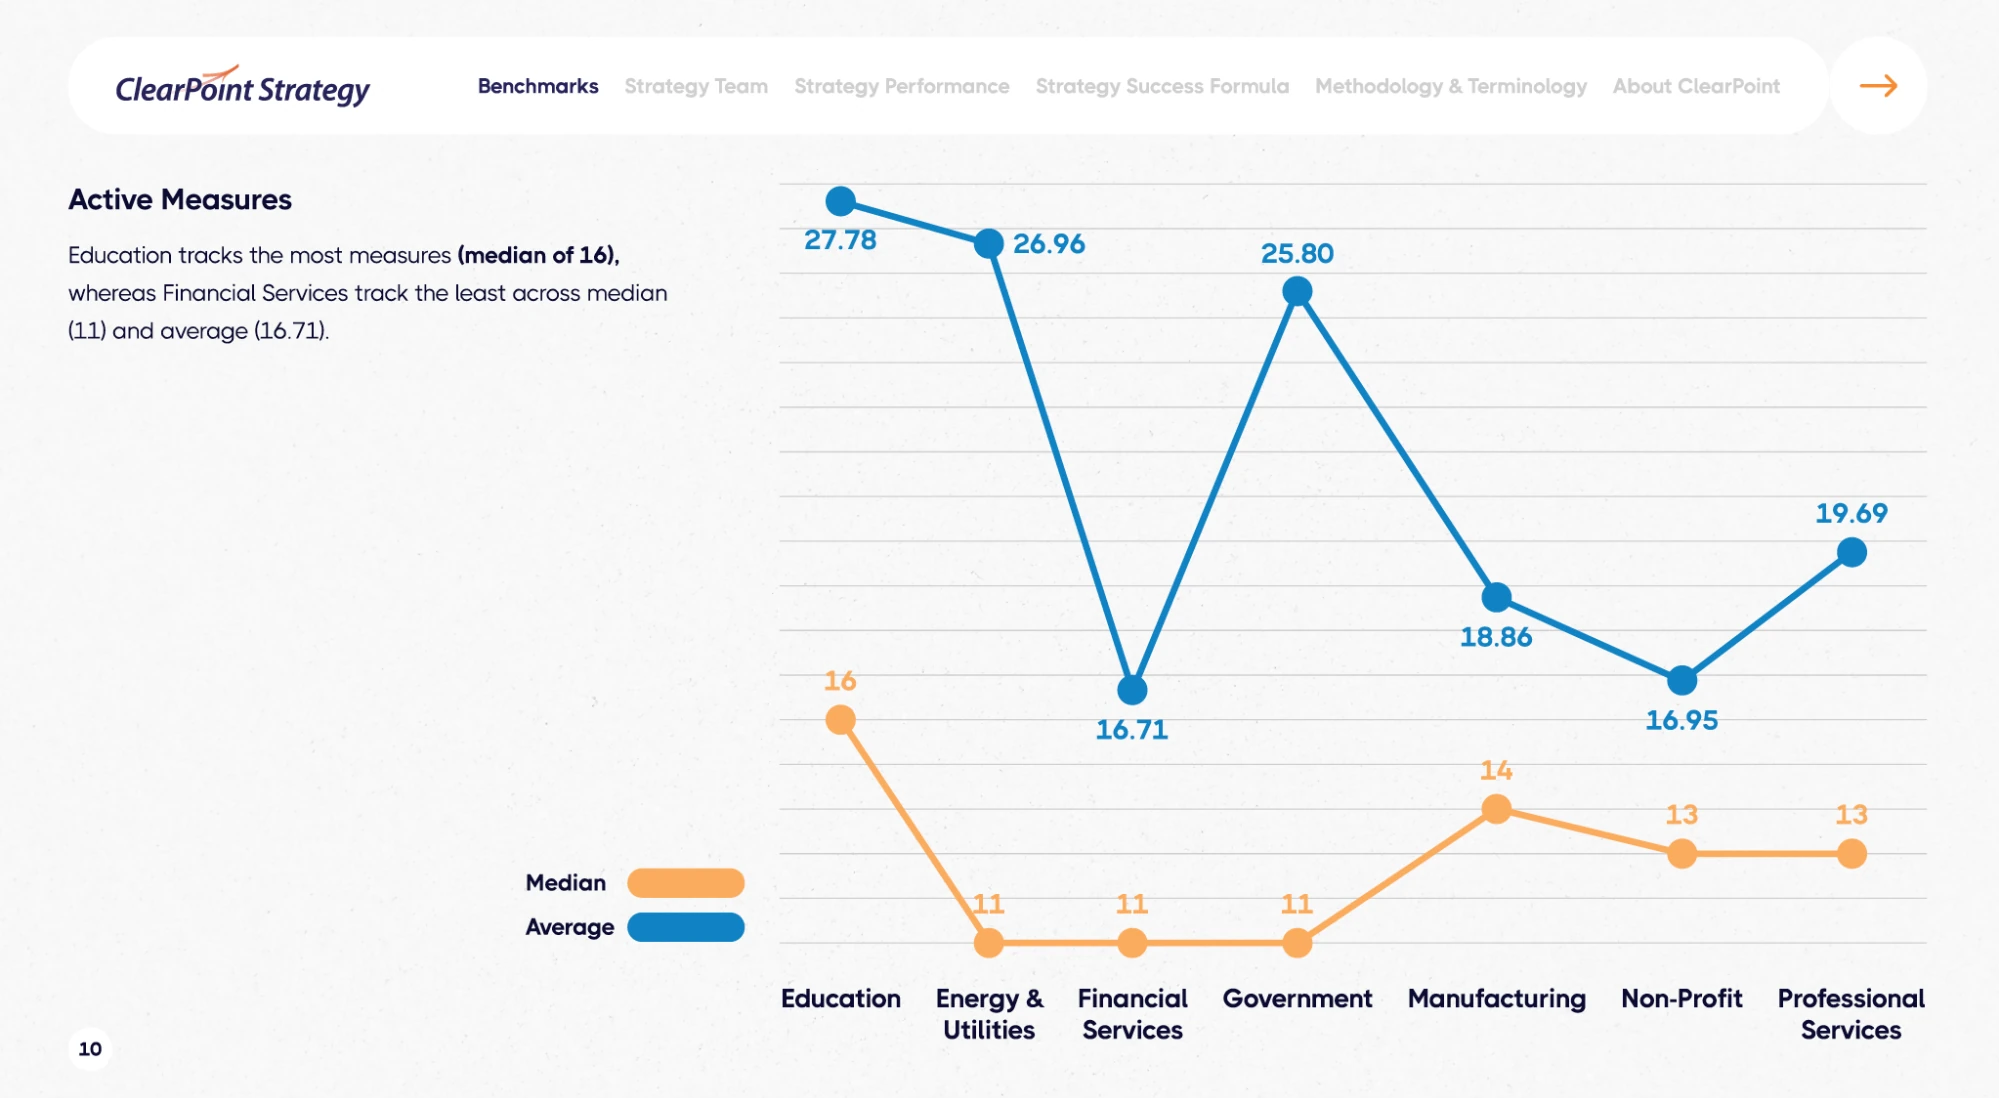
- The median plan tracks 9 measures, but averages vary wildly (Healthcare: 22.92, Education: 16)
- 71% of measures have no owner
Organizations are creating comprehensive measurement systems that nobody actually uses for decision-making.
They're tracking metrics because they can, not because they should.
<p style="padding-left: 30px;">👉<strong>Fort Collins, Colorado</strong> lived this failure. When they started tracking performance, they quickly accumulated over 400 metrics across three layers: Community Dashboard metrics, budget request metrics, and departmental operational metrics.</p>
<p style="padding-left: 30px;">They held quarterly Service Area Reviews trying to discuss all these metrics. Budget Director Lawrence Pollack recalls: "It quickly became apparent that it was not possible to review so many metrics in the time allotted."</p>
<p style="padding-left: 30px;">They cut to 200 "primary" metrics. Still too many. Discussions improved but lacked context about why these metrics mattered.</p>
<p style="padding-left: 30px;">The breakthrough came when they shifted focus from metrics to outcomes. For each strategic outcome, they identified 3-4 metrics that actually informed strategic decisions. They called these reviews "Strategy Maps"—Metrics, Analysis, and Performance.</p>
Not every metric deserves strategic attention. Operational metrics belong in operational systems. Strategic metrics belong in strategic reviews. Mixing them creates measurement theater where everyone is too busy tracking data to make decisions.
JEA, one of the nation's largest utilities, implements this separation systematically. Kendra Cash, their Enterprise Strategy Specialist, explains: "Our day-to-day metrics live in internal systems, but anything related to our strategy lives in ClearPoint. It keeps things clean and eliminates confusion."
This clean separation allows JEA to track hundreds of operational metrics while keeping strategic leadership focused on what drives strategic decisions. Each quarter, they produce reports with "more visuals and fewer tables" to tell the story quickly.
<div class="index-cards"><div class="index-card"><div class="index-card-title">How To Measure Effectively:</div><div class="index-card-content"><p>1️⃣ <strong>Implement ruthless archiving.</strong> Any measure showing "Not Started" for two consecutive quarters gets removed from the strategic plan.</p><p>2️⃣ <strong>Separate operational from strategic measurement.</strong> Track 9-11 strategic measures total, about 2 per goal. Everything else is operational and belongs in operational systems.</p></div><div></div>
Failure Point #4: The Calendar Works Against You
The fourth failure point hides in plain sight: The way organizations schedule strategic work guarantees bottlenecks.
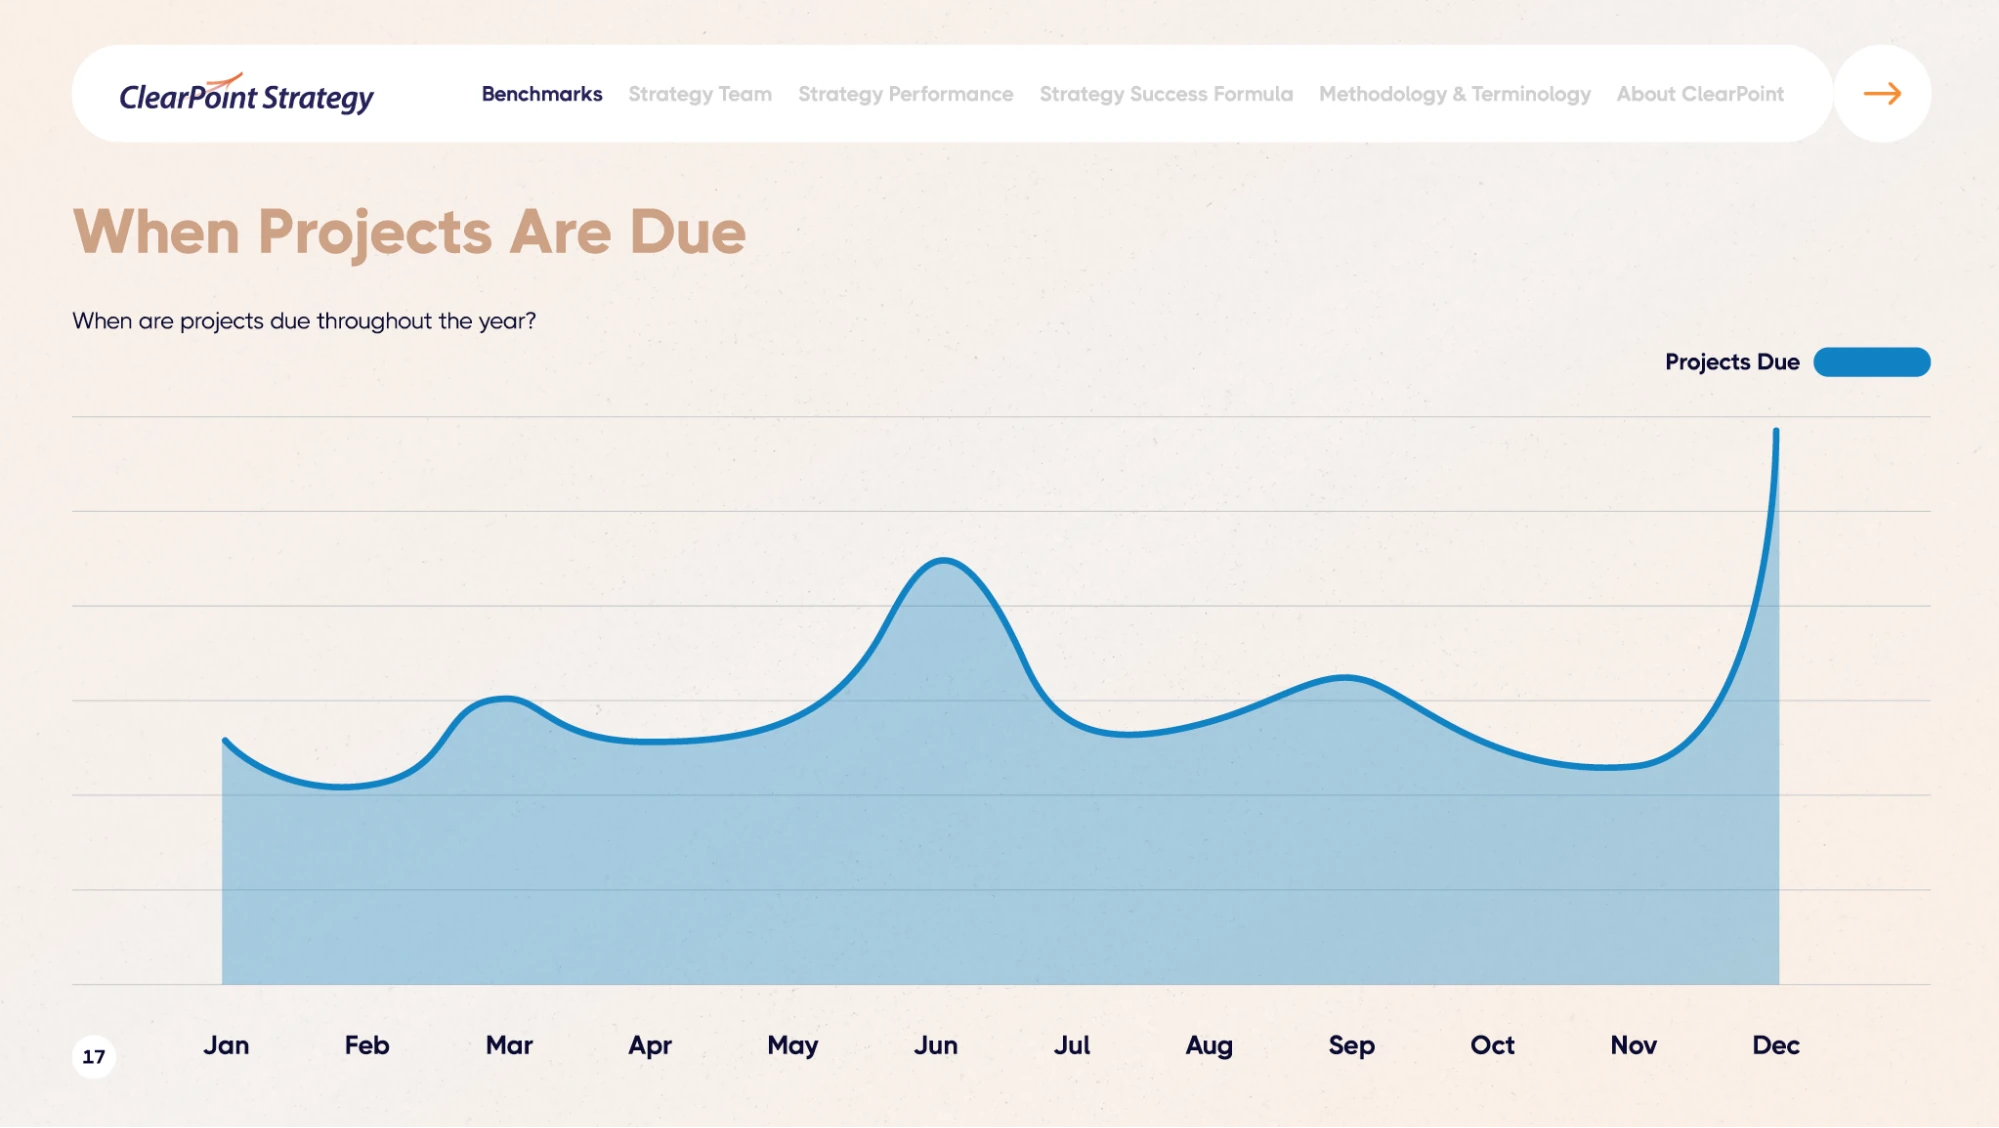
Remember this statistic: 29% of all projects have end dates in December, and 18% finish in June. Nearly half of all strategic work is due in just two months.
What happens when 47% of your portfolio comes due simultaneously?
Resources get stretched. Quality suffers. Projects that could succeed with focused attention get delayed because everyone is drowning in year-end or mid-year deliverables.
Organizations create this problem by aligning strategic timelines to fiscal calendars. "We do annual planning, so projects run for a year, so everything's due in December."
Another calendar failure…
The data also shows another calendar failure: January launches 8.5 times more projects than December. Organizations finish their planning, take a break for the holidays, then launch everything simultaneously in January.
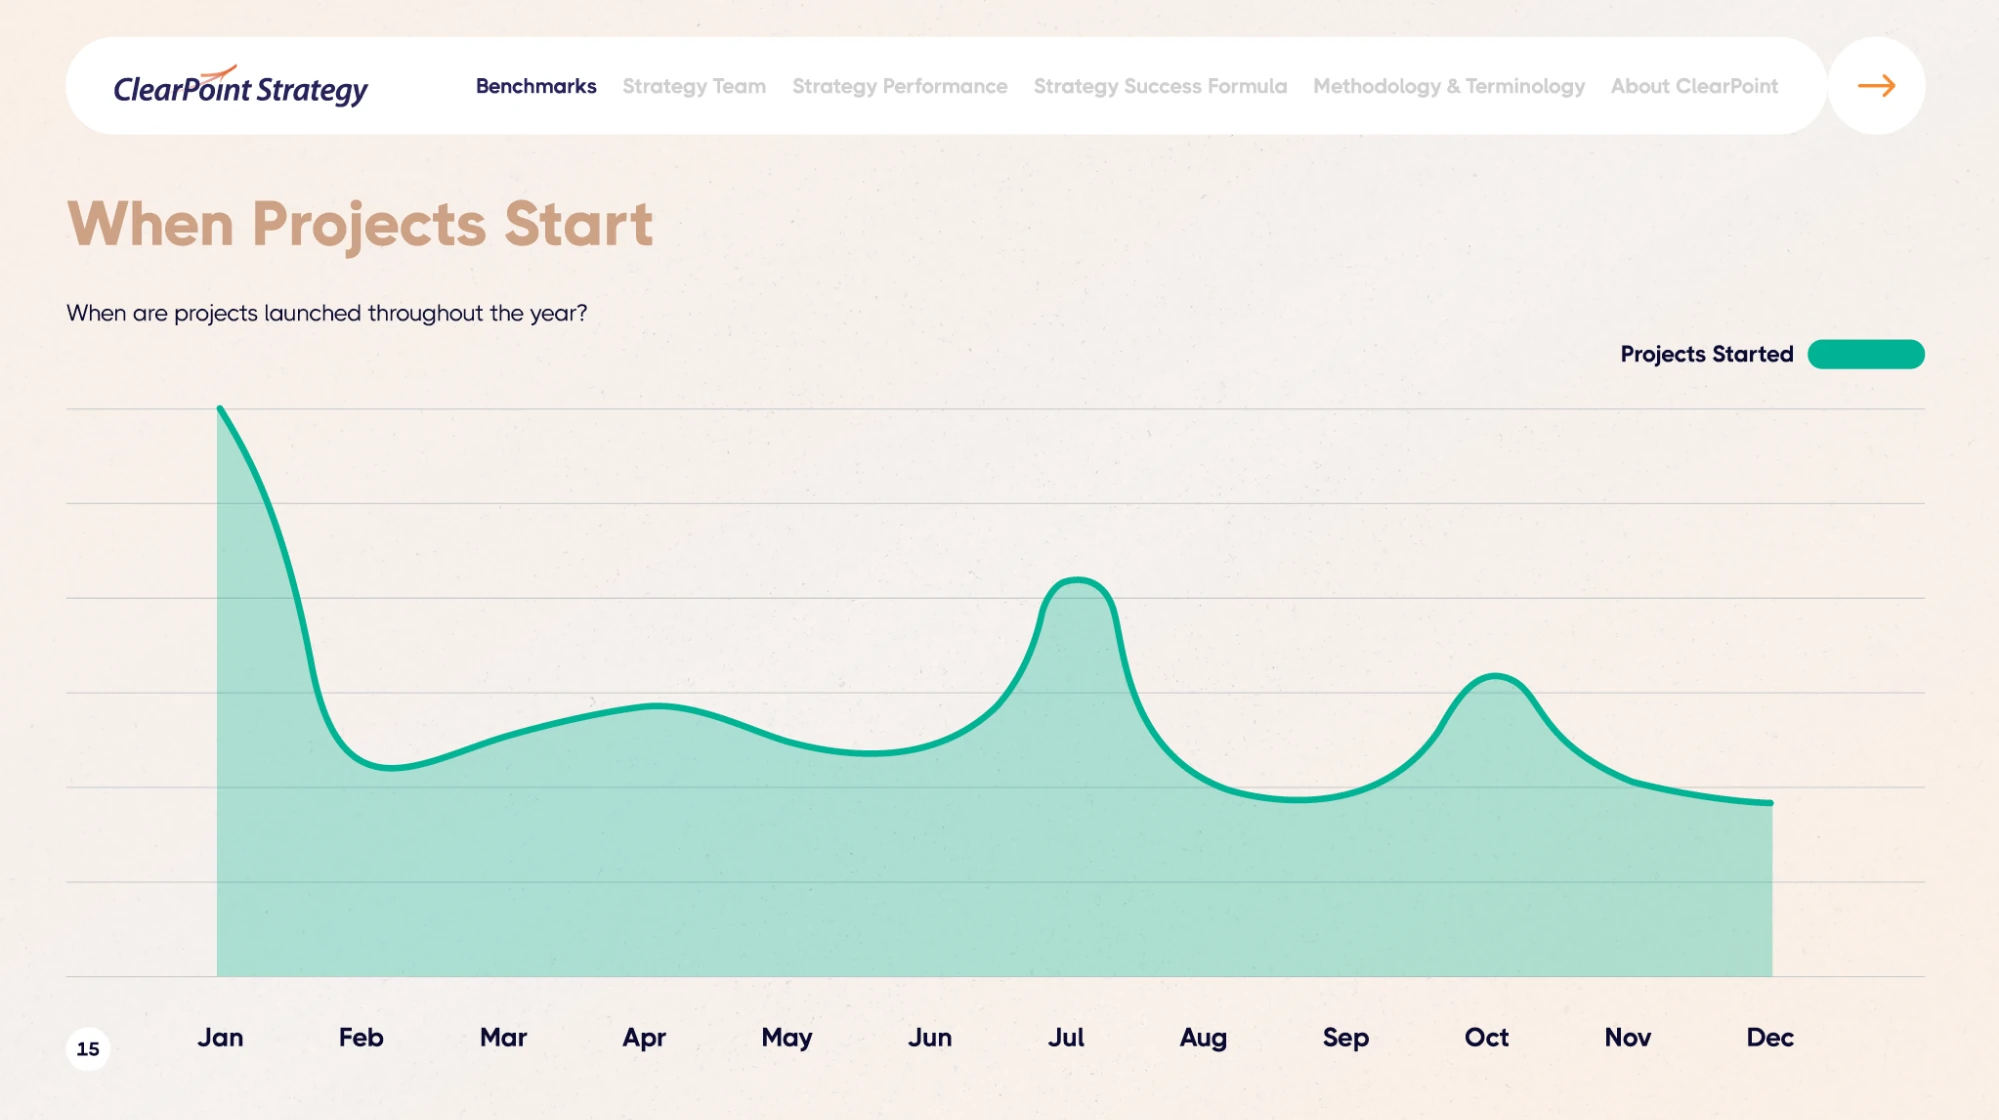
Then nothing much happens until February, when updates peak at 2,045,105—about 43.5% higher than August. There's a two-month lag between launch and execution while projects ramp up.
Meanwhile, the lowest activity months—December, September, and August—total just 11.2% of annual project starts. Organizations essentially stop launching strategic work for a quarter of the year.
This boom-bust cycle destroys execution momentum.
<p style="padding-left: 30px;">👉<strong>Raleigh</strong> solved this through their continuous framework. "Envision. Enact. Evaluate. Engage." runs ongoing, not once a year. The "Enact" phase begins as soon as planning creates clarity, not on January 1st. The "Evaluate" phase happens quarterly through CORStat meetings, not just at year-end.</p>
<p style="padding-left: 30px;">This creates a steady execution rhythm. Projects launch when ready. Projects complete when done. No artificial clustering around fiscal deadlines.</p>
<p style="padding-left: 30px;"><strong>Durham</strong> implements similar calendar discipline through their three-year strategic planning cycle with continuous evaluation. They don't wait for December to assess performance or January to launch initiatives. Work flows throughout the year based on strategic logic.</p>
<p style="padding-left: 30px;"><a href="https://www.clearpointstrategy.com/customers/fort-collins"><strong>Fort Collins</strong></a> restructured their entire review process around this principle. Their Strategy Map approach with quarterly outcome reviews means strategic work maintains consistent attention year-round. Lawrence Pollack pushed for this specifically because he recognized that annual reviews create the January-launch, December-deadline pattern that guarantees bottlenecks.</p>
<p style="padding-left: 30px;"><strong>Germantown's</strong> quarterly Business Plan reviews serve the same purpose. The City Administrator meets with each department director every quarter, creating four natural evaluation and adjustment points per year instead of one massive year-end scramble.</p>
<div class="index-cards"><div class="index-card"><div class="index-card-title">How To Create A Cadence That Supports Success</div><div class="index-card-content"><p>1️⃣ <strong>Set a guardrail</strong> that no single month can contain more than 15% of your planned completions. If December or June exceeds this threshold, rebalance immediately.</p><p>2️⃣ <strong>Create mid-quarter completion windows</strong>—mid-March, mid-June, mid-September, mid-December. Allow projects to finish when they're actually ready, not when the calendar says they should.</p></div><div></div>
Failure Point #5: Annual Planning Creates Annual Failure
The fifth failure point is built into the name: "annual strategic planning."
Most organizations treat strategic planning as an event—something that happens once a year, usually in Q4, resulting in a document that gets presented, approved, and then largely ignored until next year's planning cycle.
This creates predictable failures:
- Projects that need adjustment wait until the next annual review
- Initiatives that should be cancelled continue consuming resources
- New strategic priorities can't be added mid-year
- Learning from failures only happens once a year
- Momentum dies between planning cycles
The data shows this in completion rates. The 83% of organizations that complete less than 25% of their projects aren't experiencing random failure—they're experiencing systematic failure caused by treating strategy as an annual event rather than a continuous process.
<p style="padding-left: 30px;">👉<strong>Durham's</strong> transformation from struggling to successful directly correlates with shifting from annual planning to continuous cycles. Their three-year <a href="https://www.clearpointstrategy.com/blog/18-month-strategic-planning-cycle">strategic planning cycle</a> includes:</p>
<ul style="padding-left: 60px;">
<li>Year 1 (First 9 months): Creating the citywide plan with long-term priorities</li>
<li>Years 1-2: Departments execute business and fiscal plans</li>
<li>Year 3: Deep evaluation and identification of improvement areas</li>
</ul>
<p style="padding-left: 30px;">The critical part: "Throughout this cycle, regular evaluations ensure continuous improvement rather than waiting for the formal review period."</p>
<p style="padding-left: 30px;">Jay Reinstein, Durham's Strategic Plan Project Manager, captures the mindset: "With data now driving decision making, it's all about results." Not annual results. Not planned results. Actual results, continuously.</p>
<p style="padding-left: 30px;"><strong>Fort Collins</strong> moved explicitly away from annual metrics review to quarterly Strategy Maps focused on outcomes. This shift from annual to quarterly created four opportunities per year to identify problems, adjust course, and remove blockers.</p>
<p style="padding-left: 30px;">Lawrence Pollack didn't just want better annual reviews—he wanted continuous strategic management. The quarterly cadence makes that possible.</p>
<div class="index-cards"><div class="index-card"><div class="index-card-title">How To Implement Continuous Strategic Management</div><div class="index-card-content"><p>1️⃣ <strong>Replace annual planning with continuous cycles.</strong> Maintain a rolling strategic plan that gets updated quarterly. Create regular review forums focused on problem-solving, not status updates.</p><p>2️⃣ <strong>Evaluate performance quarterly.</strong> Launch projects when they're ready, not just in January. Complete projects when they're done, not when the fiscal year ends.</p></div><div></div>
Failure Point #6: The Plan Lives In A System Nobody Uses
The sixth failure point reveals organizational dysfunction: Strategic plans live in systems that are too complicated, too disconnected, or too ignored to drive execution.
Before organizations adopt integrated strategic planning systems, they typically operate with:
- Excel spreadsheets for tracking metrics
- PowerPoint decks for reporting
- Email chains for updates
- SharePoint or network drives for storage
- Separate systems for budgeting, projects, and performance
This fragmentation creates failure in multiple ways. Nobody has a complete view of strategic progress. Updates require manual compilation from multiple sources. Reports are out of date as soon as they're created. And the friction of using disconnected systems means people just... stop using them.
<p style="padding-left: 30px;">👉<strong>Durham</strong> experienced this in their first implementation. Despite having strategic planning software, most staff reverted to Excel within a year. Why? Because there was no clear ownership, no accountability structure, and nobody understood how their data was being used.</p>
<p style="padding-left: 30px;">When Durham rebuilt their approach in 2014, they created systems that people actually wanted to use because using them made work easier.</p>
<p style="padding-left: 30px;">Shari Metcalfe describes the transformation: "A big turning point for our performance management was getting a system that we could use to manage all that data. It's just easier. Less time putting numbers in a system and more time actually looking at the numbers and making decisions based on those."</p>
<p style="padding-left: 30px;">That shift—from data entry burden to decision-making tool—only happens when the system is designed for actual use, not just comprehensive data collection.</p>
<p style="padding-left: 30px;"><strong>Germantown</strong> made this transition from "Excel and various software tools" to <a href="https://www.clearpointstrategy.com/">ClearPoint</a> specifically because their old approach "lacked alignment and consistency, as departments often used different reporting methods and formats."</p>
<p style="padding-left: 30px;">The new system enabled their Baldrige Award achievement. As their Budget Director Lawrence P. explains: "I believe the framework we were able to build with strategy and performance metrics and using ClearPoint to visualize that data was a feather in our cap in achieving Baldrige designation."</p>
<p style="padding-left: 30px;">The visualization matters because it makes strategy accessible. When the City Administrator meets with department directors quarterly for Business Plan reviews, they're not wrestling with spreadsheets—they're looking at clear views of strategic alignment and performance.</p>
<div class="index-cards"><div class="index-card"><div class="index-card-title">How To Make Strategy Accessible</div><div class="index-card-content"><p>1️⃣ <strong>Implement integrated systems</strong> that make strategic management easier. The right system should reduce time spent on data entry and increase time spent on strategic decision-making.</p><p>2️⃣ <strong>Look for systems that provide:</strong></p><ul><li>Single source of truth for strategic data</li><li>Easy updating that encourages regular use</li><li>Clear visualization that makes progress obvious</li><li>Flexible reporting for different audiences</li><li>Integration with operational systems</li></ul>
What Success Actually Looks Like
After documenting six major failure points, here's what success looks like in practice:
✅Fort Lauderdale went from 191 initiatives causing frustration to a focused portfolio they could actually execute. Kristin Tigner's "simplify, excel, and expand" philosophy didn't compromise ambition—it enabled achievement.
✅Durham went from Excel spreadsheets and initial software failure to over 100 actively engaged employees managing continuous three-year strategic cycles. They integrated performance data into budget decisions, saved $1.8 million by eliminating non-strategic spending, and maintained a triple-A bond rating through economic challenges.
✅Raleigh built an Analytics Academy that reached 100% of departments and created CORStat meetings that solve problems in real-time rather than defer them to next year. Monica Croskey Chaparro ensures departments have voice in the strategic plan, creating engagement instead of resentment.
✅Fort Collins transformed from 400+ metrics causing meeting overload to Strategy Maps with 3-4 measures per outcome enabling focused strategic discussions. Lawrence Pollack got the strategic-level executive reviews he pushed for because the system supported outcomes over metrics.
✅Germantown won the Malcolm Baldrige National Quality Award—the highest presidential honor for performance excellence—by treating performance management as everyday operations rather than annual events. De'Kisha Fondon oversees a system employees actually use because it makes their work better.
✅Carilion Clinic created 300 scorecards with clear ownership linking compensation to patient-centered care outcomes. Darren Eversole describes an organization where "everyone is rowing in the same direction" because the system creates alignment instead of confusion.
✅JEA breaks down silos through visible collaboration on strategic objectives while maintaining clean separation of operational and strategic metrics. Kendra Cash can explain their system clearly because it's designed for clarity.
These organizations didn't avoid the six failure points through luck or special circumstances. They systematically addressed each one:
- Failure Point #1 (Plans too big): They maintain focused portfolios within the 20-40 element range.
- Failure Point #2 (Nobody owns anything): They implement real ownership with the 90-day rule and visible accountability.
- Failure Point #3 (Measurement becomes the mission): They ruthlessly separate strategic from operational metrics and archive non-starters.
- Failure Point #4 (Calendar works against you): They spread work throughout the year instead of clustering at fiscal boundaries.
- Failure Point #5 (Annual planning creates annual failure): They build continuous cycles with quarterly or more frequent evaluation.
- Failure Point #6 (System nobody uses): They implement integrated systems that make execution easier.
The 5.7% of organizations that complete 93% of their strategic projects do this consistently.
The Implementation Path: From Failure To Success
If you're recognizing your organization in these failure points, here's how to fix it:
Week 1: Audit Against The Six Failure Points
- Count total elements in your plan (Failure Point #1)
- Calculate % elements without owners (Failure Point #2)
- Count strategic vs operational metrics (Failure Point #3)
- Map when projects are due (Failure Point #4)
- Identify when you evaluate performance (Failure Point #5)
- Assess whether your current systems enable or hinder execution (Failure Point #6)
Week 2: Address The Ownership Gap
- Assign one owner to every unowned element
- Pull report of all owners who haven't updated in 90+ days
- Implement the 90-day rule: reassign or cancel
- Make "% unowned elements" and "% active owners" visible metrics
Week 3: Right-Size The Portfolio
- If over 40 total elements, identify candidates for cutting
- Use the 68/8 rule: <20 elements = 68% success, 60+ = 8% success
- Cut, don't "defer to later" or "put in parking lot"
- Communicate cuts as focus, not failure
Week 4: Separate Strategic From Operational Measurement
- Categorize every current metric: strategic or operational?
- Move operational metrics to operational systems
- Archive any strategic metric showing "Not Started" for 2+ quarters
- Target: 9-11 strategic measures total, ~2 per goal
Week 5: Fix The Calendar
- Set 15% guardrail for any single month's completions
- Create mid-quarter completion windows
- Move projects from December/June to Q2/Q3
- Build quarterly evaluation into your rhythm
Week 6: Move From Annual To Continuous
- Replace annual planning with rolling strategic plan
- Schedule quarterly strategic reviews focused on outcomes
- Create monthly or bi-monthly problem-solving forums
- Allow mid-cycle adjustments instead of waiting for annual refresh
Week 7: Evaluate Your Systems
- Assess whether current systems make execution easier or harder
- Identify where manual work could be automated
- Look for fragmentation requiring manual compilation
- Consider integrated strategic planning systems like ClearPoint
Durham took three years from failure to success. Fort Lauderdale iterated their approach over multiple cycles. Fort Collins evolved from 400+ metrics to Strategy Maps through continuous refinement.
Germantown built toward Baldrige over years, not months. Raleigh's Analytics Academy reached 100% of departments over three years. Carilion expanded from leadership scorecards to 300 scorecards incrementally.
The organizations that succeeded didn't fix everything simultaneously. They systematically addressed failure points, learned from each improvement, and built capability over time.
Why Most Organizations Won't Fix This
Here's the uncomfortable truth:
Most organizations reading this won't fix these failure points.
Not because they can't. The fixes require uncomfortable changes:
<ul><li>Cutting your strategic plan from 60 elements to 20 means telling stakeholders their priorities aren't strategic. <span style="text-decoration: underline;">That's uncomfortable.</span></li><li>Implementing the 90-day rule means removing people who've been assigned to initiatives for years. <span style="text-decoration: underline;">That's politically difficult.</span></li><li>Archiving measures that aren't being used means admitting you've been tracking things that don't matter. <span style="text-decoration: underline;">That's embarrassing.</span></li><li>Rebalancing the calendar means changing fiscal processes and budget cycles. <span style="text-decoration: underline;">That's bureaucratically complex.</span></li><li>Moving from annual to continuous evaluation means more frequent leadership attention to strategy. <span style="text-decoration: underline;">That's demanding.</span></li><li>Replacing disconnected systems with integrated platforms means change management and implementation effort. <span style="text-decoration: underline;">That's resource-intensive.</span></li></ul>
So most organizations will read this, nod in agreement, and then do nothing. They'll continue with plans too big to execute, phantom ownership, measurement theater, calendar bottlenecks, annual planning cycles, and disconnected systems.
They'll stay in the 83% completing less than 25% of their strategic projects. They'll keep explaining to stakeholders why initiatives didn't get finished. They'll keep planning strategies they won't execute.
Meanwhile, the 5.7% will keep completing 93% of what they commit to. They'll keep building organizational muscle memory around execution. They'll keep creating distance between their results and everyone else's results.
The gap isn't about knowledge—you now know what fails and what works. The gap is about willingness to do the uncomfortable work of changing how you operate.
The question isn't whether you can fix strategic planning failures. The data proves you can. The question is whether you're willing to do the uncomfortable work.
The Choice In Front Of You
Strategic planning fails for six predictable, avoidable reasons:
- Plans too big to execute
- Nobody actually owns anything
- Measurement becomes the mission
- The calendar works against you
- Annual planning creates annual failure
- The plan lives in systems nobody uses
Every organization faces the same choice: Continue doing the same things that lead to failure, or make different choices that lead to success.
The data shows what fails. The case studies show what works. ClearPoint provides the systems that make success easier.
Durham didn't succeed just because they used ClearPoint—they succeeded because they systematically addressed every failure point. Same with Raleigh, Fort Collins, Germantown, Carilion, and JEA.
The software made execution easier. The discipline made execution happen.
You now know the six failure points, and how to fix them.
Will you audit your plan against these points? Will you implement the uncomfortable fixes? Will you join the 5.7% who actually execute what they plan? Or will you stay in the 83% who keep planning strategies they won't execute?
The data says you can choose. And unlike most strategic challenges, this one has a clear path forward.
---
Note: This article is based on data from The 2026 Strategic Planning Report, analyzing 31.2 million rows of anonymized data from 20,582 strategic plans between 2017-2024. All case study details are drawn from real ClearPoint customer implementations.


