Get answers like this one, first.
Google’s AI Overviews now favor the sources you choose. Add ClearPoint once, and our research shows up in your AI answers — badged and prioritized.
Add ClearPoint as a Preferred SourceFree · one click · applies only to your own Google results.

Supercharge your strategy execution with the five insights we gleaned from a new kind of strategic planning analysis.
Most strategic planning reports tell you what other organizations are doing. This one tells you what actually works.
- Best planning peaks in November (320,916 logins, about 44% above August's low), but the best execution starts in February.
- Most assigned owners and collaborators are not actually working the strategy; teams are usually too big or too inactive, often both.
- Project duration reflects culture more than complexity: the median fell from 303 days in 2017 to 163 in 2020, then climbed back.
- Measure proliferation erodes clarity: the median plan tracks nine measures, yet averages run far higher, like 22.92 in healthcare.
- Completions surge mid-year, with 29% of projects ending in December and 18% in June, nearly half of all finishes in two months.
Recently, we analyzed eight years’ worth of data from ClearPoint accounts—31.2 million rows covering 20,582 strategic plans across government, healthcare, utilities, financial services, and other sectors. This data encompasses every aspect of how strategy actually happens: plans created, goals set, measures tracked, projects launched, and work completed (or not).
This isn't survey data where people tell you what they think they do.
This is behavioral data showing what organizations actually do when nobody's watching.
And the patterns that emerge challenge a lot of conventional wisdom about strategic planning.
So if you’re interested in optimizing your planning process—and doing it in a way that’s backed by real numbers—keep reading for the inside story on strategic planning.
Download the full report here.
Insight #1: The Best Planning Happens in November, But The Best Execution Starts in February
When we mapped user activity across the calendar year, we expected to see some seasonal patterns. What we found was more specific than expected.
November records the highest engagement at 320,916 logins—about 44% higher than August's low of 223,528. Organizations are in planning mode, building next year's strategic plan, aligning teams, and setting targets.
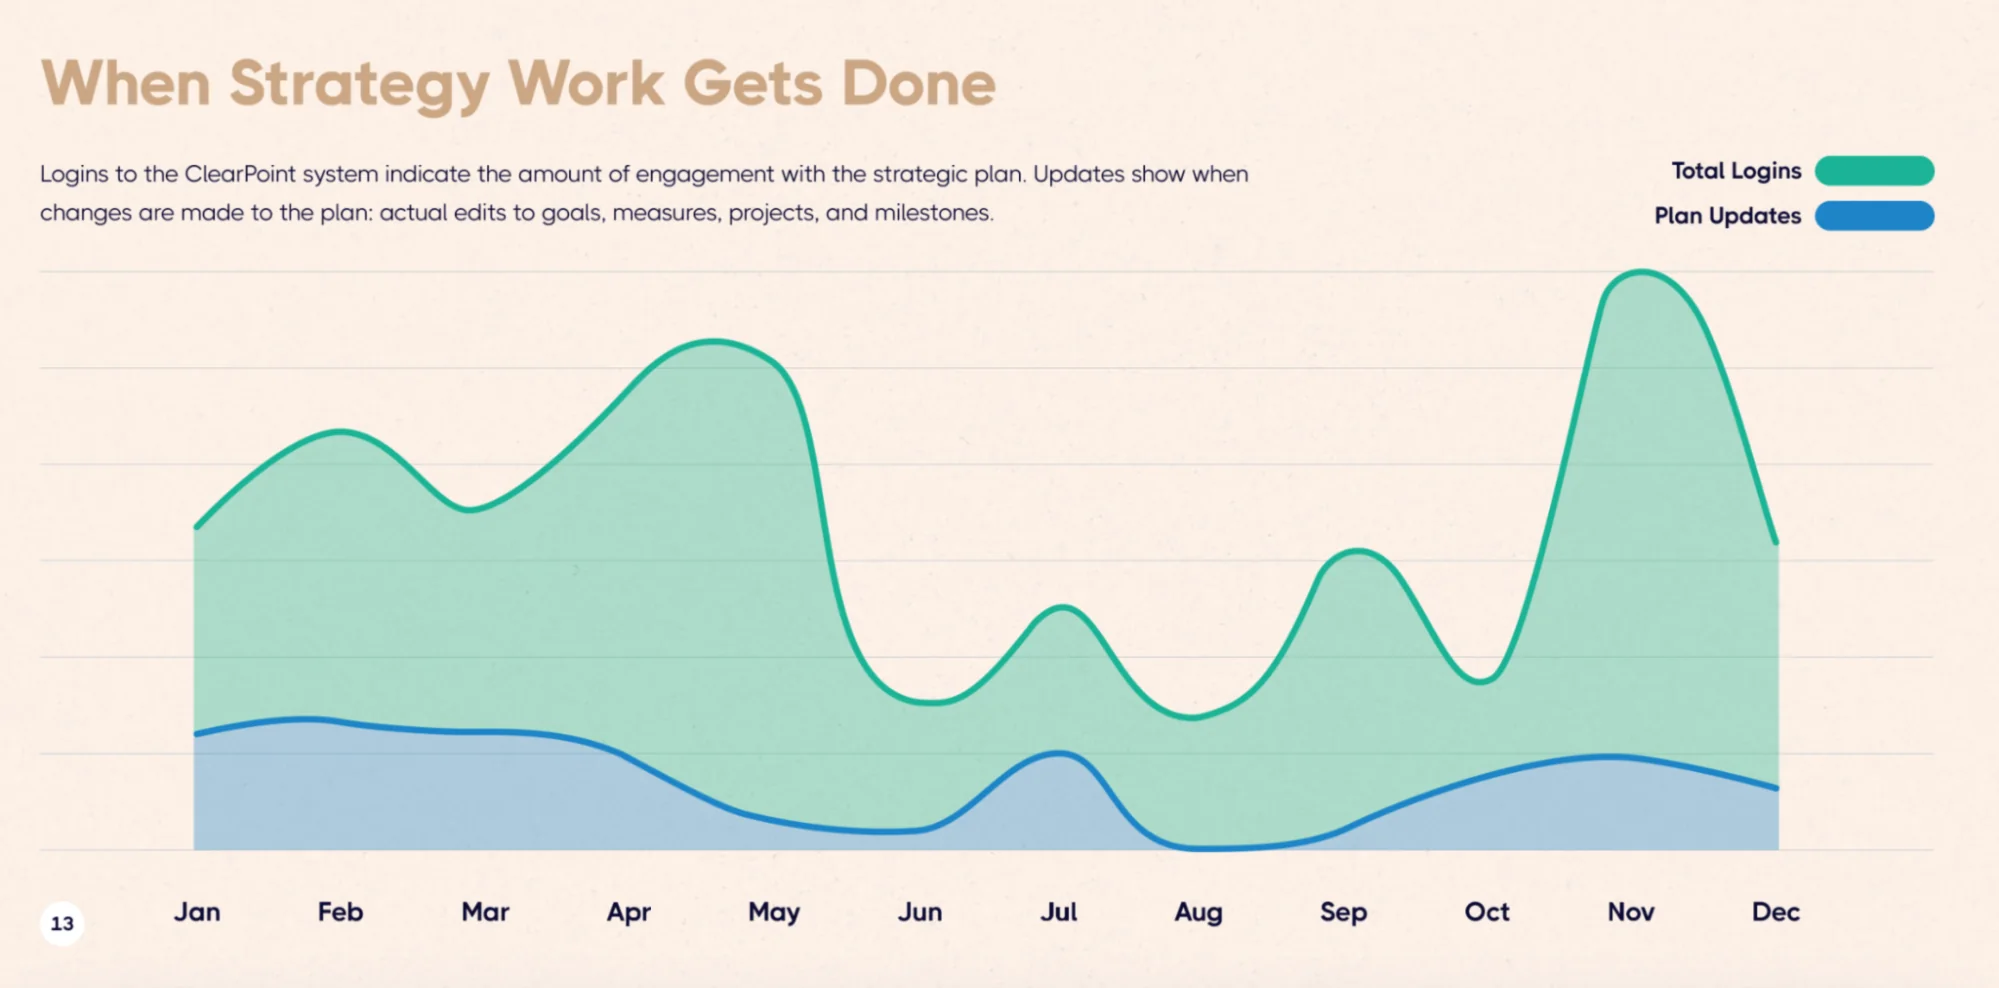
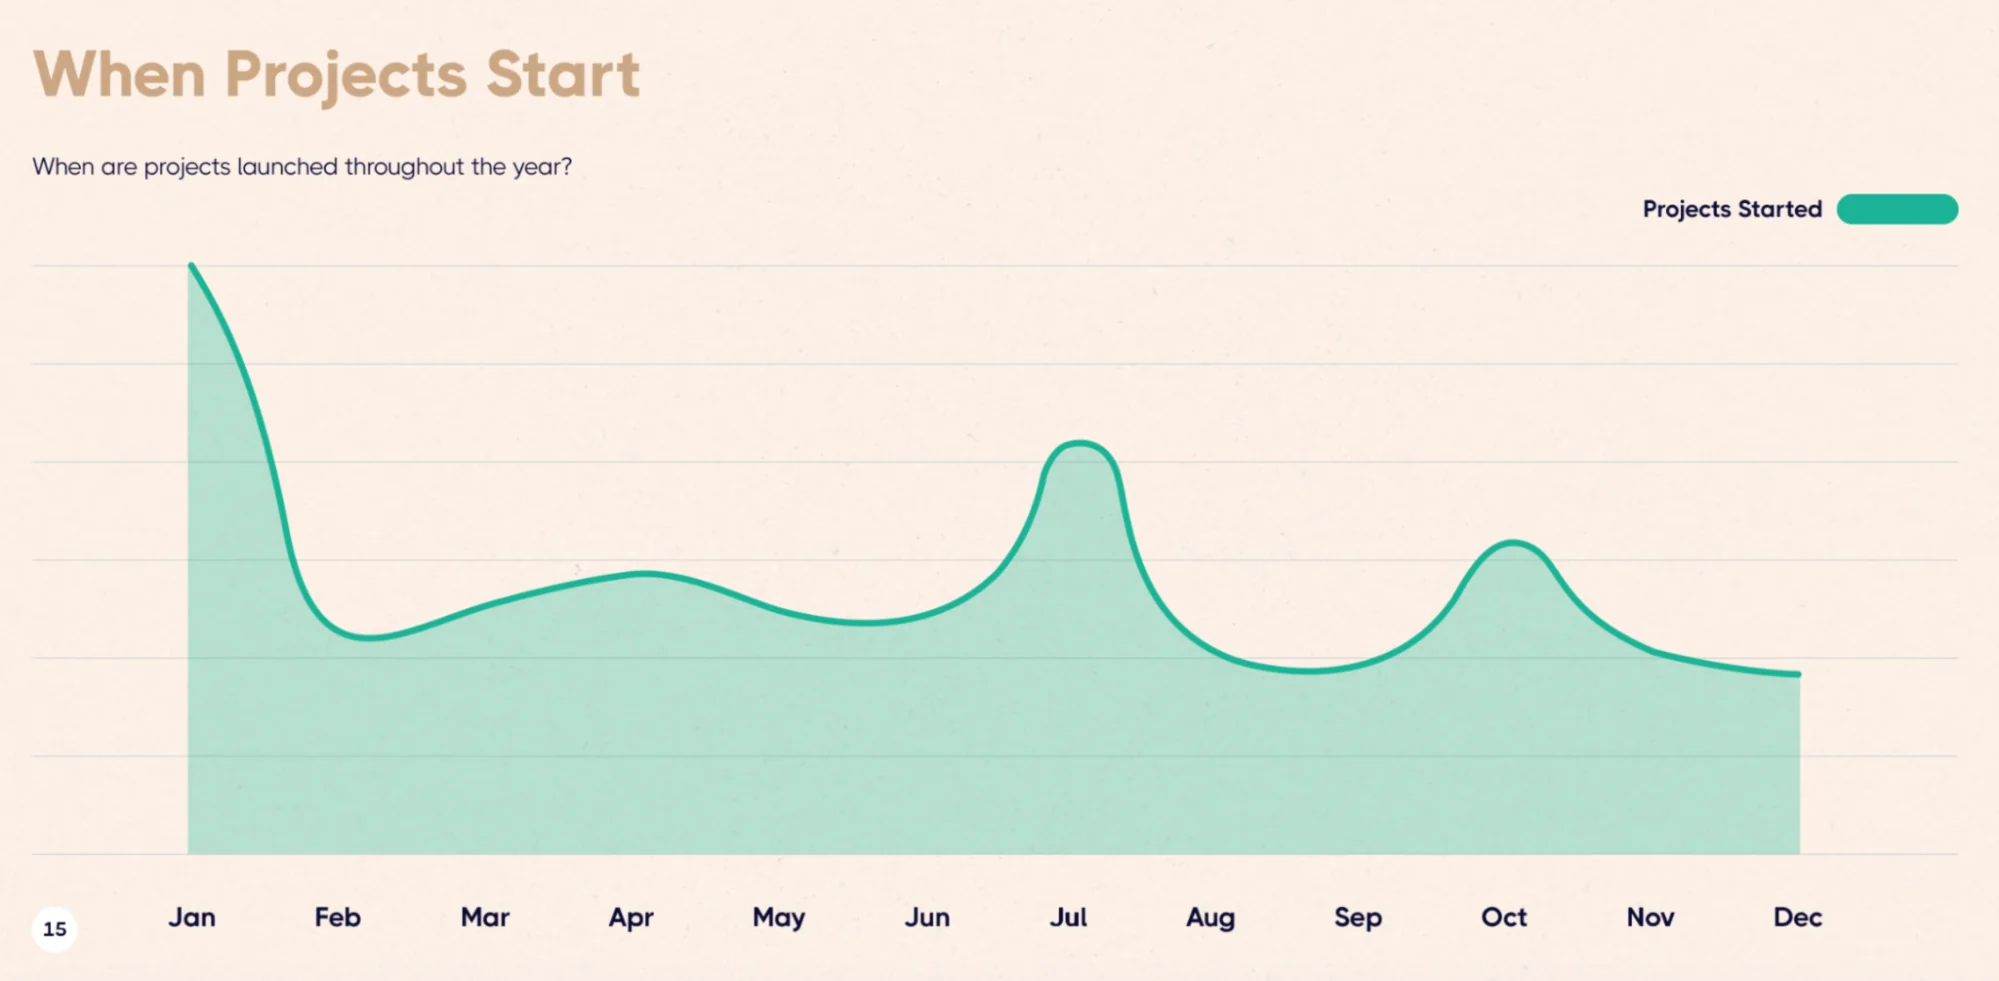
December continues this work. January launches projects—40,066 project starts, which is 8.5 times more than December and about 30% of all projects launched during the year.
But here's the surprising part:
February records the most updates at 2,045,105 changes to strategic plans—about 43.5% higher than August.
January is when organizations launch work. February is when they actually start executing it.
Think about what this means for planning cycles. Organizations that finish their planning in December and launch in January have a built-in two-month lag before they hit peak execution. That's two months of momentum lost.
<img src="https://cdn.prod.website-files.com/637e14518f6e3b2a5c392294/69493cb81ffff807f84987d2_optimize-your-strategic-planning-process-durham-north-carolina-logo.webp" alt="Official logo for the City of of Durham, North Carolina, featured as a case study for simplifying strategic initiatives and improving execution." width="86" height="131" align="right" />👉Real-life example:
<p style="padding-left: 30px;">The City of Durham, North Carolina recognized this and built their planning cycle accordingly. Under the leadership of Strategy and Performance Manager Shari Metcalfe and her team, Durham operates on a sophisticated three-year strategic planning cycle:</p>
<ul style="padding-left: 60px;">
<li>Year 1 (first 9 months): They create the citywide plan with consideration for long-term priorities.</li>
<li>Years 1-2: Departments execute business and fiscal plans.</li>
<li>Year 3: They conduct a deep evaluation of performance measures and identify improvement areas.</li>
</ul>
<p style="padding-left: 30px;">But the critical insight is they don't wait for January 1st to start execution work. Throughout their cycle, regular evaluations ensure continuous improvement rather than waiting for formal review periods.</p>
<p style="padding-left: 30px;">As Metcalfe notes: "A big turning point for our performance management was getting a system that we could use to manage all that data. It's just easier. Less time putting numbers in a system and more time actually looking at the numbers and making decisions based on those."</p>
The data also revealed two other project launch waves in July and October. Together with January, these three months account for about 55.6% of annual project starts.
If your planning process only contemplates a January launch, you're missing the mid-year and fall execution windows that keep momentum going.
<div class="index-cards"><div class="index-card"><div class="index-card-title">2 Ways To Optimize Your Planning Process</div><div class="index-card-content"><p>1) Don't just focus on when you <em>plan</em>—focus on when you <em>execute.</em> The best organizations blur the line between planning and execution, creating continuous cycles instead of discrete events.</p><p>2) Build planning cycles that anticipate multiple launch windows throughout the year, not just annual planning. Create a regular cadence where new strategic work can begin quarterly, keeping execution energy consistent.</p></div><div></div>
Insight #2: Your Team Is Either Too Big or Too Inactive (Probably Both)
Here's an uncomfortable finding about team structure: The average strategic plan has owners and collaborators assigned, but most of them aren't actually working on the strategy.
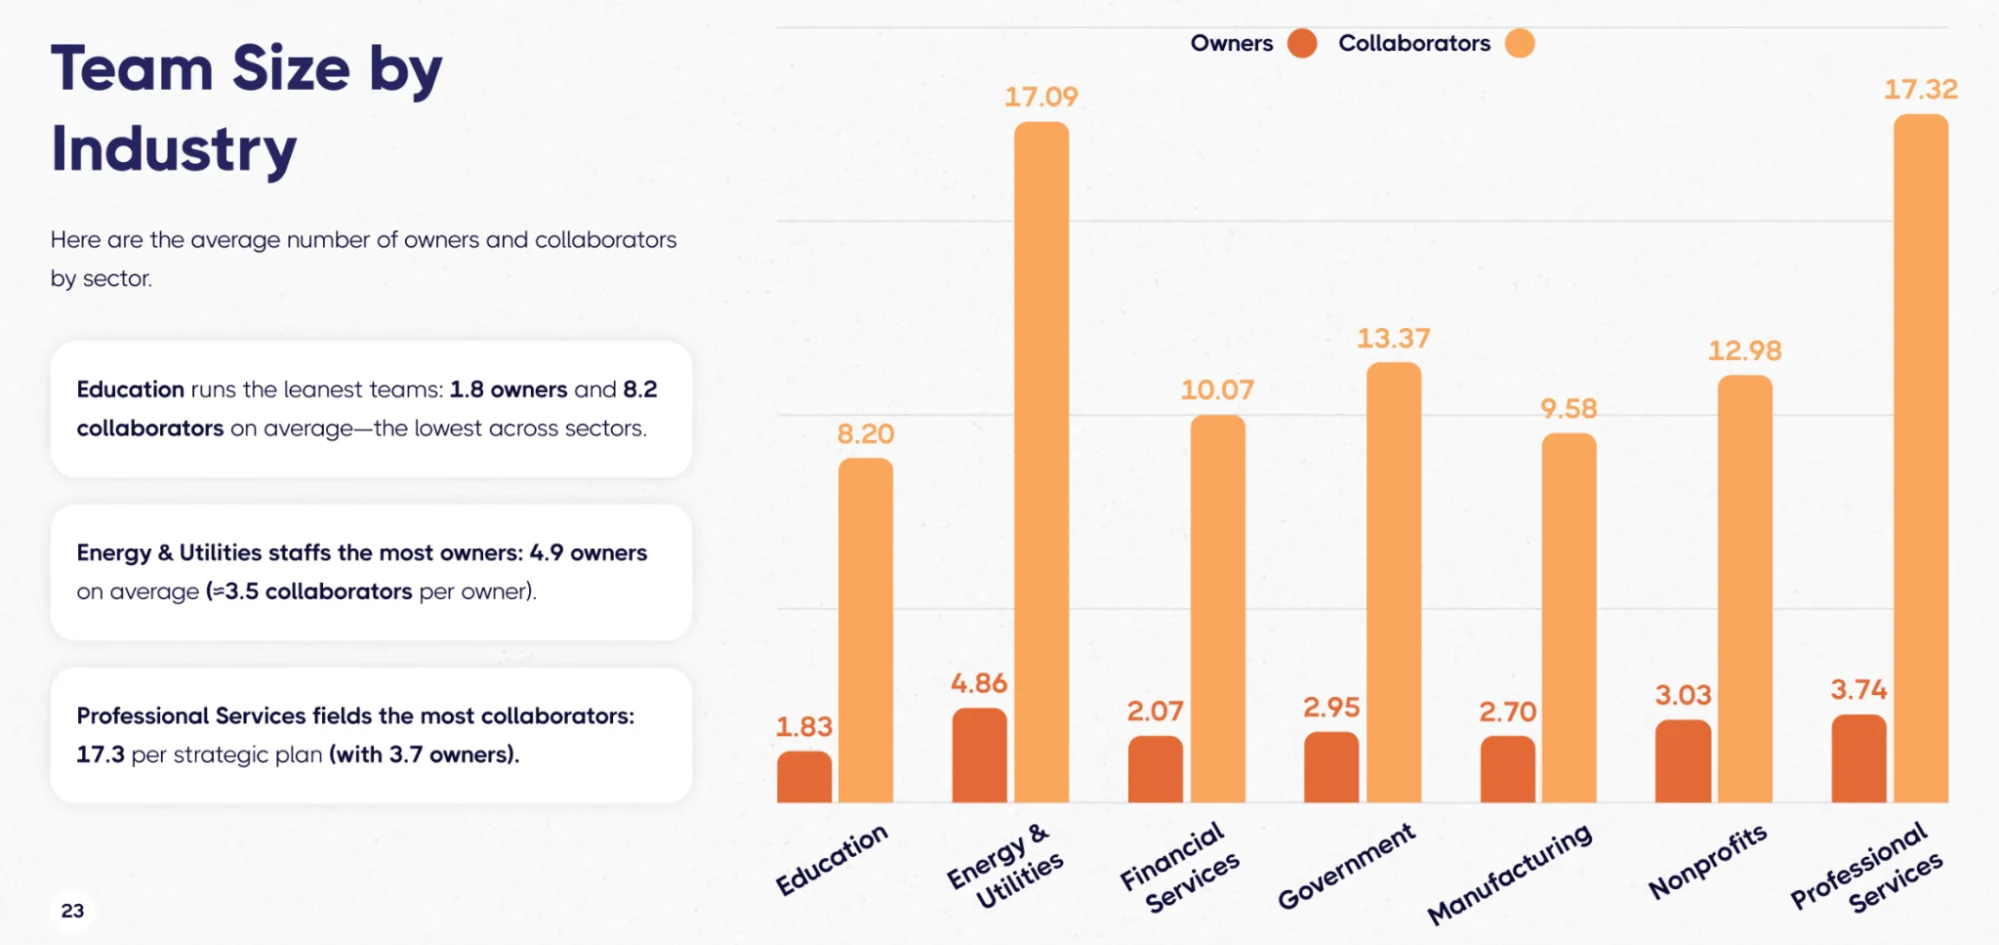
Looking at team size by industry:
- Education: 1.8 owners and 8.2 collaborators (leanest)
- Energy & Utilities: 4.9 owners (highest owner count)
- Professional Services: 17.3 collaborators with 3.7 owners (highest collaborator count)
At first glance, you might think bigger teams mean better coverage.
The data says otherwise.
Only 13.8% of assigned owners actually updated their work in the last 90 days. That means 86.2% of people listed as "owners" are inactive.
For every person actually doing strategic work, there are roughly 6.3 people whose names appear on the plan but who aren't engaged.
We call these "phantom owners"—and they're worse than having no owner at all.
At least when something is unowned, you know there's a gap. Phantom owners create the illusion of accountability where there is none.
👉Real-life example:
<p style="padding-left: 30px;"><img src="https://cdn.prod.website-files.com/637e14518f6e3b2a5c392294/6949426290f768413aff73a3_optimize-your-strategic-planning-process-carilion-clinic-logo.webp" alt="Official logo for Carilion Clinic, used as a real-life case study for successful performance management and ownership." width="300" height="54" align="right" />Carilion Clinic solved this problem systematically. When they developed their performance management system in 2007, they built it around real ownership from day one. They created scorecards not just for departments but for individual physicians and providers—linking compensation directly to patient-centered care outcomes.</p>
<p style="padding-left: 30px;">Darren Eversole, their Director of Finance, explains: "Everyone is rowing in the same direction, physicians and providers have control of their results as an individual, which contributes to the overall performance of the scorecard."</p>
<p style="padding-left: 30px;">The key phrase: "control of their results." Not visibility into results. Not awareness of results. Control.</p>
<p style="padding-left: 30px;">By the time we analyzed their approach, Carilion was managing around 300 scorecards through ClearPoint. The system scaled because ownership was real at every level. When someone's name appeared on a scorecard, they knew it, they owned it, and their compensation reflected their performance on it.</p>
<div class="index-cards"><div class="index-card"><div class="index-card-title">Optimize Your Team</div><div class="index-card-content"><p>Aim for lean pods of 10-16 people (owners plus collaborators) per major strategic initiative. Track activity religiously—anyone who hasn't updated in 90 days should be reassigned or removed. Make "% active owners" a visible metric that leadership reviews monthly.</p><p>Team size isn't the goal. Active engagement is.</p></div><div></div>
Insight #3: Project Duration Tells You More About Organizational Culture Than Project Complexity
One of the most revealing patterns in the data is how project duration changed over eight years.
In 2017, the median project ran 303 days. By 2020, that had dropped to just 163 days—a 46.4% reduction. Then in 2021-2022, duration began climbing again, stabilizing at 364 days by 2023-2024.

The natural assumption is that COVID forced organizations to move faster, then they reverted to "normal" once the crisis passed.
But I think something more interesting happened.
2020–2021 proved that organizations can compress timelines dramatically when they have to. Project duration got cut in half not because projects became simpler or less ambitious, but because urgency changed the culture. Meetings got shorter. Decisions got faster. Bureaucracy got bypassed.
The return to year-long timelines wasn't failure to sustain speed—it was a recognition that strategic transformation requires sustained effort. You can sprint for a few months. You can't sprint for years.
But here's the optimization insight: if your median project duration is 364 days, ask yourself whether you're building in buffer or actually doing strategic work.
👉Real-life example:
<p style="padding-left: 30px;"><img src="https://cdn.prod.website-files.com/637e14518f6e3b2a5c392294/6949451ecfc2778ea07687d3_optimize-your-strategic-planning-process-city-of-fort-lauderdale-logo.webp" alt="Official logo for the City of Fort Lauderdale, featured as a case study for simplifying strategic initiatives and improving execution." width="250" height="68" align="right" />Fort Lauderdale learned this through direct experience. When they launched "Press Play Fort Lauderdale" in 2013 with 12 goals, 38 objectives, 191 initiatives, and 142 KPIs, they discovered that having too many long-running initiatives created more paralysis than progress.</p>
<p style="padding-left: 30px;">Their management system—cross-departmental meetings with over 100 staff every two months—looked impressive on paper. In practice, it meant people sat through hours of updates on work that wasn't relevant to them.</p>
<p style="padding-left: 30px;">The breakthrough came when Kristin Tigner, their Structural Innovation Manager, advocated for "simplify, excel, and expand." Instead of 191 initiatives running simultaneously for years, they focused on fewer priorities with shorter cycles. Execute well. Expand to new areas. Repeat.</p>
<p style="padding-left: 30px;">The result wasn't faster execution—it was better execution. Projects that would have dragged on indefinitely got completed because focus was maintained.</p>
Here's what the data suggests: project duration should match the complexity of strategic change, not the length of your planning cycle. Some transformational initiatives genuinely need a year or more. But if everything takes exactly one year to complete, you're probably just scheduling to your calendar, not managing to outcomes.
<div class="index-cards"><div class="index-card"><div class="index-card-title">Optimize Your Project Lengths</div><div class="index-card-content"><p>Segment your strategic portfolio by expected duration. Some projects are 90-day sprints. Some are 180-day builds. Some are year-long transformations. Don't force everything into annual cycles just because that's when you do planning.</p><p>And borrow from that 2020–2021 lesson: When you need to move fast, you can. The question is whether you're willing to change the culture that creates artificial slowness.</p></div><div></div>
Insight #4: Measure Proliferation Is The Silent Killer of Strategic Clarity
Here's a pattern that shows up across industries: Organizations track far more measures than they act on.
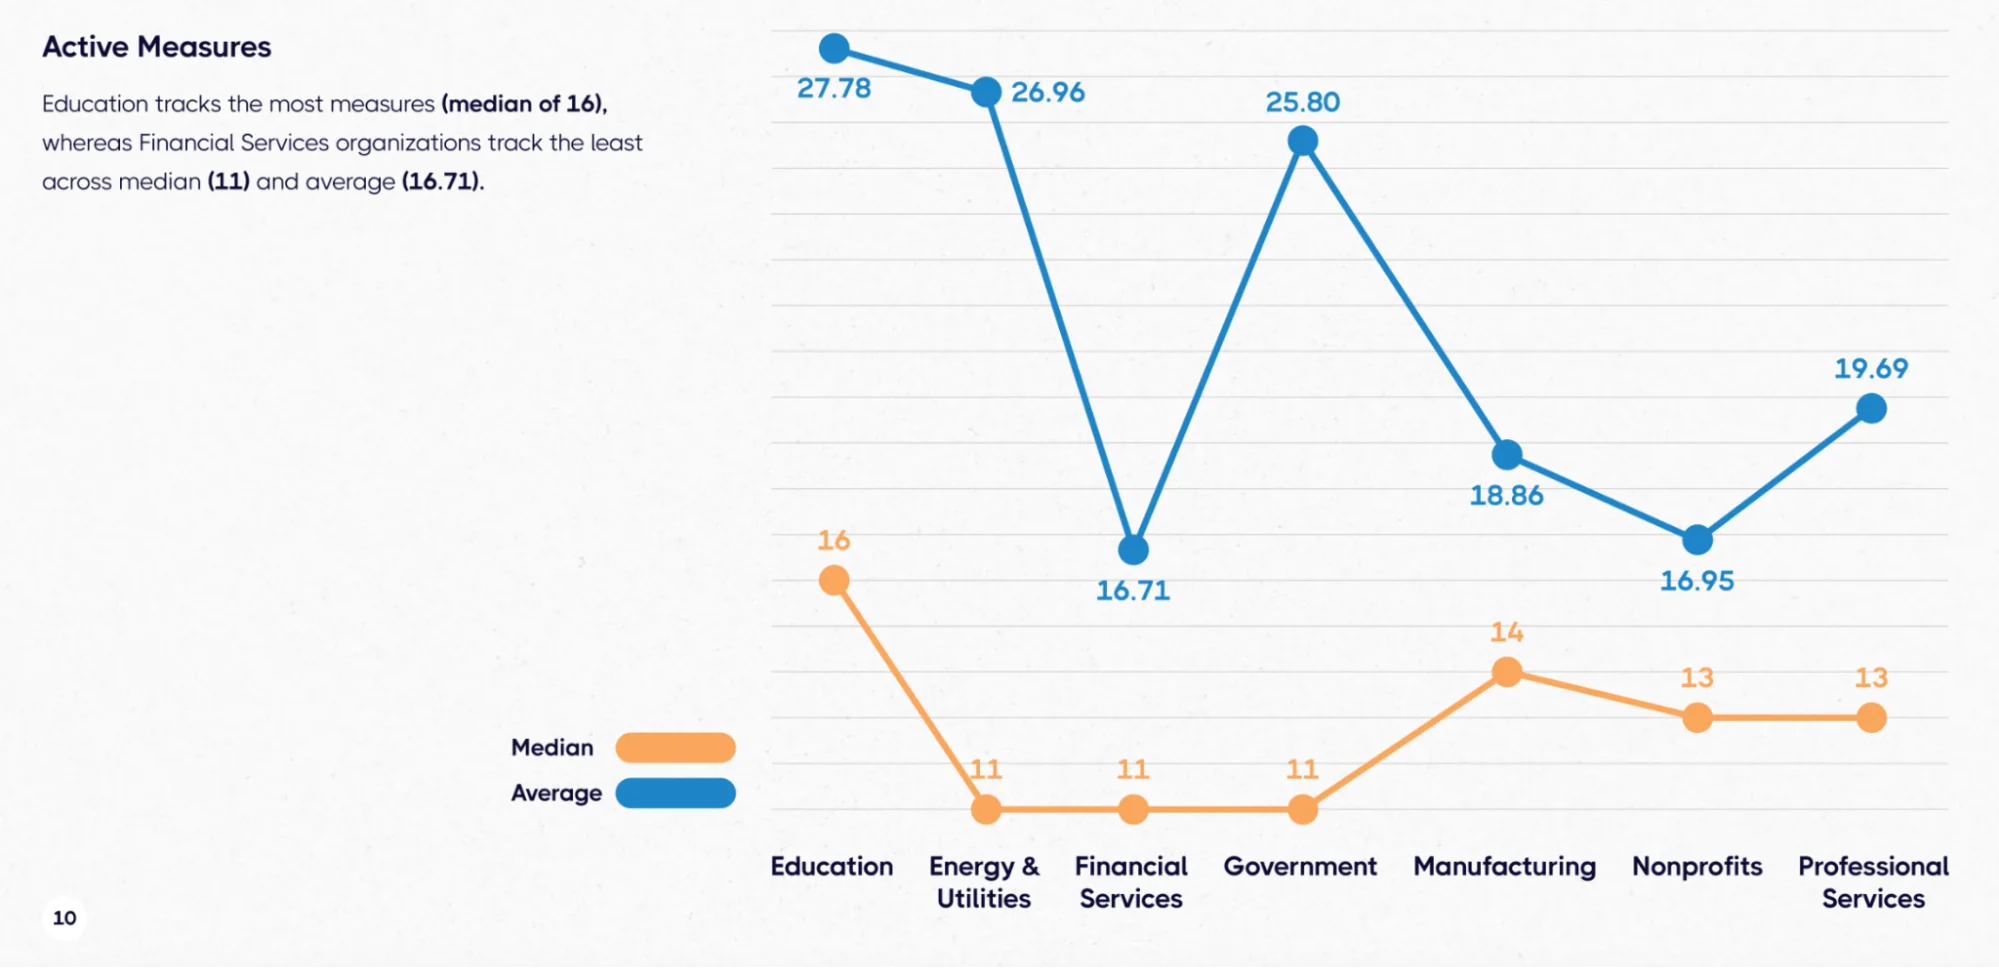
The median strategic plan tracks nine measures. But look at the averages:
- Healthcare: 22.92 measures per plan
- Education: 16 measures per plan (median)
- Manufacturing: Similar proliferation patterns
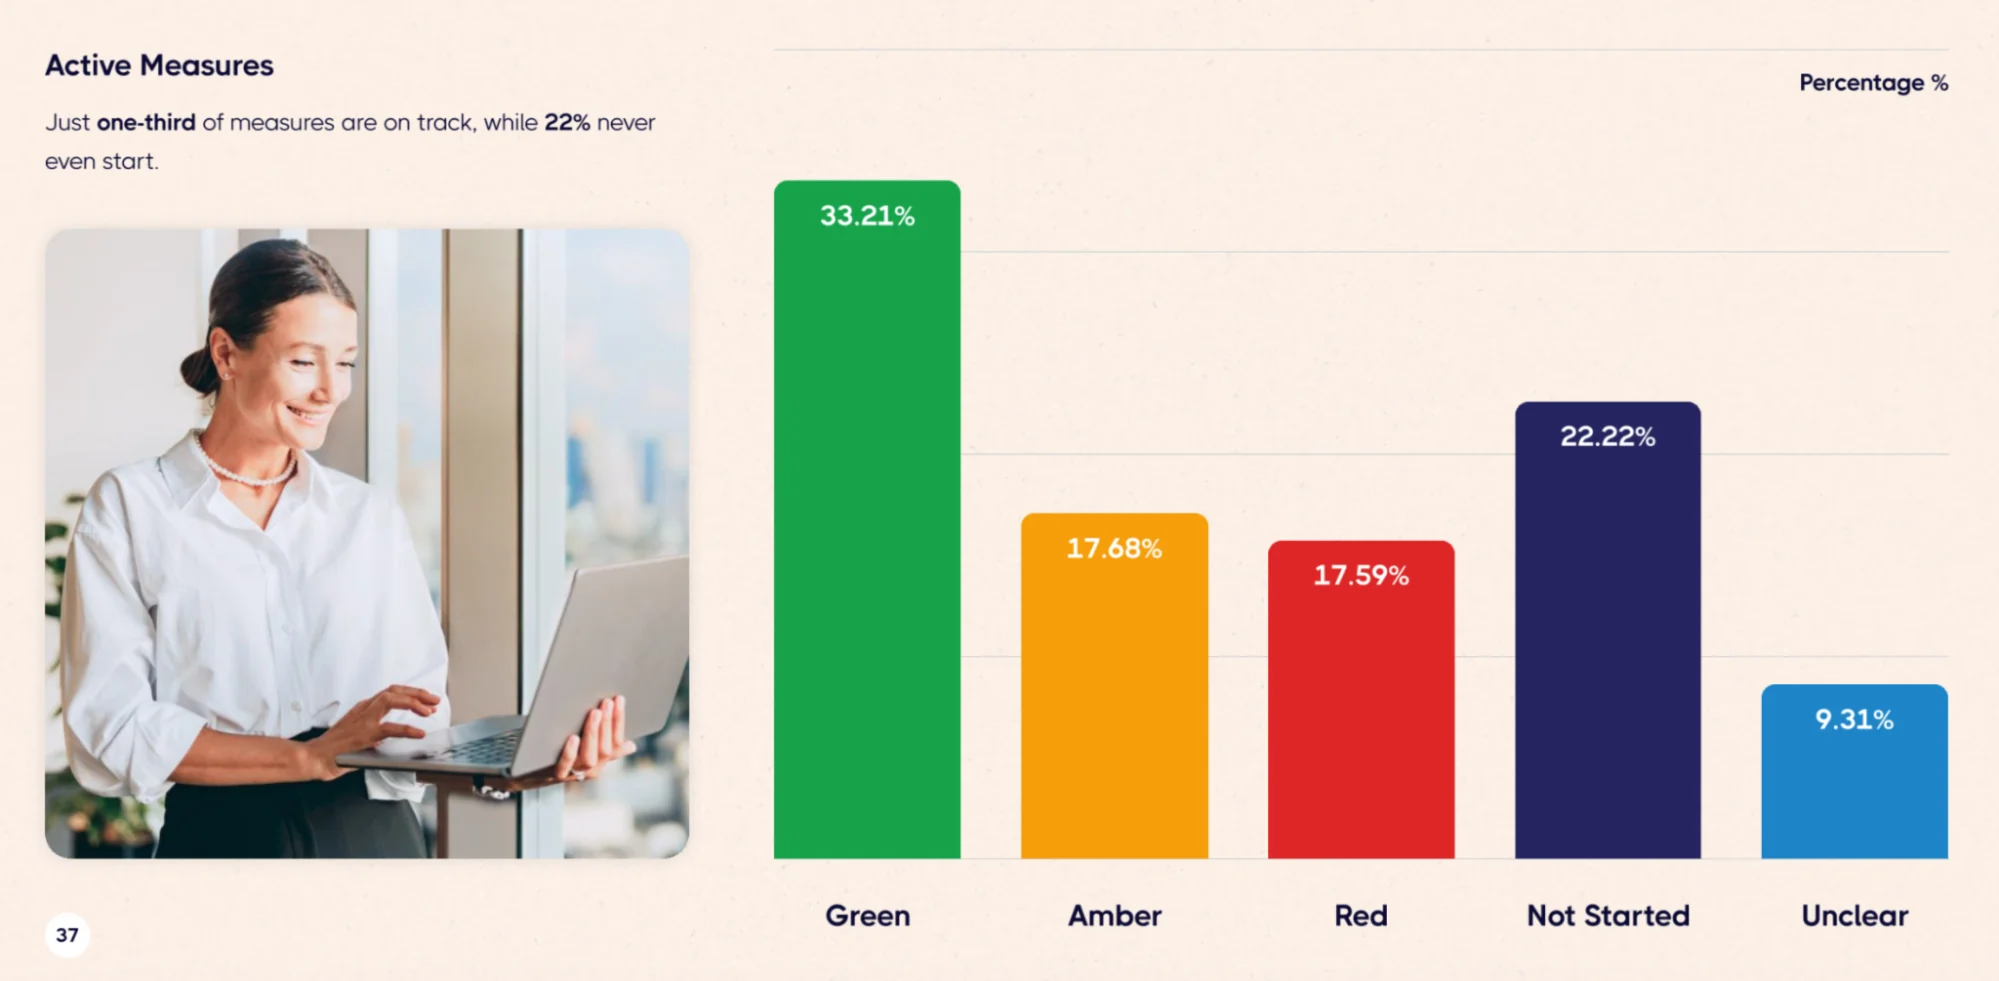
And then there's this: 22% of measures never even get started. Organizations set them up, assign them to the plan, and then... nothing. No data collected. No updates made. No decisions informed.
Even worse: 71% of measures have no owner assigned.
That means most of the metrics you're tracking aren't just inactive—they're orphaned.
This is what I call "measurement theater.” You have dashboards. You have KPIs. You have quarterly reports. But nobody's actually using the data to change behavior.
👉Real-life example:
<p style="padding-left: 30px;"><img src="https://cdn.prod.website-files.com/637e14518f6e3b2a5c392294/6949426290f768413aff73a3_optimize-your-strategic-planning-process-carilion-clinic-logo.webp" alt="Official logo for Carilion Clinic, used as a real-life case study for successful performance management and ownership." width="300" height="54" align="right" />Carilion Clinic avoided this trap by being ruthlessly selective about what they measure. When they expanded from leadership scorecards to provider scorecards to department scorecards, they didn't just add more metrics.</p>
<p style="padding-left: 30px;">They focused on measures that tied directly to their mission: "Improve the health of the communities we serve."</p>
<p style="padding-left: 30px;">For example, at the clinic level, they track metrics like:</p>
<ul style="padding-left: 60px;">
<li>"Time from scheduling to service for new patients"—a clear indicator of access to care that directly relates to community health</li>
<li>“Surgical site infection rate"—a safety metric for surgical departments that matters for patient outcomes</li>
</ul>
<p style="padding-left: 30px;">Each measure serves a purpose. Each has an owner. Each informs decisions.</p>
<p style="padding-left: 30px;">As Eversole notes, having around 300 scorecards works because they're not creating measurement for measurement's sake—they're tracking what matters at each level of the organization.</p>
JEA takes a similar approach with a clear separation: "Our day-to-day metrics live in internal systems, but anything related to our strategy lives in ClearPoint. It keeps things clean and eliminates confusion," explains Kendra Cash.
That distinction—operational metrics versus strategic metrics—prevents the proliferation that kills clarity. Not everything that can be measured deserves to be in your strategic plan.
The data shows the optimal range is 9-11 measures per strategic plan.
When you're significantly above that, you're either tracking too much detail or you haven't clearly defined what's strategic versus operational.
<div class="index-cards"><div class="index-card"><div class="index-card-title">Optimize Your Measurement</div><div class="index-card-content"><p>Audit your current measures. For each one, ask:</p><ul><li>Does this inform strategic decisions or just operational ones?</li><li>Does it have an active owner who updates it regularly?</li><li>Has it gone two quarters without data? (If yes, archive it)</li><li>Does it connect to one of your strategic goals?</li></ul><p>The standard should be about two measures per goal. Add a third only after two consecutive quarters of on-time reporting—proof that you can handle what you have before adding more.</p><p>And implement a ruthless archiving policy: Any measure that shows "Not Started" for two consecutive quarters gets removed from active tracking.</p><p>Less measurement = better decisions.</p></div><div></div>
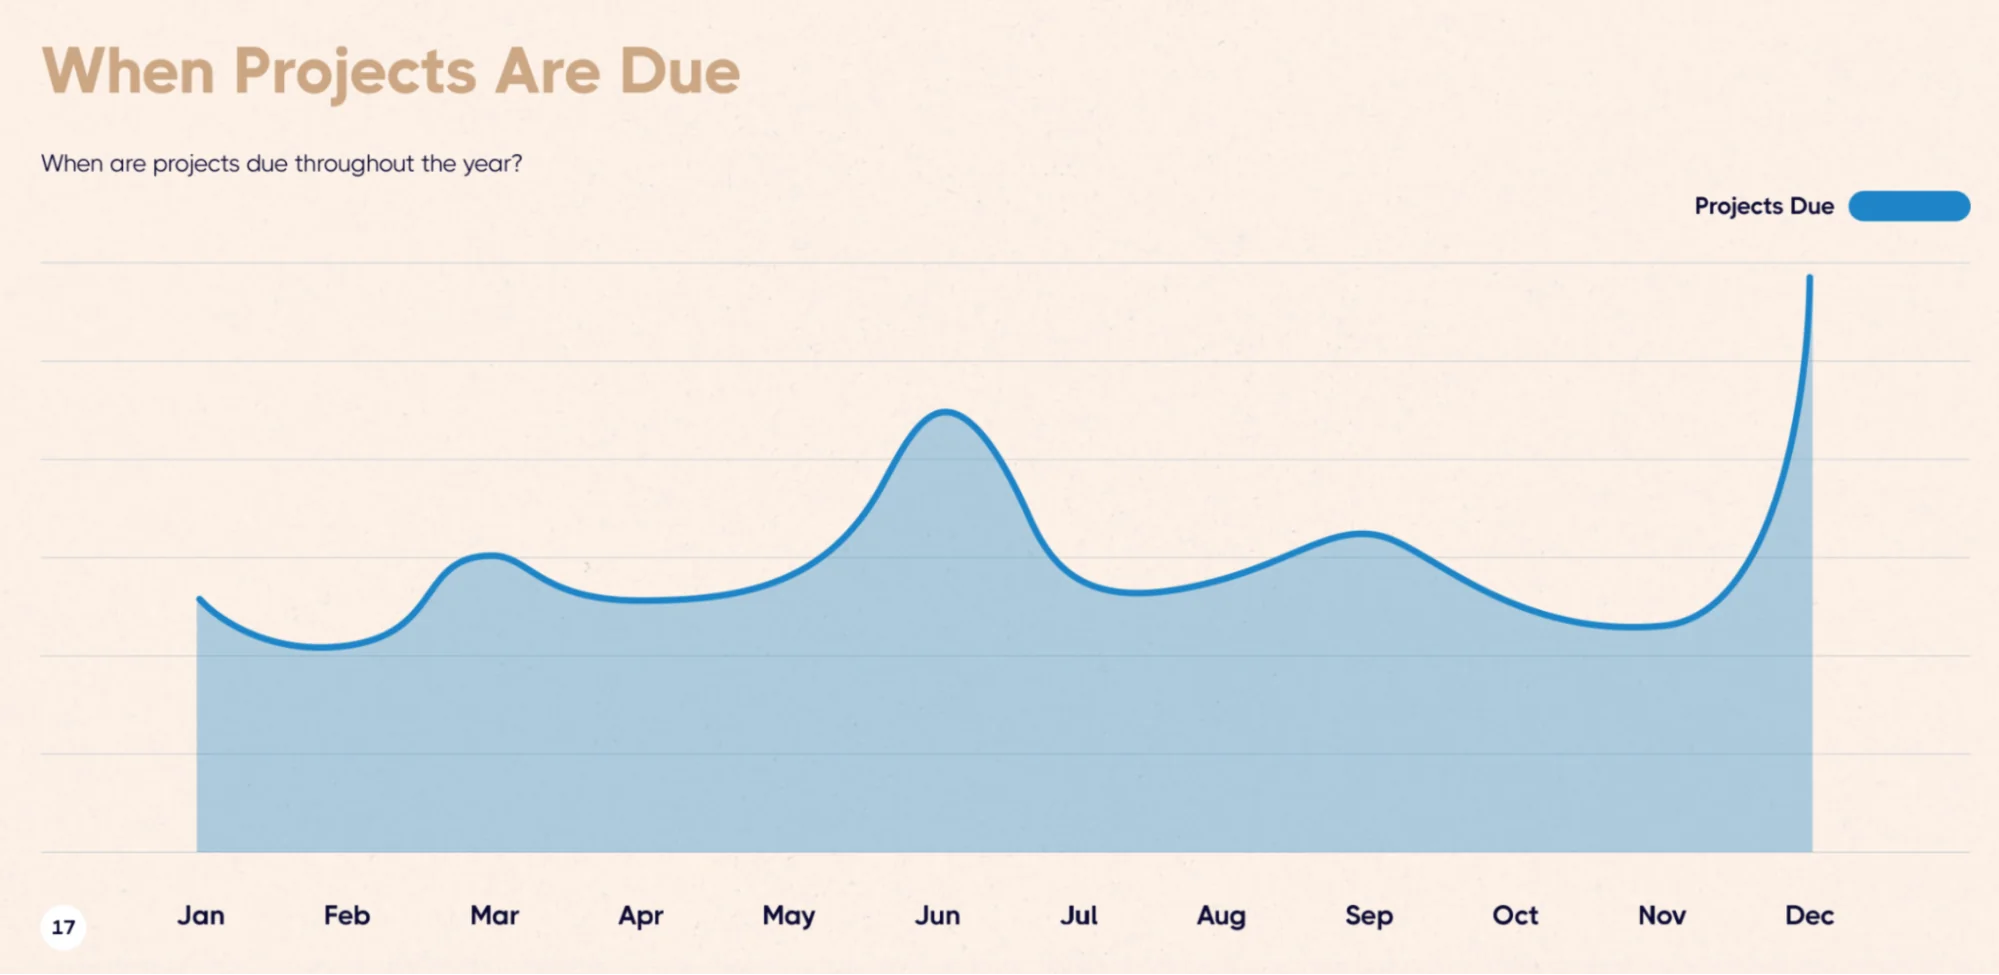
Insight #5: The Mid-Year Completion Surge Should Change How You Schedule Strategic Work
When we analyzed when projects actually finish, a clear pattern emerged: 29% of all projects have end dates in December, and 18% finish in June. Together, these two months account for nearly half (47%) of all project completions. No other month exceeds 10%.
Think about what this means operationally. If almost half your projects are due in two months, you're creating massive bottlenecks. Resources get stretched. Quality suffers. Projects that could succeed get delayed because everyone's underwater with year-end work.
Worse, this creates a feast-or-famine dynamic: intense pressure in December and June, relative calm the rest of the year.
That's not execution rhythm—that's execution whiplash.
👉Real-life example:
<p style="padding-left: 30px;"><img src="https://cdn.prod.website-files.com/637e14518f6e3b2a5c392294/69493cb81ffff807f84987d2_optimize-your-strategic-planning-process-durham-north-carolina-logo.webp" alt="Official logo for the City of of Durham, North Carolina, featured as a case study for simplifying strategic initiatives and improving execution." width="100" height="153" align="right" />Durham, North Carolina solved this by building regular evaluation cycles into their planning process. Instead of waiting for December to assess performance, they conduct ongoing evaluations throughout their three-year strategic cycle. This spreads the load and maintains continuous momentum.</p>
<p style="padding-left: 30px;">Jay Reinstein, their Strategic Plan Project Manager, summarizes the culture shift: "With data now driving decision making, it's all about results." Not about the annual review meeting. Not about the year-end scramble. Results, continuously.</p>
<p style="padding-left: 30px;">This regular cadence has practical benefits. Durham integrated performance data directly into budget decisions, resulting in $1.8 million in savings. That doesn't happen with once-a-year reviews—it happens when performance data is always available and always informing decisions.</p>
<p style="padding-left: 30px;">The fire department's request for fire-inspection software illustrates this. Rather than waiting for annual budget planning, they demonstrated strategic benefits through personnel cost reduction, improved data reliability, and increased revenue efficiency. The performance data supported the case and the decision got made.</p>
<div class="index-cards"><div class="index-card"><div class="index-card-title">Optimize Your Work Schedule</div><div class="index-card-content"><p>Set a guardrail that no single month should contain more than 15% of your planned project completions. If December or June exceed that threshold, you need to rebalance.</p><p>Pull work forward from year-end into Q2 and Q3. Create mid-quarter finish windows—say, mid-March, mid-September—that allow projects to complete without waiting for the artificial pressure of fiscal deadlines.</p><p>This requires a mindset shift. Most organizations schedule strategic work to their planning calendar: Annual plan means annual projects means December deadlines. But strategic work should be scheduled to optimize execution, not to match your budget cycle.</p></div><div></div>
What Successful Implementation Actually Looks Like
After analyzing patterns in 20,582 strategic plans, I can tell you what works. But data doesn't show the messy reality of implementation.
Durham's success didn't start in 2011 when they launched their first strategic plan—it started in 2014 when they admitted the first attempt hadn't worked. Most staff had reverted to Excel despite having strategic planning software. There was no clear ownership. People didn't understand how their data was being used.
The turnaround required creating a cross-functional team to completely reimagine their performance management structure. They went through another RFP process. They rebuilt their governance model. They invested in training and change management.
Three years from failure to success. That's the timeline nobody talks about in strategy presentations.
Fort Lauderdale's journey involved similar humility. Those early meetings with 100+ staff covering irrelevant topics? Those weren't a success—they were a learning experience. Kristin Tigner had to advocate for simplification when the organizational culture wanted comprehensiveness. That takes courage.
Carilion Clinic started in 2007. By the time we documented their success, they'd been refining their approach for over a decade. They studied "The Balanced Scorecard." They experimented with leadership scorecards. They expanded to provider scorecards. They learned which metrics mattered and which didn't.
Three hundred scorecards don't appear overnight. They emerge from years of systematic expansion, always focused on what serves the mission.
JEA's Kendra Cash manages a complex strategic planning system for 2,200 employees across a major utility. When asked what would make ClearPoint even better, she answered: "AI and deeper data integrations. That's where the future is."
In other words: even organizations executing at elite levels are still learning, still improving, still looking for ways to optimize.
The optimization insight: implementation is never finished. Durham continues evolving their process. Fort Lauderdale continues refining their focus. Carilion continues expanding their scorecard coverage. JEA continues integrating new data sources.
This isn't a "set it and forget it" process. Strategic planning is organizational learning. The only question is whether you're learning systematically or randomly.
The Benchmark That Actually Matters
Throughout this report, I've shared specific numbers: 9 measures, 8 projects, 364-day duration, 29% December completions, 13.8% active owners.
These benchmarks are useful for comparison. But there's really only one benchmark that matters:
Are you finishing what you start?
The data shows 83% of organizations complete less than 25% of their strategic projects. Meanwhile, 5.7% of organizations average 93% completion.
That gap—between planning and finishing—is the entire game.
The organizations we’ve mentioned above operate in different sectors with different constraints and different challenges. What they share isn't their context—it's their commitment to completion.
Robin Champ, our VP of Strategic Foresight, frames the opportunity:
"The top 5.7% of organizations average 93% completion, demonstrating that elite execution is possible, systematic, and institutional. Meanwhile, 83% of organizations complete less than 25% of their strategy—representing the largest untapped performance opportunity in business."
The largest untapped opportunity in business isn't in better planning. It's in better execution.
Every organization has strategic plans. Most have goals and measures and projects and timelines. The difference isn't in what you plan—it's in what you finish.
How To Use This Report
To begin optimizing your own strategic planning process, start with diagnosis before prescription. Use these five insights as diagnostic questions:
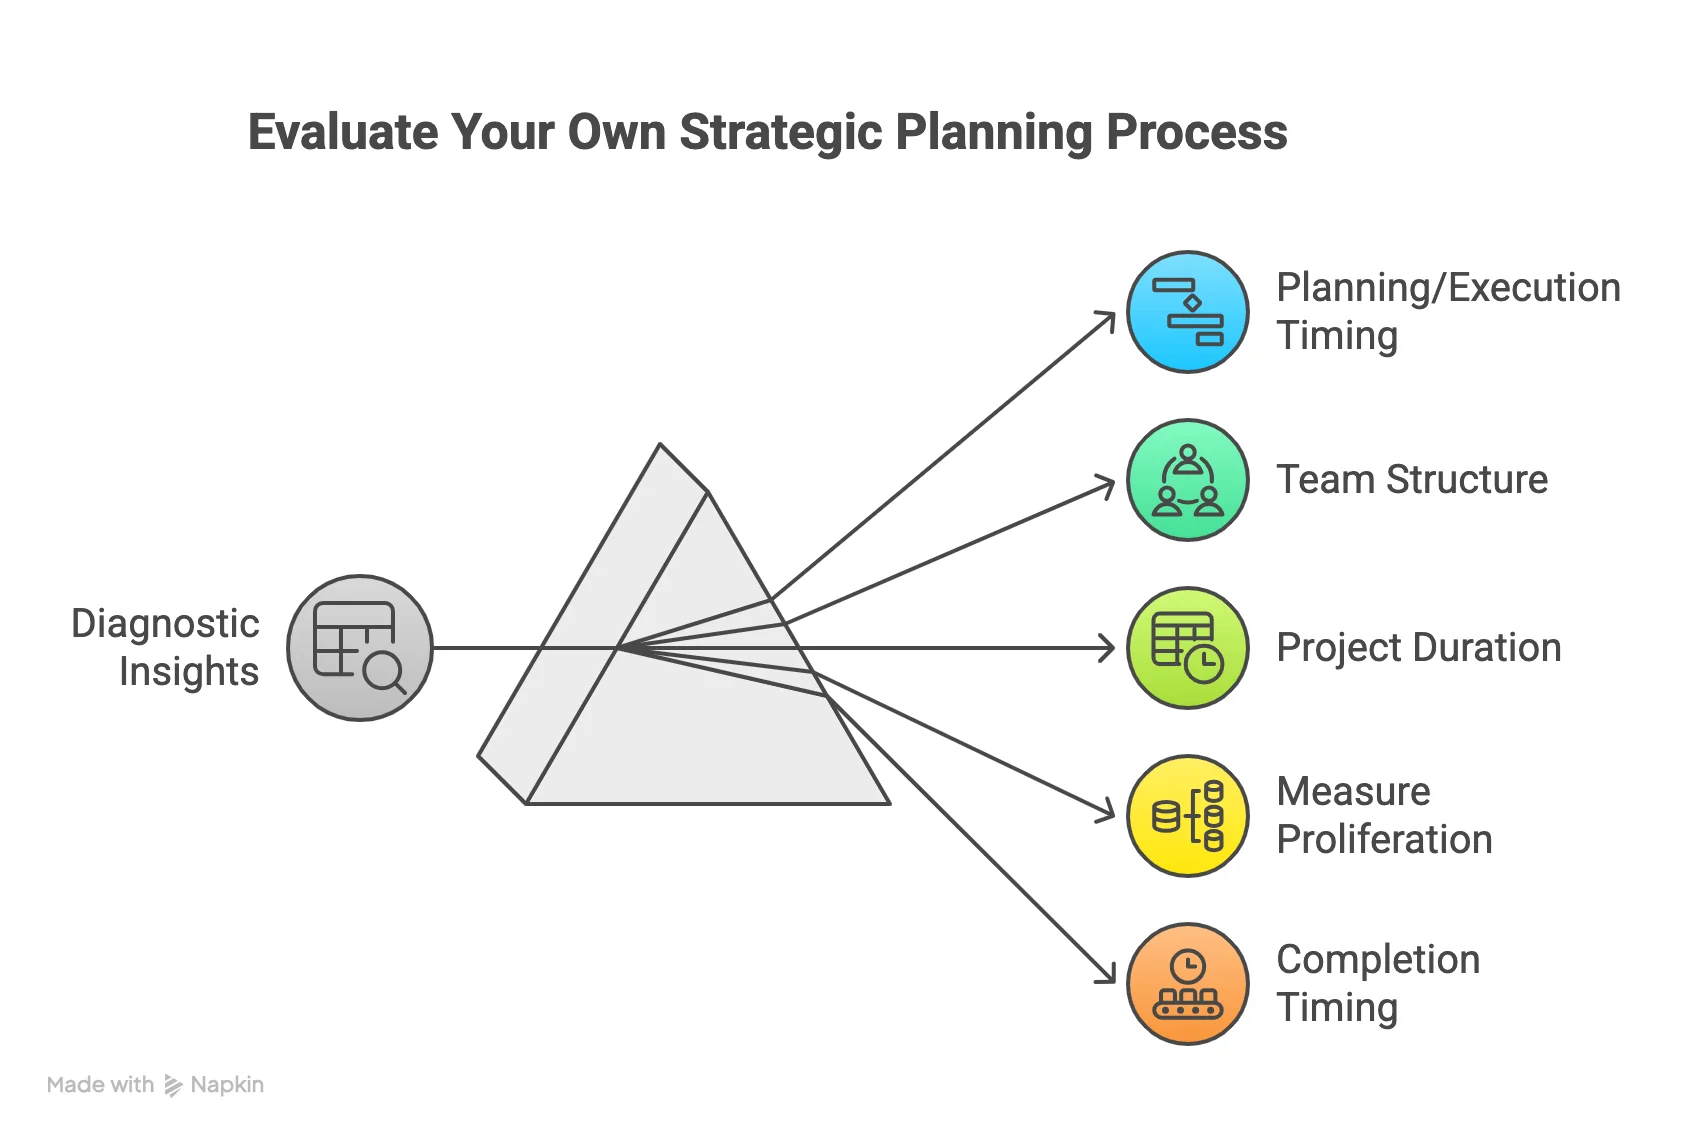
Insight #1 (Planning/Execution Timing):
- When do we launch most of our strategic projects?
- When does our execution actually peak?
- Are we creating a two-month lag between launch and execution?
- Do we have mid-year and fall launch windows, or just January?
Insight #2 (Team Structure):
- How many owners and collaborators do we have per strategic initiative?
- What percentage of assigned owners updated their work in the last 90 days?
- Are we above or below the 10-16 person optimal range?
- Do we track "% active owners" as a visible metric?
Insight #3 (Project Duration):
- What's our median project duration?
- Is everything taking exactly one year, or do we have varied timelines?
- Are we scheduling to our calendar or managing to outcomes?
- What would it take to compress 20% of our project timelines by 30%?
Insight #4 (Measure Proliferation):
- How many measures are we tracking per strategic plan?
- What percentage of measures have no owner?
- What percentage show "Not Started" for 2+ quarters?
- Do we have a clear separation between operational and strategic metrics?
Insight #5 (Completion Timing):
- What percentage of our projects finish in December? In June?
- Does any single month exceed 15% of our total completions?
- Could we pull work forward to create mid-quarter finish windows?
- Are we creating bottlenecks through our scheduling?
Answer these questions with data, not opinions. Pull reports. Count things. Calculate percentages. Look at your actual behavior, not your intended behavior.
Then pick one insight to optimize first. Don't try to fix everything simultaneously—that's how you end up with 191 initiatives and no focus.
Durham didn't transform overnight. Fort Lauderdale didn't simplify in a quarter. Carilion didn't build 300 scorecards in a year.
They improved systematically, learning from each cycle, building capability over time.
That's what optimization actually looks like: not transformation, but continuous improvement toward measurable outcomes.
The Question Behind The Data
After spending months analyzing 31 million rows of strategic planning data, I keep coming back to one question:
Why is there such a massive gap between organizations that execute well and everyone else?
It's not about resources. Durham operates in local government with all its constraints. Carilion competes in healthcare with all its complexity. JEA manages utility operations with all their regulation. These aren't organizations with unlimited budgets or ideal conditions.
It's not about industry. The top performers come from every sector. The bottom performers also come from every sector.
It's not about planning methodology. Whether you use Balanced Scorecard, OKRs, Hoshin Kanri, or something else doesn't predict success. We've seen every framework succeed and every framework fail.
What separates the elite from the average is something simpler and harder: discipline.
👉The discipline to keep your portfolio focused even when everything seems important.
👉The discipline to remove phantom owners even when it's politically uncomfortable.
👉The discipline to archive measures that aren't being used even when someone might want them someday.
👉The discipline to spread work throughout the year even when the calendar pushes everything to December.
👉The discipline to implement feedback loops that create continuous improvement rather than waiting for annual reviews.
Shari Metcalfe said it clearly: Durham's turning point was "getting a system that we could use to manage all that data. It's just easier. Less time putting numbers in a system and more time actually looking at the numbers and making decisions based on those."
Easier doesn't mean effortless. It means the right systems that enable disciplined execution.
The data in this report shows what works. Your job is to build the discipline to implement it.
That's what optimization really means: not finding the perfect plan, but executing your actual plan with systematic discipline.
The 5.7% who complete 93% of their projects aren't smarter or luckier than the 83% who complete less than 25%. They're just more disciplined about the fundamentals.
Which means the opportunity is sitting right in front of you. The data shows the path. The question is whether you'll walk it.