
![How Often Are Strategic Initiatives Completed? [DATA]](https://cdn.prod.website-files.com/637e14518f6e3b2a5c392294/694081943dbced2358f47d83_how-often-are-strategic-initiatives-completed-data-blog-header.webp)
![How Often Are Strategic Initiatives Completed? [DATA]](https://cdn.prod.website-files.com/637e14518f6e3b2a5c392294/688a2e9e7c35a603fab4b409_Dylan_Miyake_1.webp)
The answer may scare you, but it will also lead you to ask a different question—one whose answer reveals a world of possibility for your organization.
Here's the most important statistic in strategic planning:
- Across 130,324 projects tracked from 2017 to 2024, organizations completed only about 15 to 20% of strategic initiatives on average.
- Sector sets a baseline but not destiny: every industry contains organizations completing 90%+ and others under 10%.
- The single biggest predictor of completion is an active owner, yet 56.8% of projects have no assigned owner at all.
- The completion curve splits sharply: 83% of organizations finish under 25% of projects while 5.7% average 93%.
- Many incomplete projects never should have started; the fix is a completion culture, not more rigorous tracking.
<p style="text-align: center;"><strong>Across 130,324 projects tracked from 2017 to 2024, the average completion rate hovers around 15–20%.</strong></p>
That means four out of five strategic initiatives never get finished.
Think about the implications. Organizations spend months planning. They allocate budgets. They assign teams. They set deadlines. They create governance structures. They hold kickoff meetings.
And then 80% of the work just... doesn't happen.
But here's what makes the data interesting: Completion rates aren't consistent. They vary dramatically by year, by industry, and most importantly, by organization.
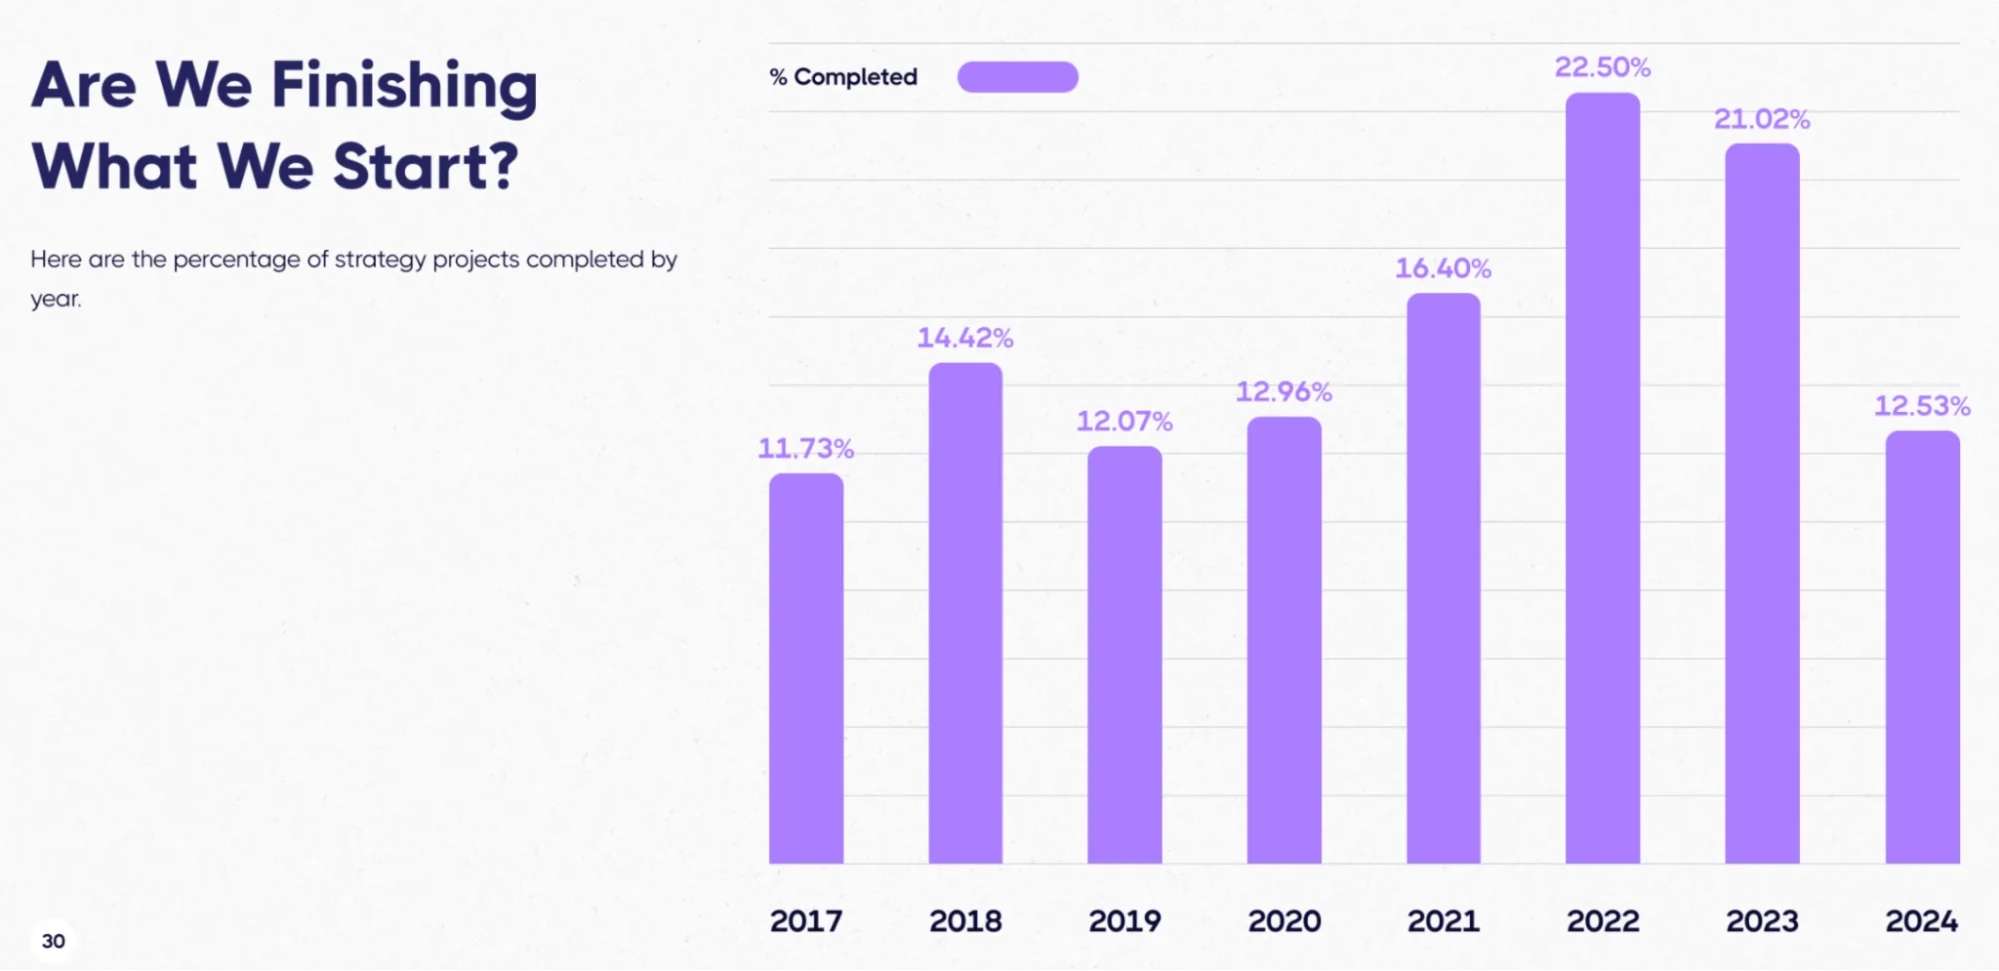
In 2022 and 2023, completion rates peaked above 20%. By 2024, they'd dropped below 13%. Energy & utilities companies complete 25.81% of projects while nonprofits finish just 5.29%.
And then there's the elite 5.7% of organizations that complete 93% of everything they start.
So the real question isn't "How often are strategic initiatives completed?" It’s "Why do some organizations finish while others don't?"
After analyzing eight years of data, the answer is clearer than you might expect.
The Great Crisis Bump: What 2020–2023 Revealed
When COVID hit in 2020, something unexpected happened to strategic execution: Completion rates didn't collapse—they climbed.
From 2020 through 2022–2023, organizations finished projects at rates we hadn't seen before in our dataset. The peak came in 2022–2023 when completion rates exceeded 20%—nearly double the 2017 baseline.
Then in 2024, rates dropped sharply to below 13%.
What happened? The conventional explanation is that organizations got distracted returning to "normal" operations. But I think something more interesting occurred: The crisis created temporary discipline that organizations failed to institutionalize.
During COVID, meetings got shorter. Decision-making got faster. Bureaucracy got bypassed. Projects that would normally take a year were compressed into months. Not because the work got simpler but because urgency changed behavior.
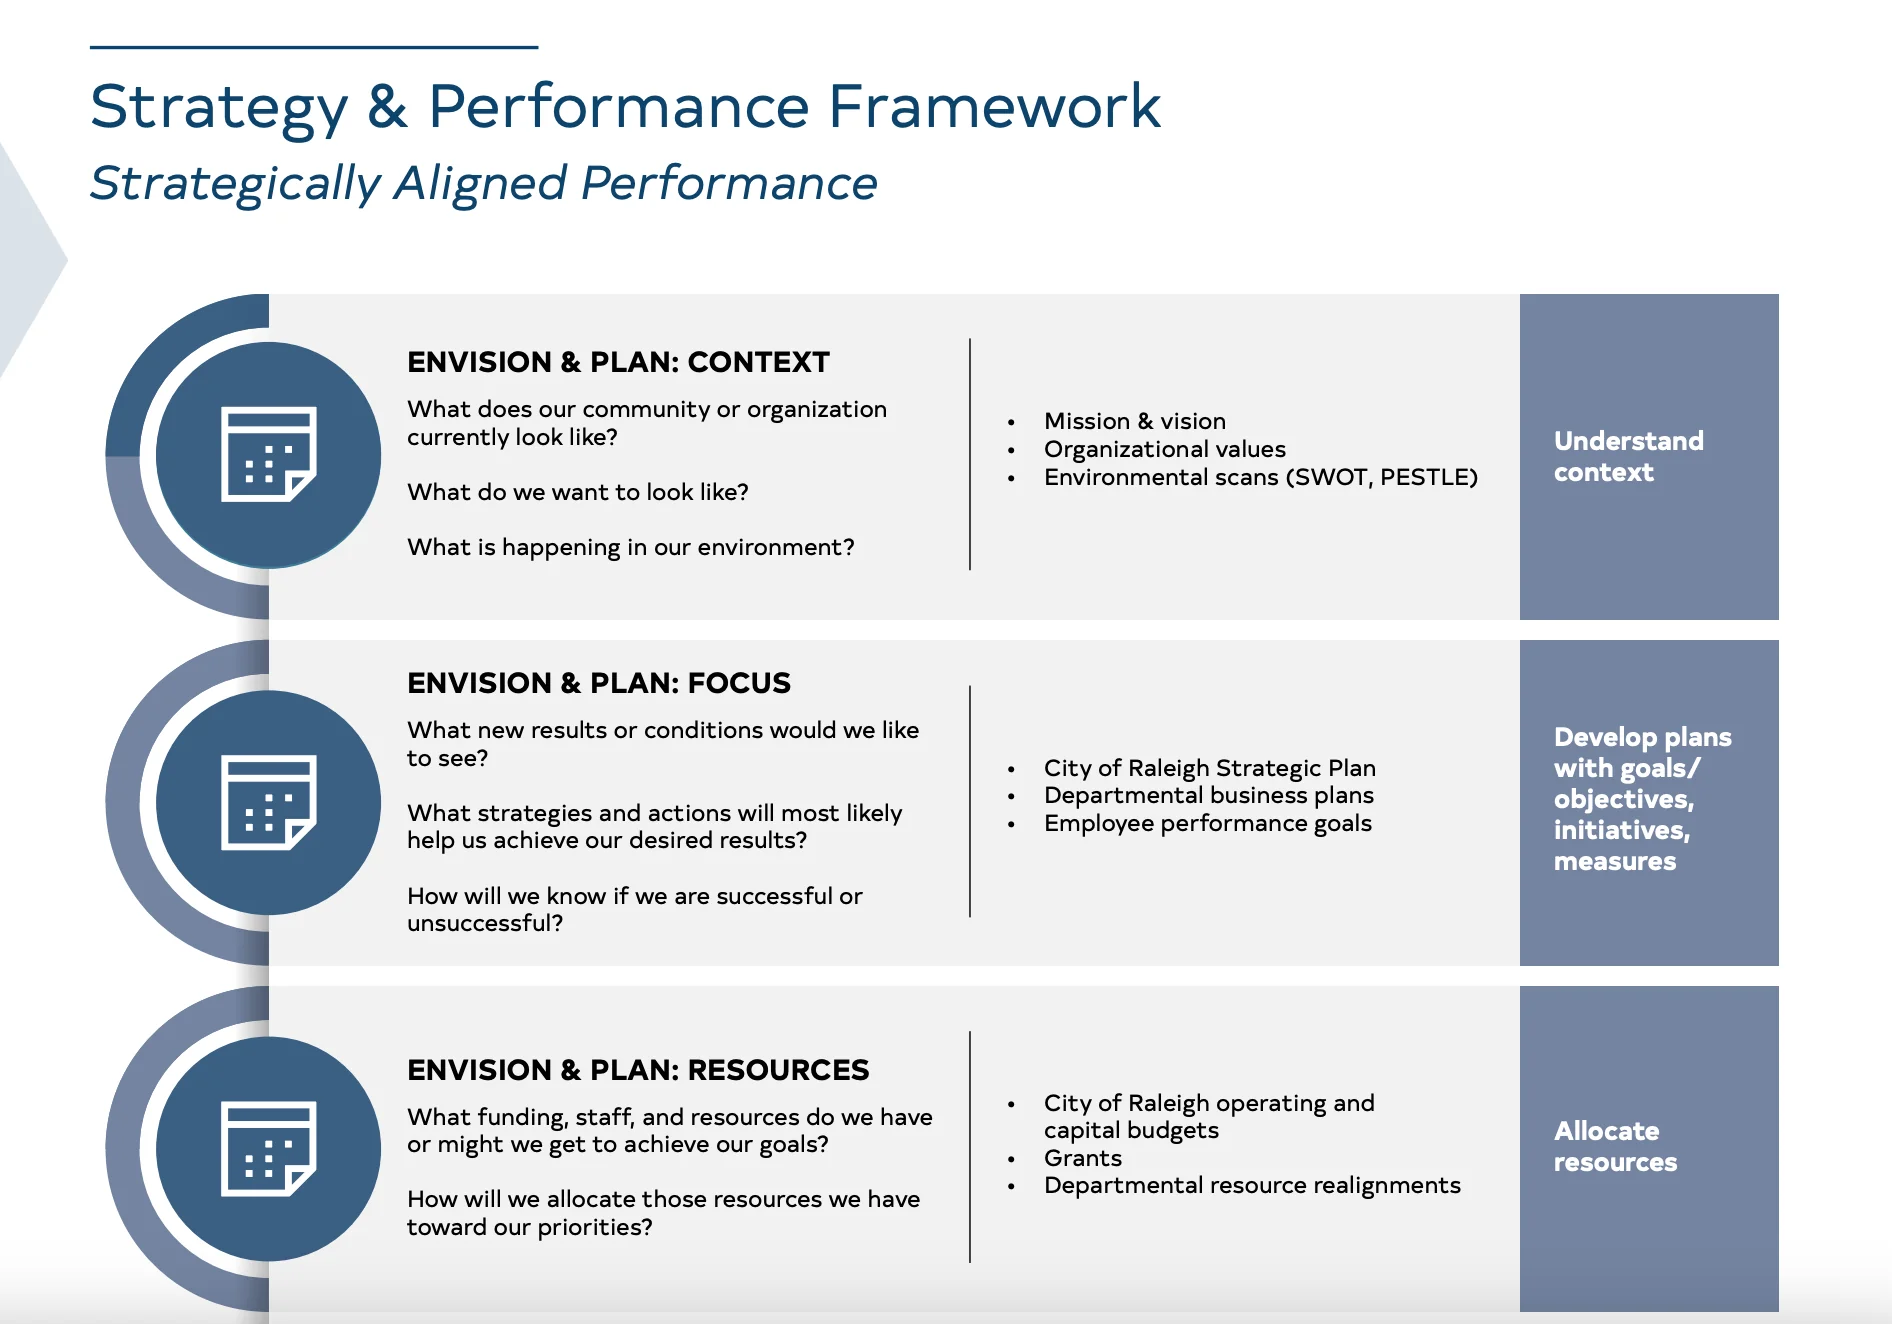
The City of Raleigh, North Carolina saw this firsthand. Before the pandemic, they had built a strategic framework called "Envision. Enact. Evaluate. Engage." Crisis execution forced them to accelerate every phase of that cycle.
During the crisis, departments couldn't waste time on initiatives that didn't matter. The urgency created natural selection and only essential work survived. And essential work got finished because delay wasn't an option.
But as the crisis faded, so did urgency.
By 2024, organizations had reverted to pre-crisis behaviors: longer timelines, more meetings, slower decisions. The result? Completion rates dropped to levels below even 2017.
The lesson isn't that organizations need constant crises. The lesson is that the crisis revealed what's possible when execution discipline actually matters. Organizations that maintained higher completion rates after 2023 were the ones that institutionalized the crisis behaviors rather than treating them as temporary exceptions.
They kept the shorter meetings. They kept the faster decisions. They kept the ruthless focus on essential work. They just removed the panic.
That's the difference between crisis execution and disciplined execution: One happens because you have no choice. The other happens because you've built systems that make execution the default.
Organizations that maintained higher completion rates after 2023 were the ones that institutionalized the crisis behaviors rather than treating them as temporary exceptions.
Industry Matters Less Than You Think (But More Than Nothing)
Energy & utilities companies complete 25.81% of their strategic projects. Nonprofits complete 5.29%.
That's nearly a 5× difference.

On the surface, this looks like industry determines completion rates. But when you dig deeper, the story is more nuanced.
Yes, the energy & utilities sector has structural advantages. Their work often involves regulated infrastructure projects with clear timelines and external accountability. When you commit to building a power substation or upgrading a water treatment facility, you can't just let it slide.
But even with these advantages, this sector is only completing about a quarter of strategic projects. Three-quarters still don't get finished.
Newsflash: Sector isn’t the determining factor.
The bigger insight comes from looking at the variation within industries.
In every sector we analyzed, there are organizations completing 90%+ of their projects and organizations completing less than 10%. Industry sets a baseline, but organizational discipline determines outcomes.
Raleigh operates in local government, which is typically not considered a high-completion industry. Yet they've built systematic approaches to ensure projects actually finish:
- They run CORStat (City of Raleigh Statistics) meetings that provide a forum for discussing citywide performance measures and initiative progress. These aren't status update meetings; they're problem-solving sessions where cross-departmental teams identify and remove blockers.
- They also run a Strategic Planning and Performance Analytics Academy that has covered over 20 topics in three years while reaching 100% of city departments. This isn't about teaching people how to plan better—it's about building organizational capacity to execute.
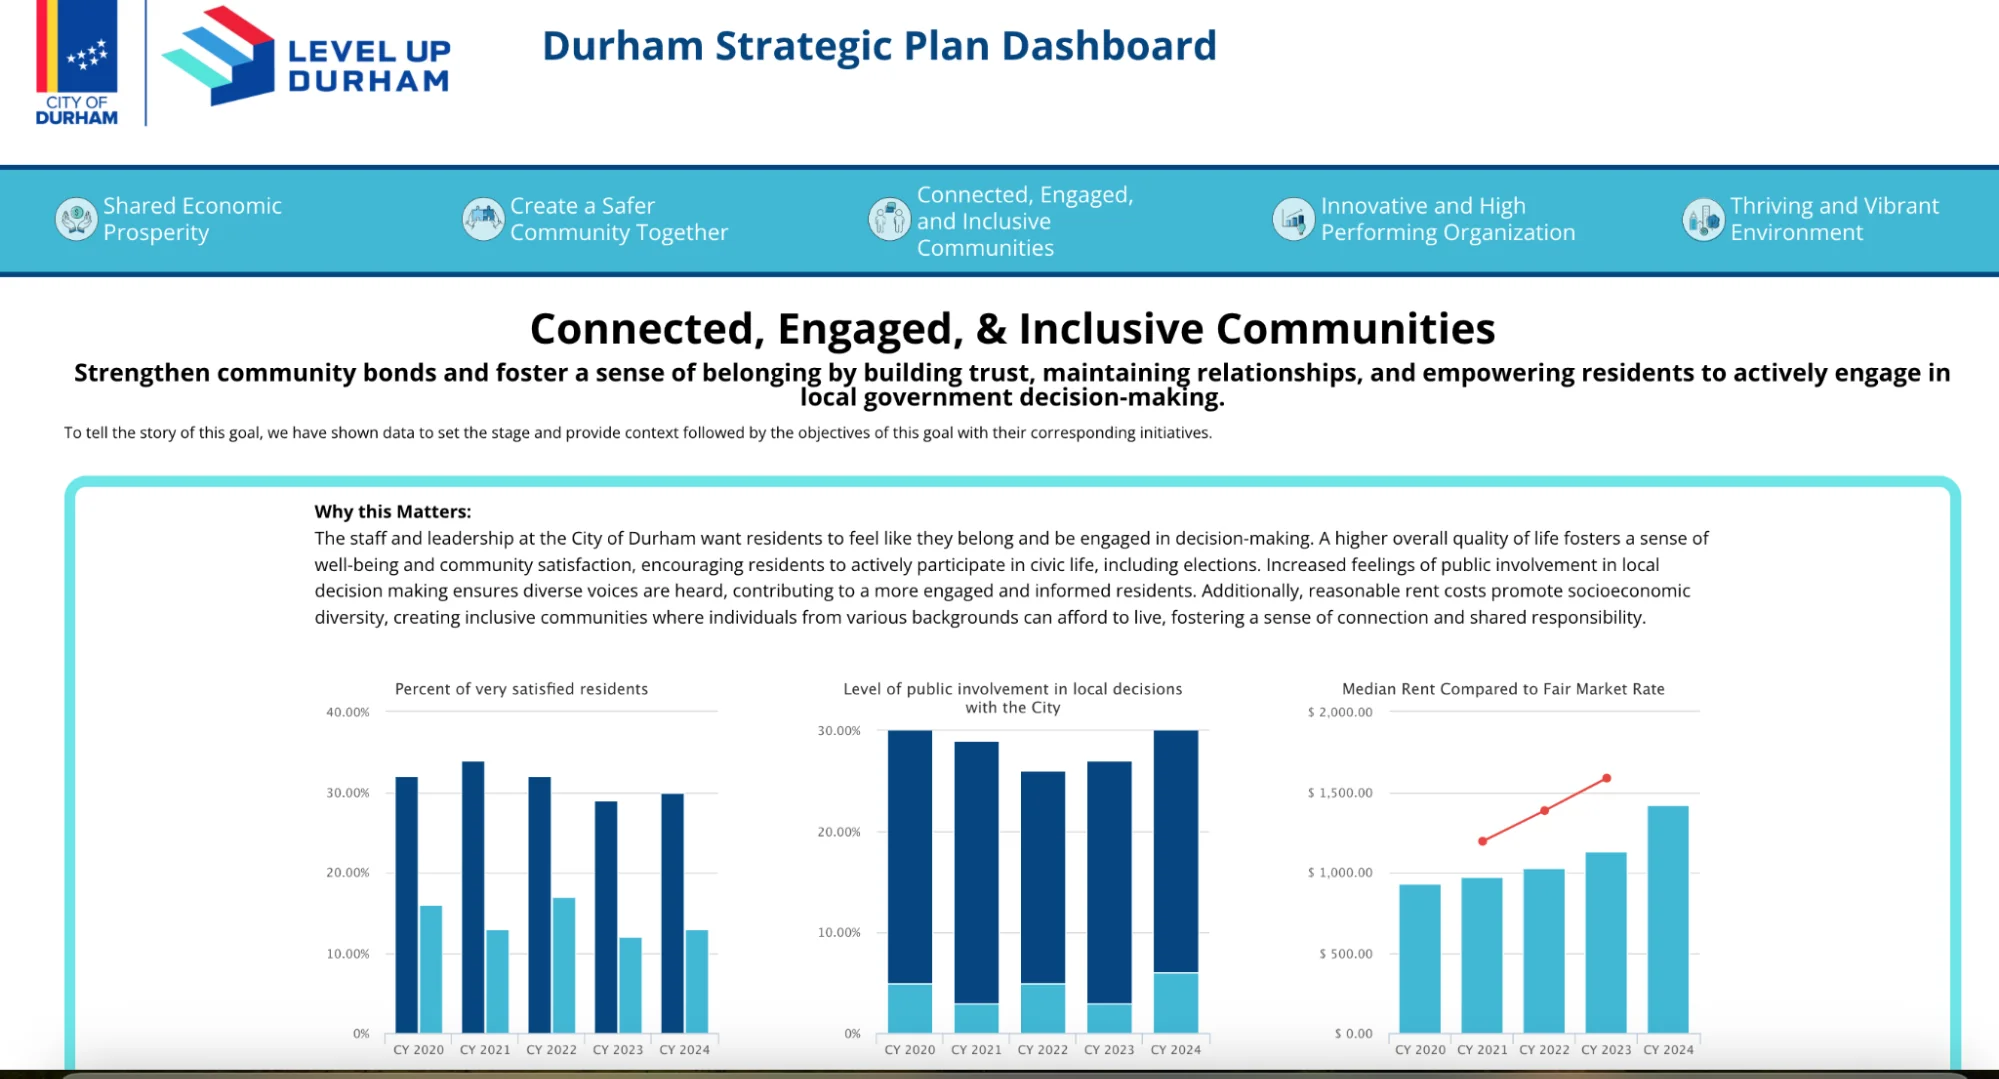
Durham County, North Carolina—also in local government—has maintained high completion rates through unprecedented cooperation between city and county governments.
Both entities use ClearPoint, enabling instant data sharing and coordinated efforts. This partnership has produced six joint initiatives, all completed, including a CPR defibrillator training program that has trained over 1,700 Durham Public Schools students.
Notice what these government organizations have in common: They don't accept their industry as an excuse. They build systems that make completion predictable rather than aspirational.
The pattern holds across sectors.
👉JEA completes projects in utilities.
👉Carilion completes projects in healthcare.
👉Fort Lauderdale completes projects in local government.
👉Germantown completes projects and wins Baldrige Awards.
Industry influences your starting point. Organizational discipline determines your endpoint.
The December Problem: When Everything Is Due At Once
Remember that 29% of all projects have end dates in December? Here's what that statistic means for completion rates.
When almost a third of your strategic portfolio is due in the same month, you're not creating a finishing sprint—you're creating a bottleneck that guarantees incompletion. Resources get stretched. Attention gets divided. Projects that could succeed if they had focus get deprioritized because 10 other projects are also due.
The data shows a clear pattern: Organizations with smoother completion calendars have higher overall completion rates.
Fort Collins, Colorado recognized this problem early. When they shifted from tracking 400+ metrics to their Strategy Map approach (Metrics, Analysis, Performance), they also restructured how they scheduled strategic work.
They moved away from annual reviews focused on year-end deadlines toward quarterly strategic reviews focused on outcomes. This created natural completion windows throughout the year rather than artificial pressure at fiscal boundaries.
The result? Projects could be completed when they were actually done, not when the calendar said they should be done.
This may sound like a small change, but it fundamentally alters execution dynamics.
When projects can complete in March, June, September, or December based on actual readiness, teams maintain steady execution pressure. When everything must complete in December, teams delay work until Q4, then scramble to finish everything simultaneously.
Raleigh implements similar calendar discipline through its "Envision. Enact. Evaluate. Engage." framework. The "Enact" phase doesn't wait for January 1st—it begins as soon as planning creates clarity. The "Evaluate" phase doesn't wait for year-end—it happens quarterly through CORStat meetings.
This continuous cycle prevents the December pile-up. Projects launch when they're ready to launch. Projects complete when they're ready to complete. And the organization maintains consistent execution momentum rather than boom-and-bust cycles.
<div class="index-cards"><div class="index-card"><div class="index-card-title">Optimize Your Timetable</div><div class="index-card-content"><p>If any single month contains more than 15% of your planned completions, rebalance. Pull work forward. Create mid-quarter finish windows. Spread the load.</p>
<p>Organizations that do this consistently show 15–20% higher completion rates than organizations that cluster everything at fiscal boundaries.</p></div><div></div>
When almost a third of your strategic portfolio is due in the same month, you're not creating a finishing sprint—you're creating a bottleneck that guarantees incompletion.
The Ownership Gap: Why 86% Of Assigned Owners Don't Actually Own Anything
The single biggest predictor of whether a project completes isn't the quality of the plan.
It's whether the project has an active owner.
Our data shows 56.8% of projects have no assigned owner at all. Even worse, among projects that do have assigned owners, only 13.8% of those owners have updated their work in the last 90 days.
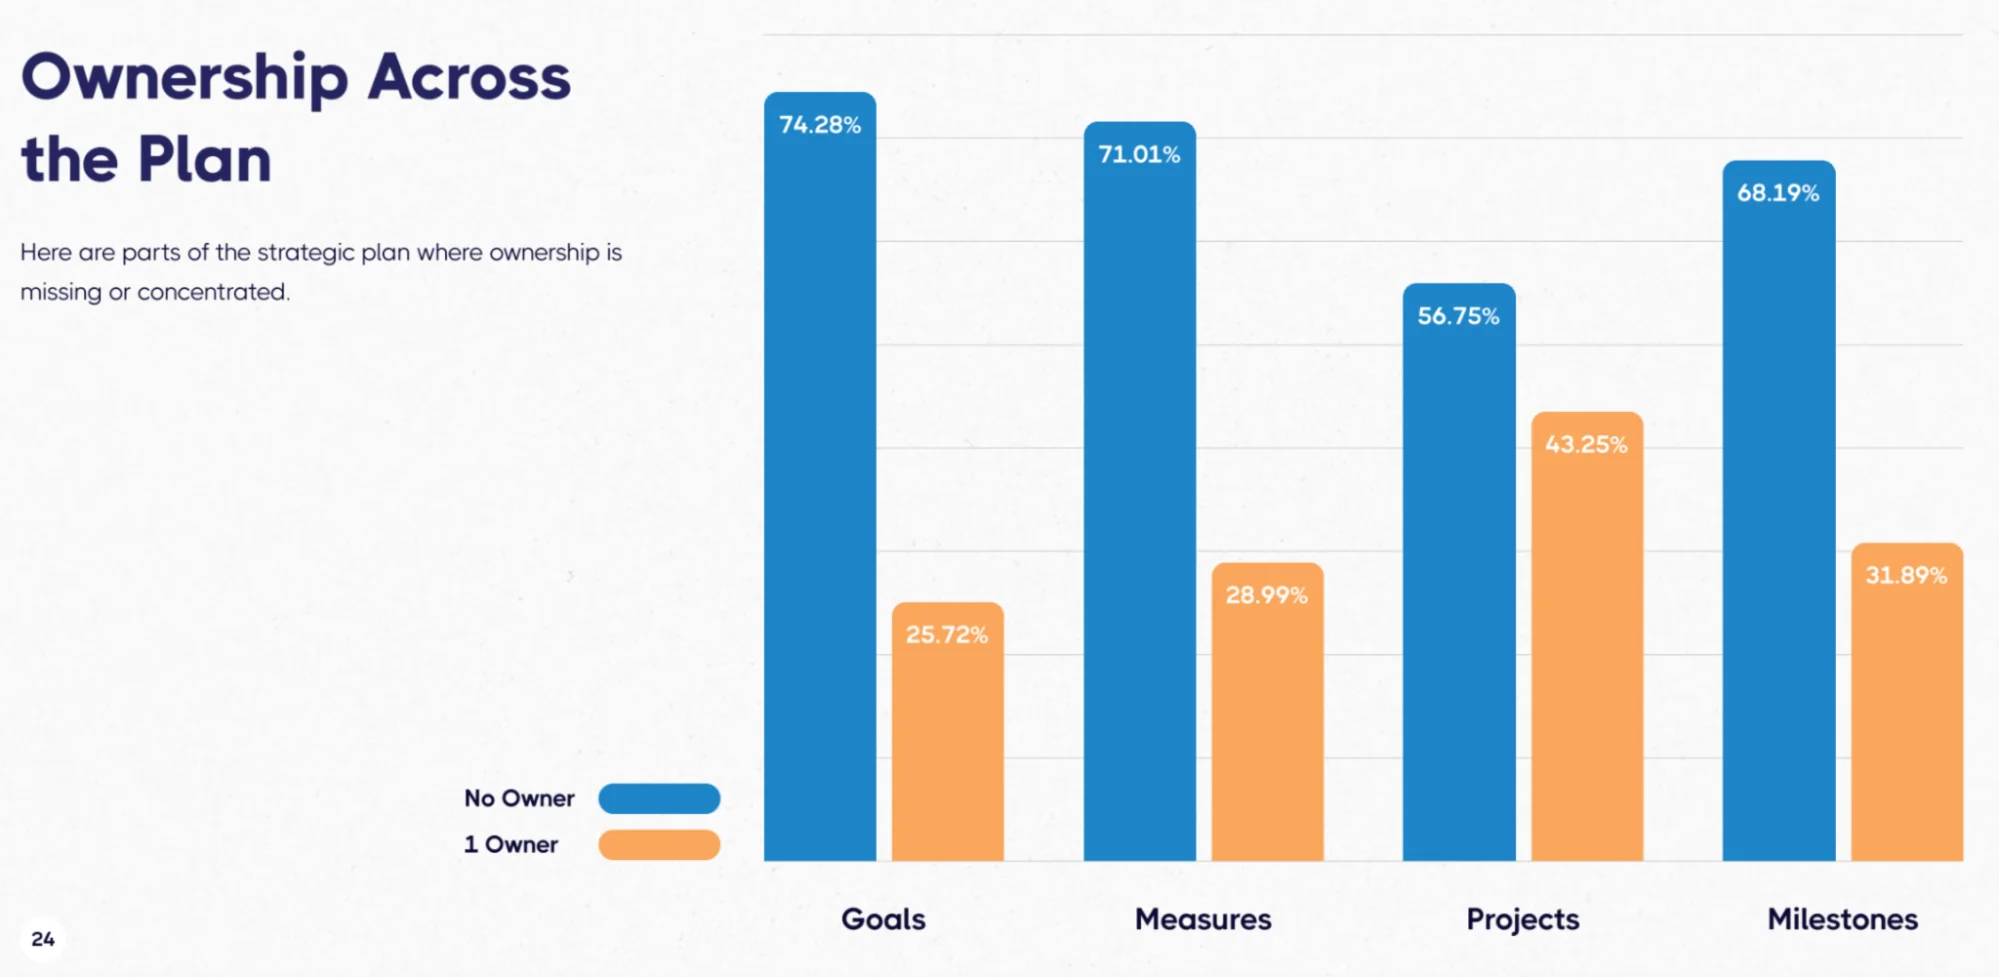
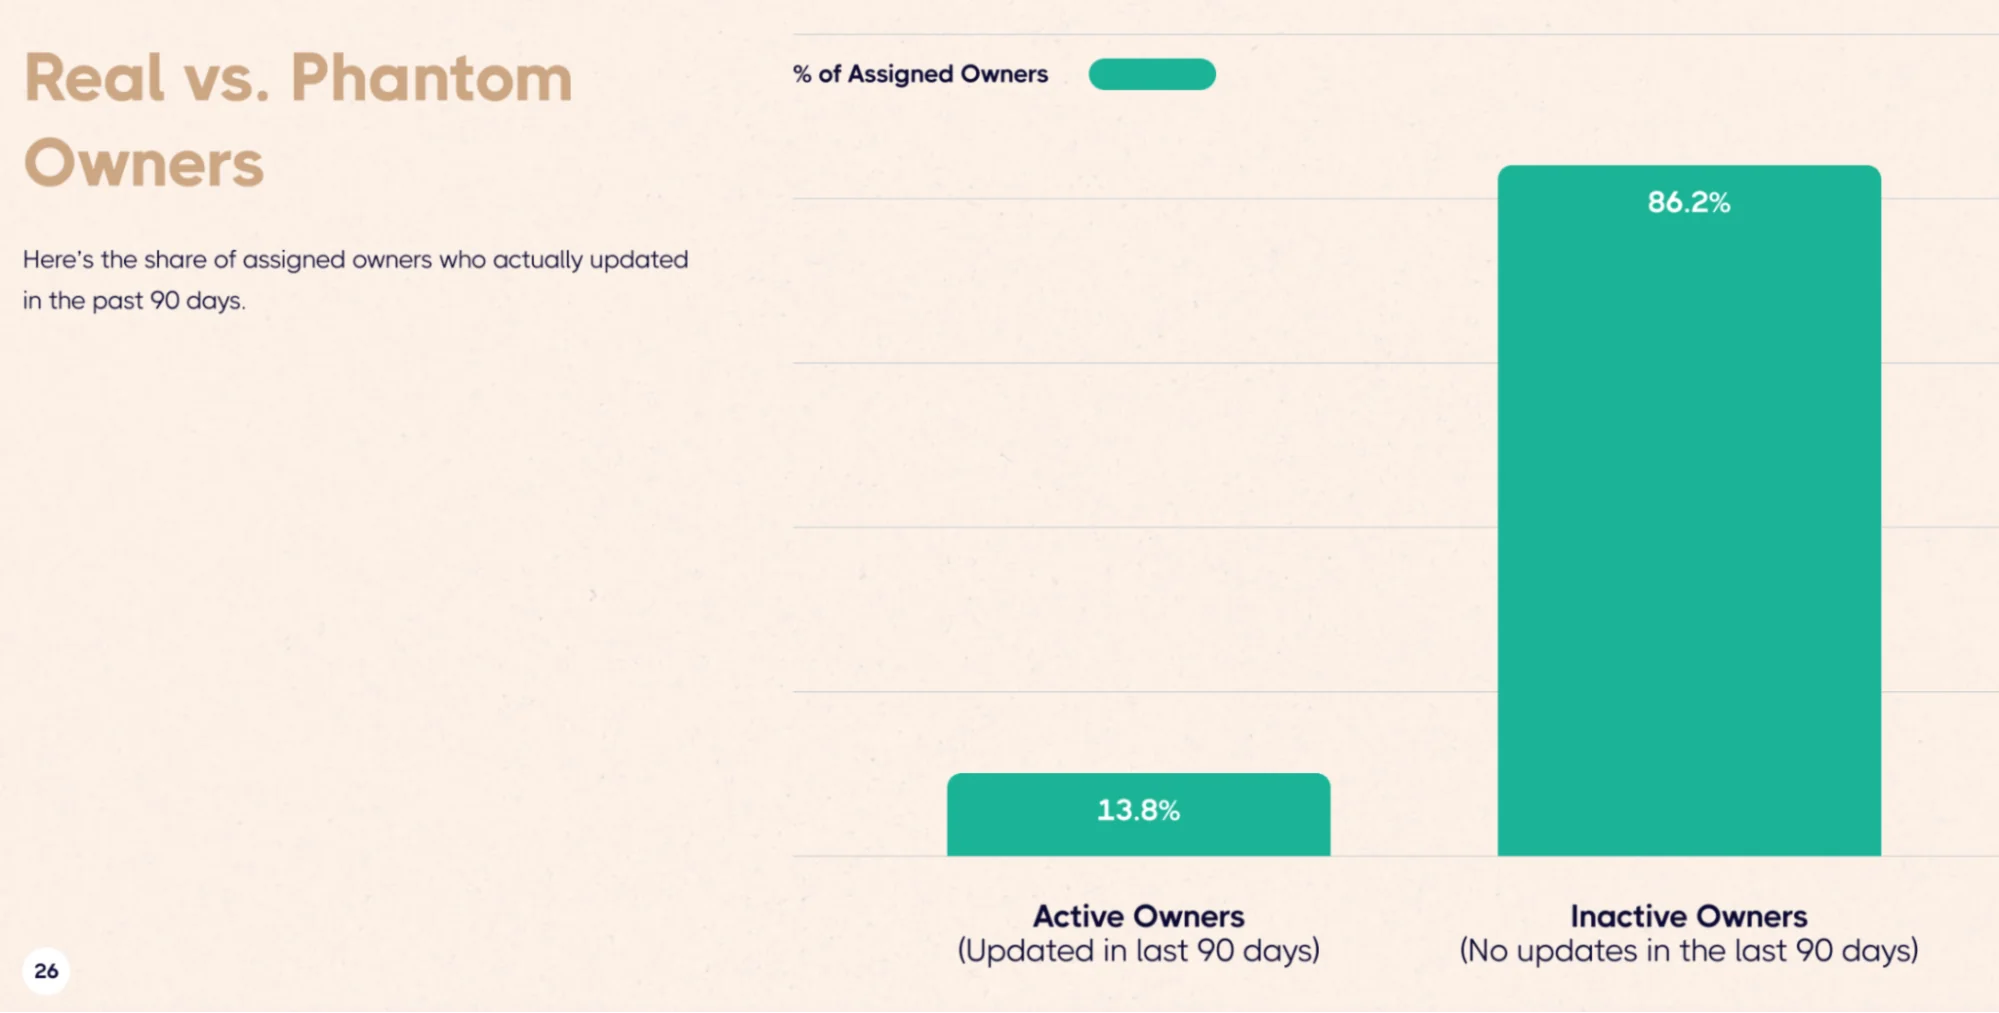
Do the math: if 56.8% have no owner, and only 13.8% of the remaining 43.2% are active, that means about 6% of all strategic projects have owners who are actually working on them.
Six percent.
This is what I call "The Ownership Gap"—the chasm between assigned accountability and actual accountability.
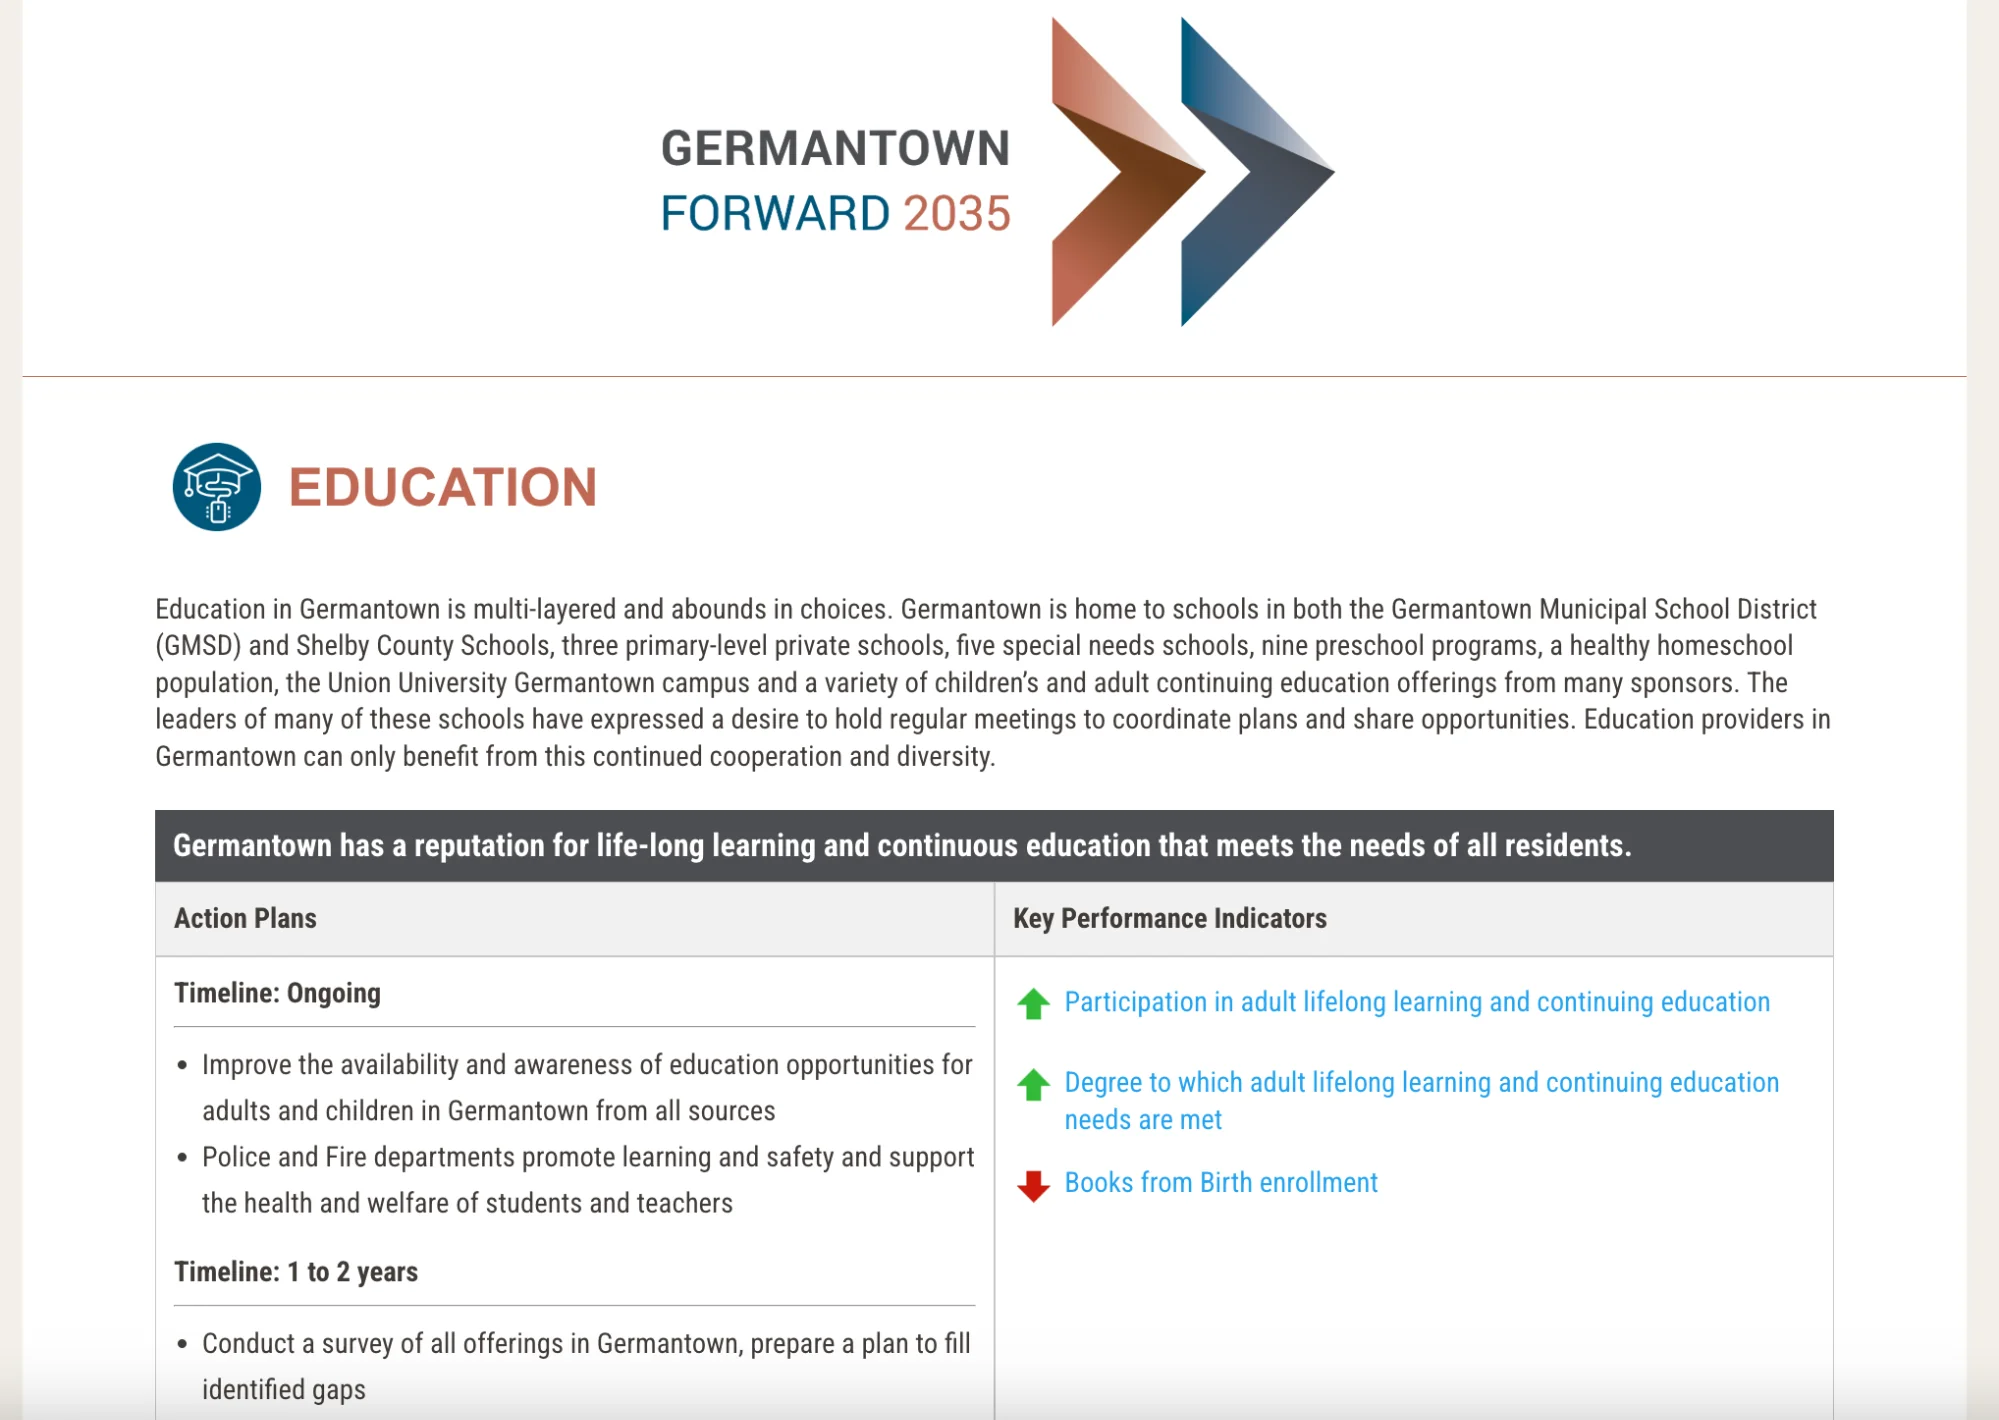
Germantown, Tennessee closed this gap systematically on its path to winning the Malcolm Baldrige National Quality Award. Ownership isn't something that happens during quarterly reviews. It's something that happens daily. And Germantown built systems to make daily ownership visible:
- Every quarter, the City Administrator meets with each department director using "Business Plan" reports to review key metrics.
- Directors can view their strategic plan alignment at any time.
- Most important: They know someone is looking at it regularly.
That visibility creates accountability. Not surveillance—accountability. There's a difference. Surveillance is checking if people are working. Accountability is ensuring people know their work matters and someone cares about results.
Durham County demonstrates this through their city-county coordination. When both entities use the same ClearPoint system, ownership becomes transparent across jurisdictional boundaries.
You can't hide incomplete work or claim "the other agency was supposed to do that." The system shows exactly who owns what and what's actually happening.
The fix requires discipline: every project needs one owner. Not a committee. Not a department. One person who wakes up thinking about that project and goes to bed knowing whether it moved forward today.
And if that person hasn't updated the project in 90 days? Reassign or cancel. No exceptions.
The fix requires discipline: every project needs one owner. Not a committee. Not a department. One person who wakes up thinking about that project and goes to bed knowing whether it moved forward today.
The Completion Curve: Understanding The 83/5.7 Split
Another revealing finding in our dataset:
<p style="padding-left: 30px;">83% of organizations complete less than 25% of their strategic projects. Meanwhile, 5.7% of organizations average 93% completion.</p>
This isn't a normal distribution. It's not a bell curve where most organizations cluster around 50% completion with tails on either end. It's a dramatically skewed curve where the vast majority are barely executing, and a tiny elite are consistently finishing.
What separates the 5.7% from the 83%?
What the elite share is systematic discipline around five factors:
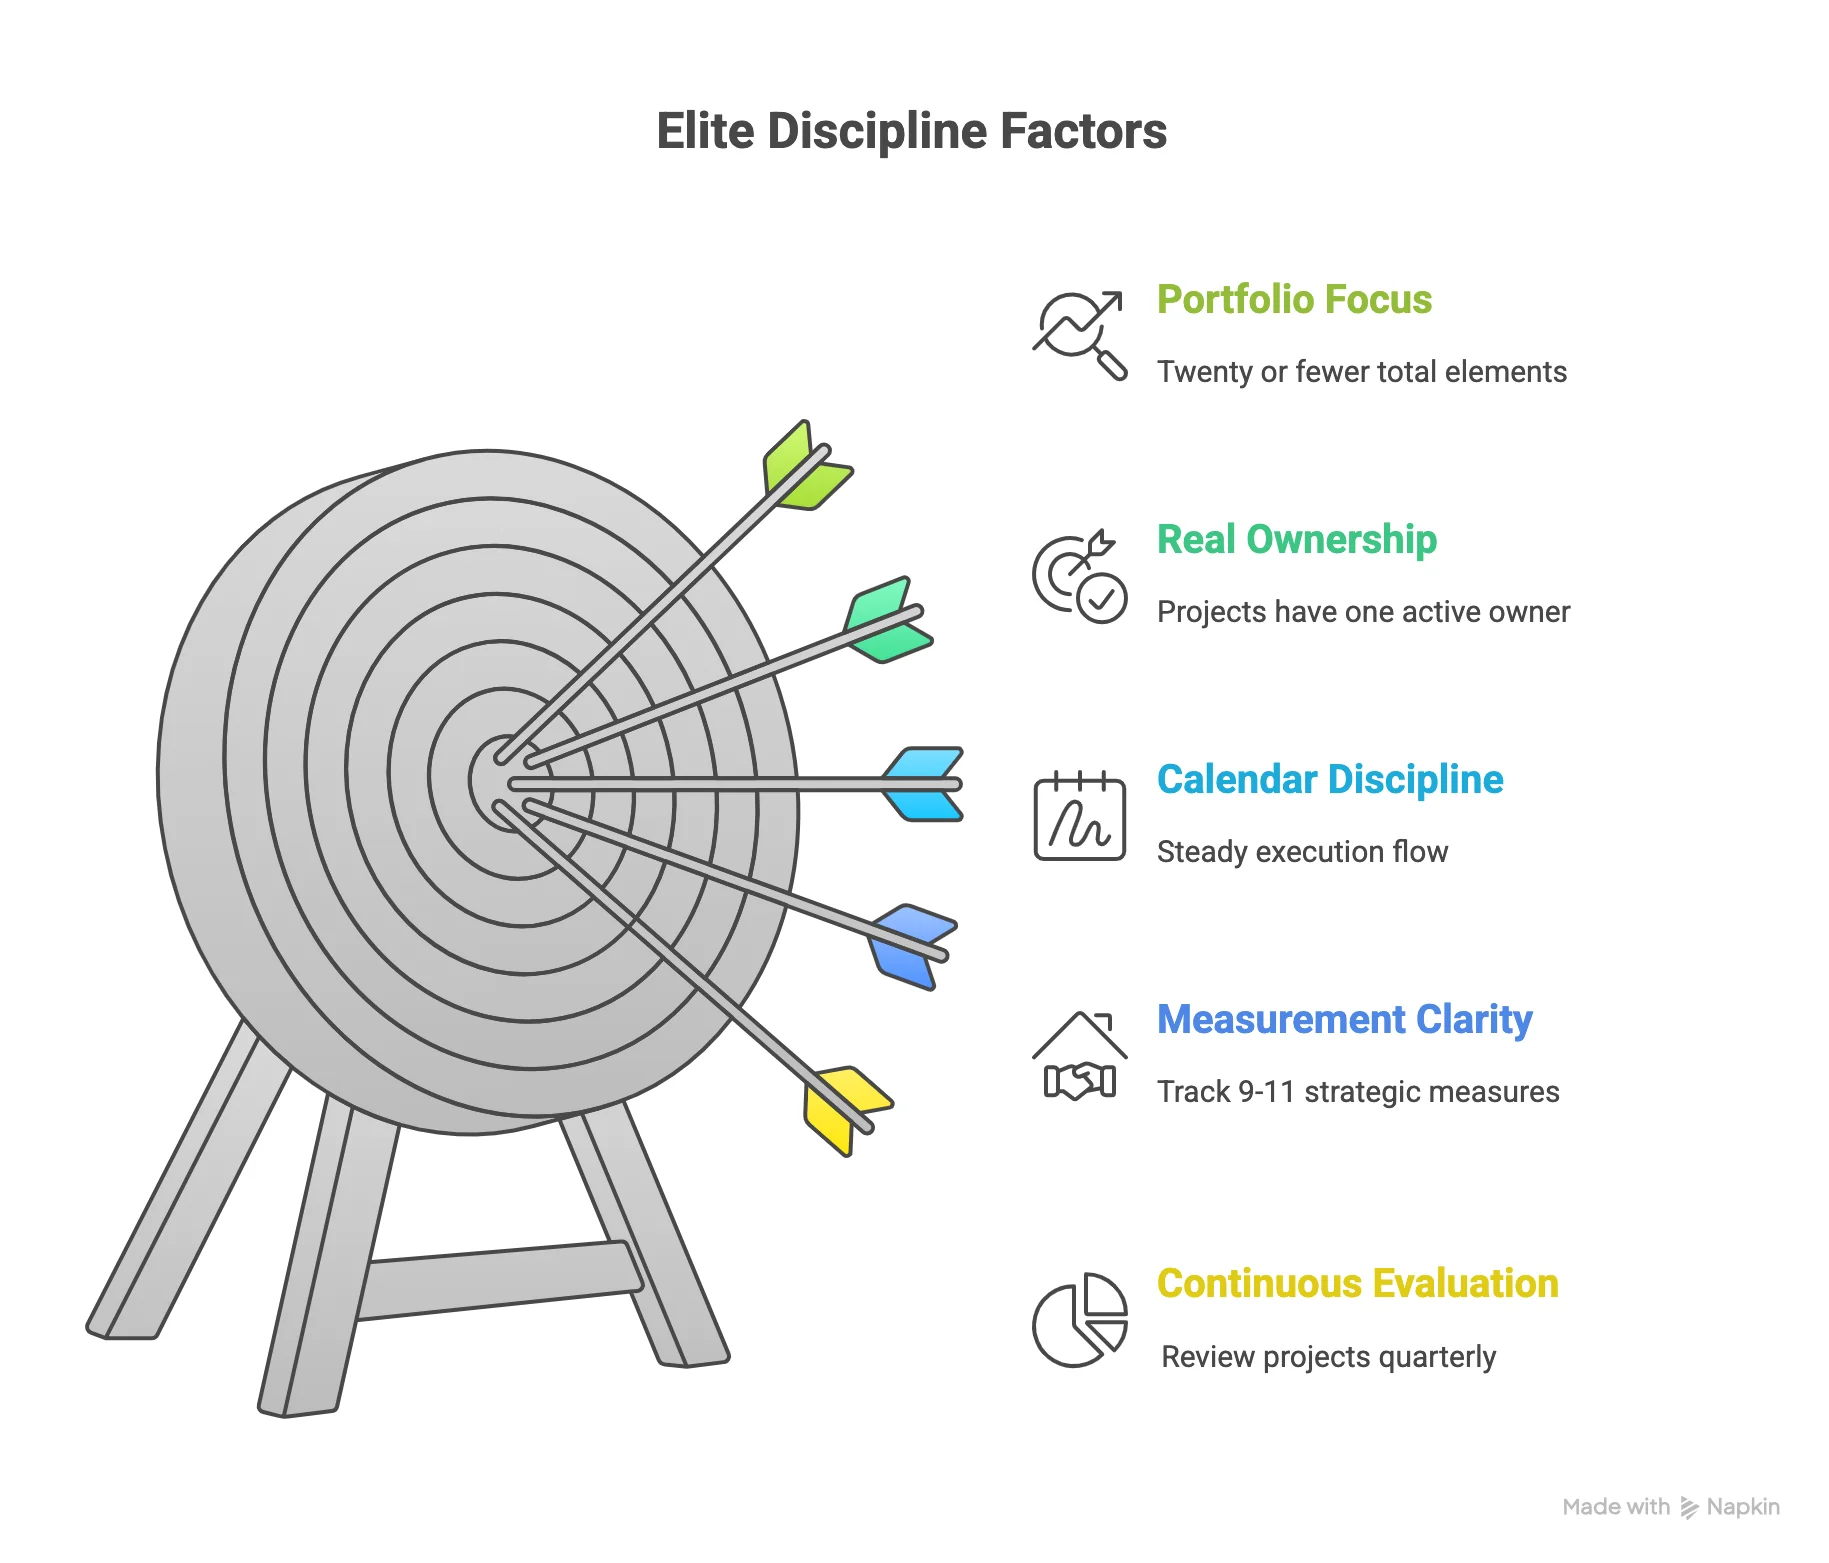
- Portfolio Focus: They maintain 20 or fewer total elements (goals + measures + projects + milestones). Organizations with 60+ elements succeed only 8% of the time.
- Real Ownership: Every project has one active owner. They track "% active owners" as a visible metric and enforce the 90-day rule ruthlessly.
- Calendar Discipline: No single month contains more than 15% of completions. They create a steady execution flow rather than year-end scrambles.
- Measurement Clarity: They track 9-11 strategic measures total, about two per goal. They don't confuse operational and strategic metrics.
- Continuous Evaluation: They review progress quarterly or more frequently. They don't wait for annual reviews to identify problems.
These aren't optional "best practices." They're the price of admission to the 5.7%.
The 5.7% aren't smarter. They're simply more disciplined.
And the 83% could join them by implementing the same five factors.
The question is whether they're willing to do the uncomfortable work of changing how they operate.
What COVID Should Have Taught Us (But Didn't)
The 2020–2023 completion rate surge should have been a watershed moment for strategic planning. Organizations proved they could double their completion rates when circumstances forced discipline.
But by 2024, most organizations had regressed. Completion rates dropped below even 2017 levels. All the lessons from crisis execution were lost.
Why?
Because organizations treated crisis behaviors as temporary measures rather than sustainable practices. "We only moved that fast because we had to" became the excuse for returning to slow execution.
But here's the uncomfortable truth: there was nothing about crisis execution that required crisis. The behaviors that worked during COVID—shorter meetings, faster decisions, ruthless prioritization, bypassing bureaucracy—those behaviors work in normal times too.
Organizations just choose not to use them.
Raleigh built its "Envision. Enact. Evaluate. Engage." framework before COVID, but the crisis showed them how fast each phase could move when it had to. Post-crisis, they didn't revert to pre-crisis timelines. They asked: "How do we maintain this speed without the panic?"
The answer was systematic implementation of what crisis forced:
- Regular CORStat meetings for cross-departmental problem-solving
- Continuous learning through its Analytics Academy
- Quarterly evaluation cycles that don't wait for year-end
Durham County maintained its city-county coordination that produced six completed joint initiatives. They didn't say "That only worked during a crisis." They said "This works, period."
Fort Collins kept the focus on outcomes over metrics that crisis execution demanded. Budget Director Lawrence Pollack pushed for strategic-level reviews even as the crisis faded because he recognized that outcome focus drives completion regardless of circumstances.
The behaviors that worked during COVID—shorter meetings, faster decisions, ruthless prioritization, bypassing bureaucracy—those behaviors work in normal times too.
Organizations just choose not to use them.
The organizations that maintained high completion rates after 2023 are the ones that learned the right lesson from COVID:
<p style="padding-left: 30px;">Crisis didn't create new capabilities. It revealed existing capabilities that bureaucracy had been suppressing.</p>
Remove the bureaucracy permanently, and you keep the completion rates without needing the crisis.
That's the lesson most organizations missed: You can choose discipline. You don't need disaster to force it.
The Projects That Never Should Have Started
Here's a finding that doesn't get enough attention: many incomplete projects aren't incomplete because execution failed. They're incomplete because they never should have been projects in the first place.
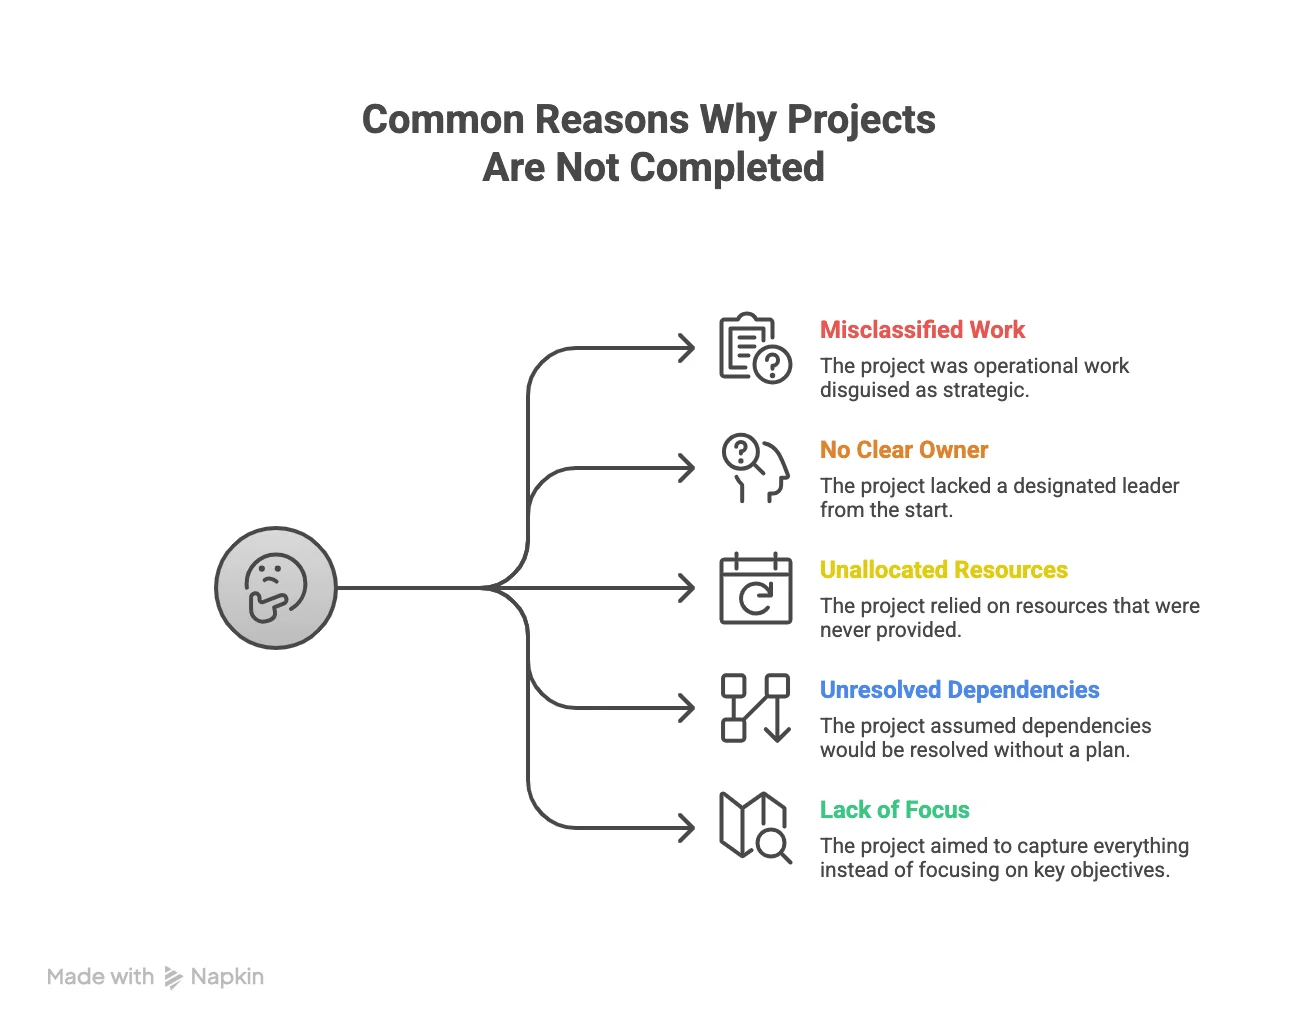
When we looked at the 80% of projects that don't get completed, a significant portion fall into a few predictable categories:
- The projects were actually operational work misclassified as strategic initiatives.
- The projects had no clear owner from day one.
- The projects depended on resources that were never allocated.
- The projects assumed that dependencies would be resolved but had no plan to resolve them.
- The projects were added to "capture everything" rather than focus on what matters.
Fort Lauderdale leaders learned this lesson when they launched "Press Play Fort Lauderdale" with 191 initiatives.
Most of those 191 weren't really strategic initiatives—they were operational improvements, routine upgrades, or nice-to-have enhancements that got elevated to "strategic" status during planning sessions.
When they simplified to fewer, focused priorities, completion rates improved—not because execution got better but because they stopped starting projects that had no realistic path to completion.
Germantown applies this filter rigorously. Before a project enters their strategic plan, they ask:
- Does this serve customer needs?
- Does it align with our strategic objectives?
- Do we have the ownership and resources to complete it?
If the answer to any question is no, it doesn't become a strategic project.
This discipline means their strategic plan contains fewer projects than many comparable cities. But their completion rate is higher because every project that starts has a realistic chance of finishing.
<div class="index-cards"><div class="index-card"><div class="index-card-title">Optimize Your Projects</div><div class="index-card-content"><p>It’s not just about finishing what you start. It's about starting only what you can finish.</p><p>That requires saying <em>no</em> to good ideas that aren't strategic priorities. Push back when departments want their initiatives elevated to strategic status, and make it clear to teams that they need to distinguish between "We should do this someday" and "This is essential to our strategy right now."</p></div><div></div>
The 5.7% of organizations completing 93% of their projects aren't miracle workers. They're just realistic about what they can actually accomplish. They start fewer projects. They finish more.
Meanwhile, the 83% completing less than 25% keep adding projects, hoping that more initiatives will eventually produce more results. The data says otherwise.
The Real Cost Of Incompletion
When a strategic project doesn't complete, organizations typically treat it as a planning failure. "We need better project management." "We need clearer milestones." "We need more rigorous tracking."
But incomplete projects aren't just execution failures. They're organizational taxes.
Every incomplete project represents:
- Budget dollars spent with no return
- Staff time invested with no outcome
- Opportunity cost from not doing other work
- Credibility damage when stakeholders see nothing finished
- Momentum loss as teams disengage from "strategy theater"
Durham County quantifies this. Through their data-driven approach and city-county coordination, leaders can point to specific results from completed initiatives: 1,700 students trained through their CPR program, $1.8 million in budget savings from eliminating non-strategic spending, and a consistent triple-A bond rating through economic challenges.
Those results only happen from completed work.
Incomplete initiatives produce none of that value while consuming resources that could have gone elsewhere.
Shari Metcalfe, Durham's Strategy and Performance Manager, describes the shift:
"A big turning point for our performance management was getting a system that we could use to manage all that data. It's just easier. Less time putting numbers in a system and more time actually looking at the numbers and making decisions based on those."
The transition from data entry to decision-making only happens when projects complete. Incomplete projects just generate more data entry with no decisions, no results, no value.
Raleigh understands this through their CORStat meetings. These aren't status updates on what percentage of work is done. They're problem-solving sessions focused on what's blocking completion and how to remove those blocks.
The underlying assumption: Completion is the goal. Not activity. Not progress updates. Completion. And if something isn't going to complete, better to cancel it now than waste more resources pretending it might.
This mindset shift—from "we're working on it" to "we're finishing it"—changes everything about execution discipline.
Building A Completion Culture
Organizations that consistently complete 90%+ of their strategic projects don't have better project managers. They have better cultures around completion.
What does a completion culture look like?
<p style="padding-left: 30px;">👉<strong>In Raleigh:</strong> An Analytics Academy that has reached 100% of departments, teaching not just strategic frameworks but execution discipline; and CORStat meetings where problems get solved in real-time rather than deferred to next quarter.</p>
<p style="padding-left: 30px;">👉<strong>In Durham County:</strong> City-county coordination that makes completion visible across jurisdictional boundaries.</p>
<p style="padding-left: 30px;">👉<strong>In Fort Collins: </strong>Pushing for outcome-focused Strategy Maps instead of metric-focused reviews.</p>
<p style="padding-left: 30px;">👉<strong>In Germantown:</strong> Treating performance management as "everyday operations" rather than quarterly exercises, and Business Plan reports that connect department work directly to strategic objectives.</p>
These cultures weren't created through mission statements or leadership speeches. They were built through five systematic practices:
- Regular reviews focused on removing blockers, not explaining delays.
- Visible ownership where everyone knows who's responsible for what.
- Ruthless prioritization that starts fewer projects but finishes more.
- Calendar discipline that spreads work throughout the year.
- Data transparency that makes incompletion uncomfortable.
That last point matters more than you'd think. When incomplete projects are visible to the entire organization—when everyone can see what's not getting done—social pressure creates accountability that no amount of top-down mandates can match.
Durham's public dashboard doesn't just show citizens what the city is working on. It creates internal accountability because nobody wants their incomplete work visible to 283,000 residents.
Germantown's community dashboard serves the same purpose. When you tell your "customers" (citizens) what you're going to do, completing it stops being optional.
Building a completion culture isn't complicated. But it is uncomfortable.
It requires making incompleteness visible. It requires canceling projects that aren't going to finish. It requires removing phantom owners who aren't actually working.
Most organizations prefer the comfort of activity over the discomfort of accountability. That's why 83% complete less than 25% of their projects.
The 5.7% chose discomfort. And they finish what they start.
Most organizations prefer the comfort of activity over the discomfort of accountability. That's why 83% complete less than 25% of their projects.
So How Often Are Strategic Initiatives Completed?
Back to the original question: how often are strategic initiatives completed?
The answer: across 130,324 projects tracked from 2017-2024, about 15–20% on average, with significant variation by year, industry, and organization.
But that's not really the question that matters.
The question that matters is: How often could strategic initiatives be completed?
The data says 93%. That's what the top 5.7% of organizations achieve consistently.
The gap between 15-20% and 93% isn't about capability. It's about discipline.
None of the organizations we’ve talked about have special advantages. They all operate in local government with typical constraints. They all face budget limitations, stakeholder pressures, and complex operational demands.
What they have is systematic discipline around portfolio focus, real ownership, calendar management, measurement clarity, and continuous evaluation.
Those five disciplines turn 15-20% completion into 90%+ completion. Consistently.
So the real answer to "how often are strategic initiatives completed?" is:
Not often enough. But they could be. The data says it's possible. Your organization just has to decide it's worth the discomfort of actually changing how you work.


