![How To Statistically Position Your Balanced Scorecard For Success [DATA]](https://cdn.prod.website-files.com/637e14518f6e3b2a5c392294/69c84f652333081b421e8425_how-to-statistically-position-your-balanced-scorecard-for-success-data-blog-header.webp)
![How To Statistically Position Your Balanced Scorecard For Success [DATA]](https://cdn.prod.website-files.com/637e14518f6e3b2a5c392294/685aa3560e9d1f6c45affc2f_Ted_Jackson_1.webp)
Data from 20,582 Balanced Scorecards reveals the five levers that separate high performers from the rest. Here’s the execution formula—and how to apply it to your BSC.
You chose the Balanced Scorecard (BSC) because you wanted a framework that connected financial outcomes to the operational, customer, and learning drivers that actually produce them.
- Across 20,582 plans, the average organization completes just 12.5% of strategic projects a year — the baseline a Balanced Scorecard has to beat.
- Execution comes down to five levers: Focus, Ownership, Measurement, Flow, and Team — together they decide whether a scorecard runs or sits on a shelf.
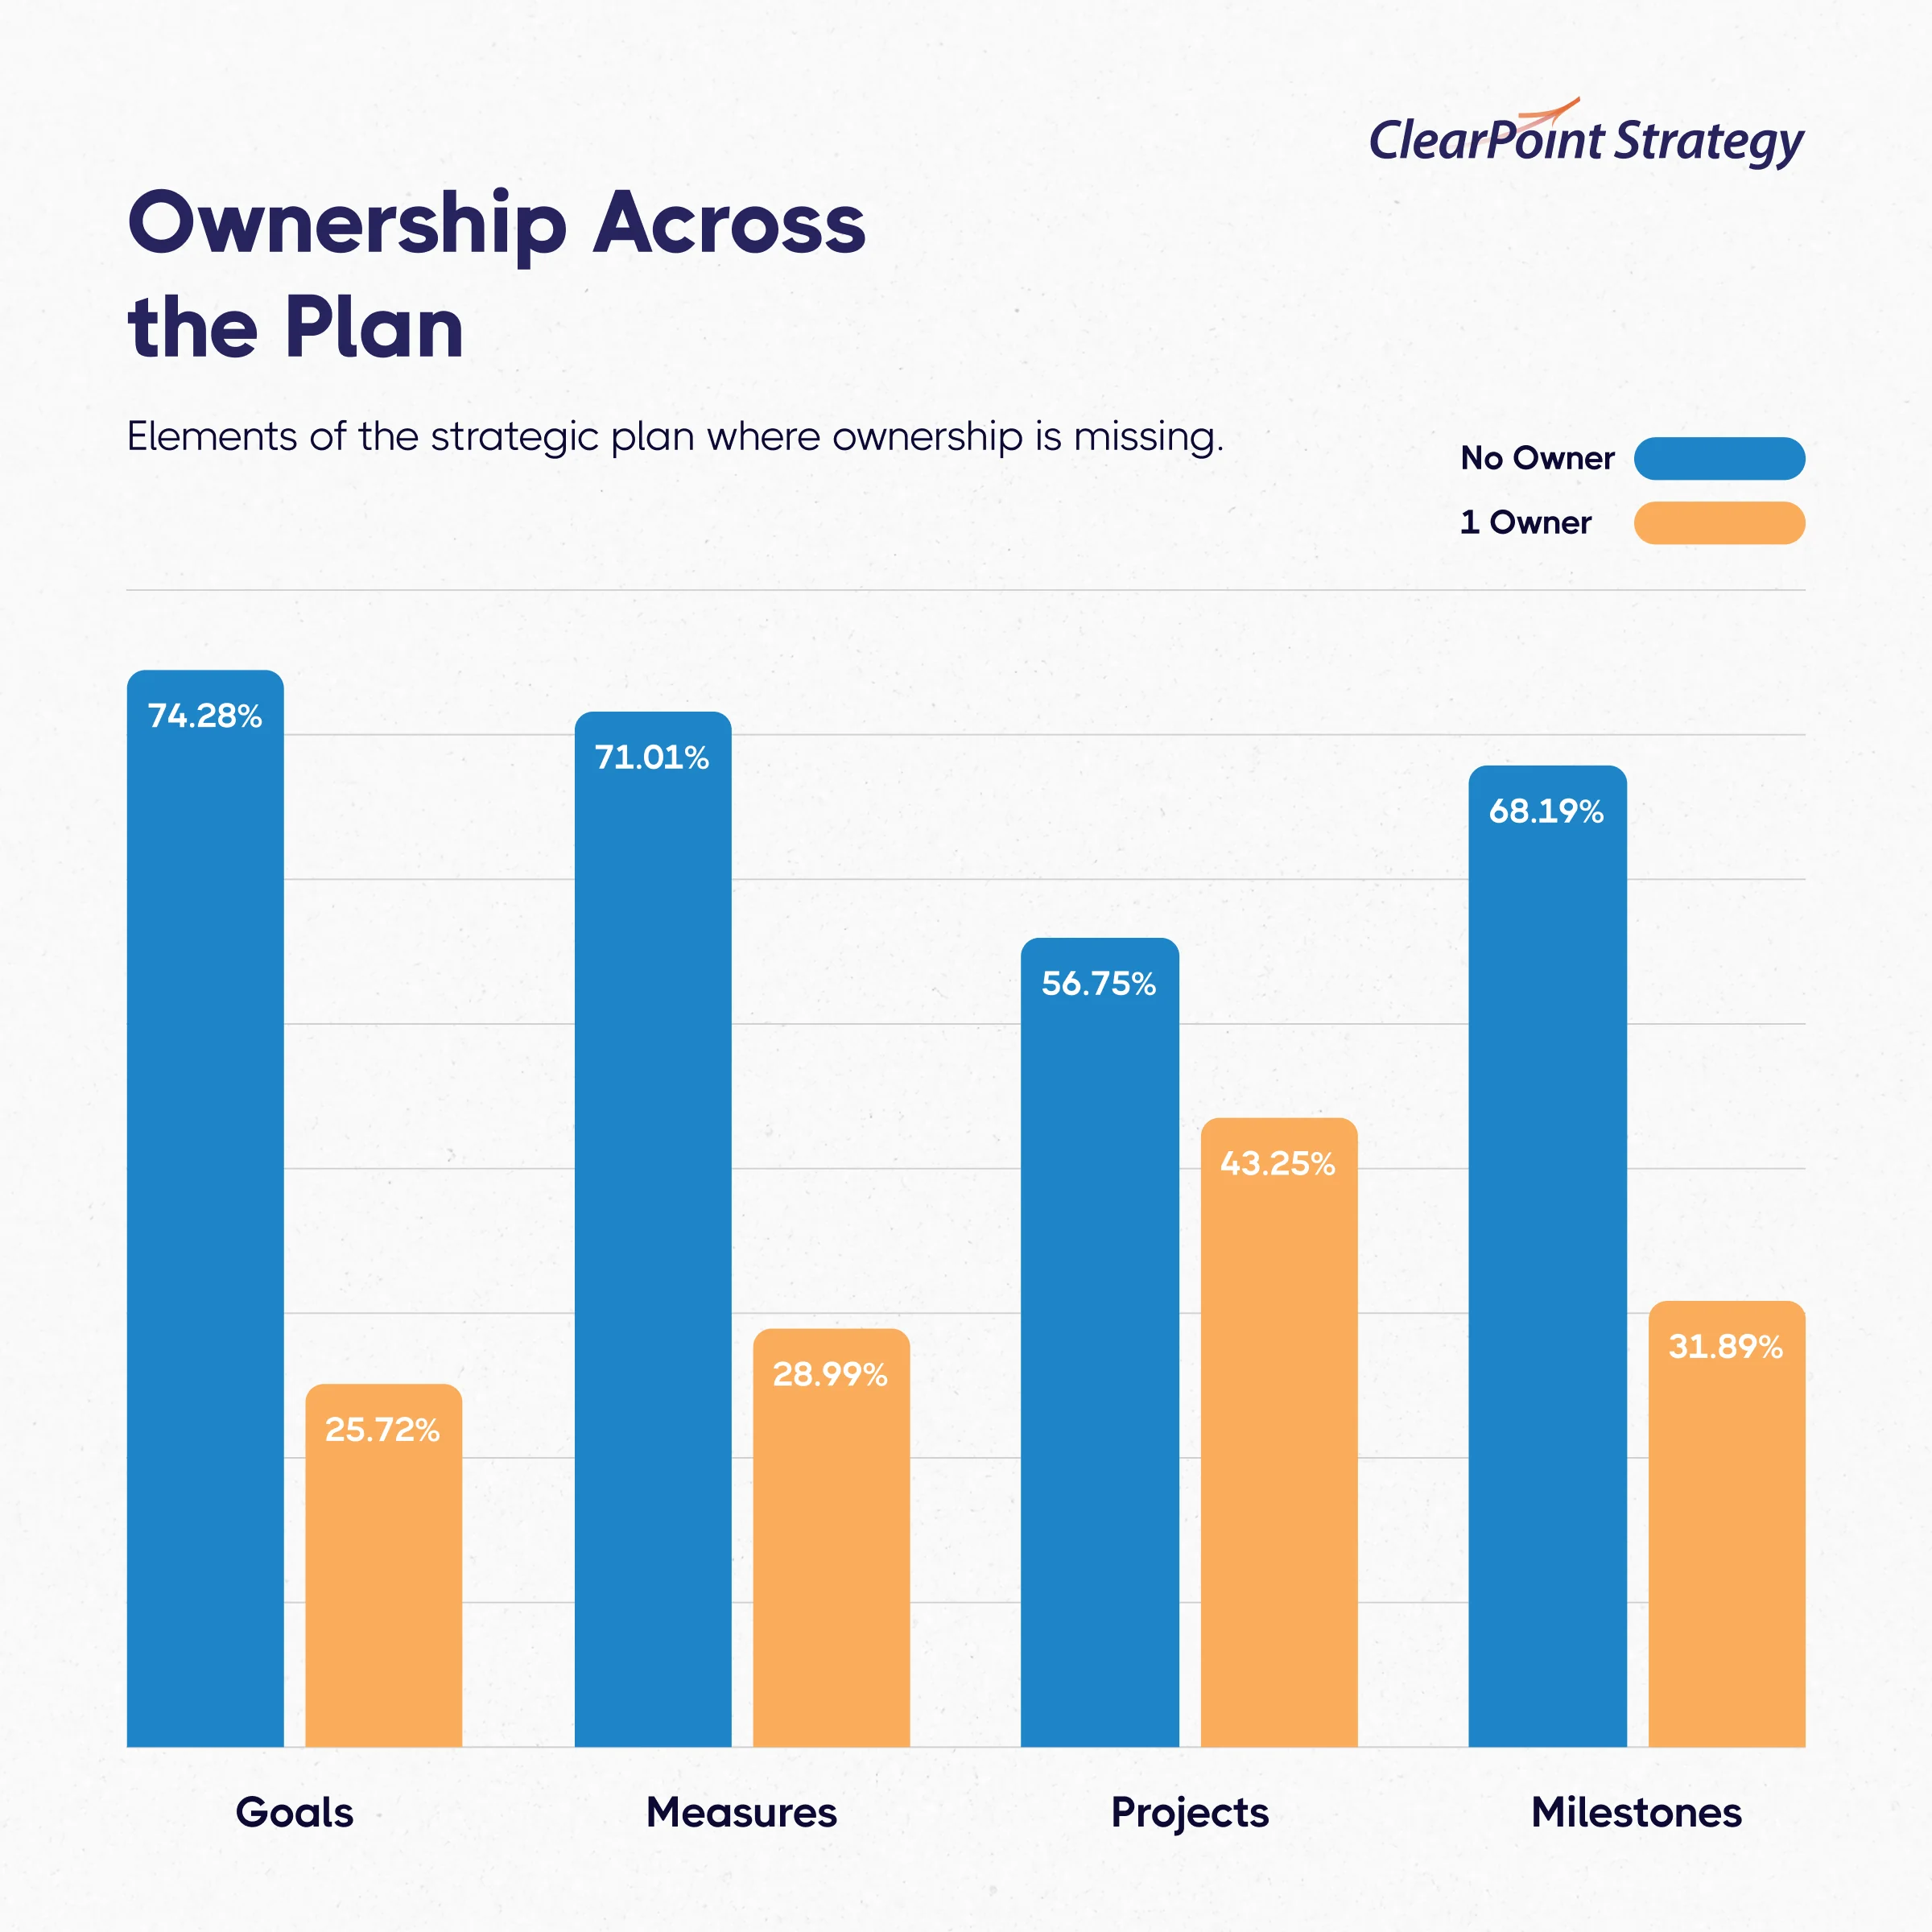
- Ownership is the biggest gap: 74.3% of active goals and 71% of measures have no named owner, so accountability breaks down before work begins.
- The calendar undermines more scorecards than strategy does — January sees 8.5x more project starts than December, creating predictable bottlenecks.
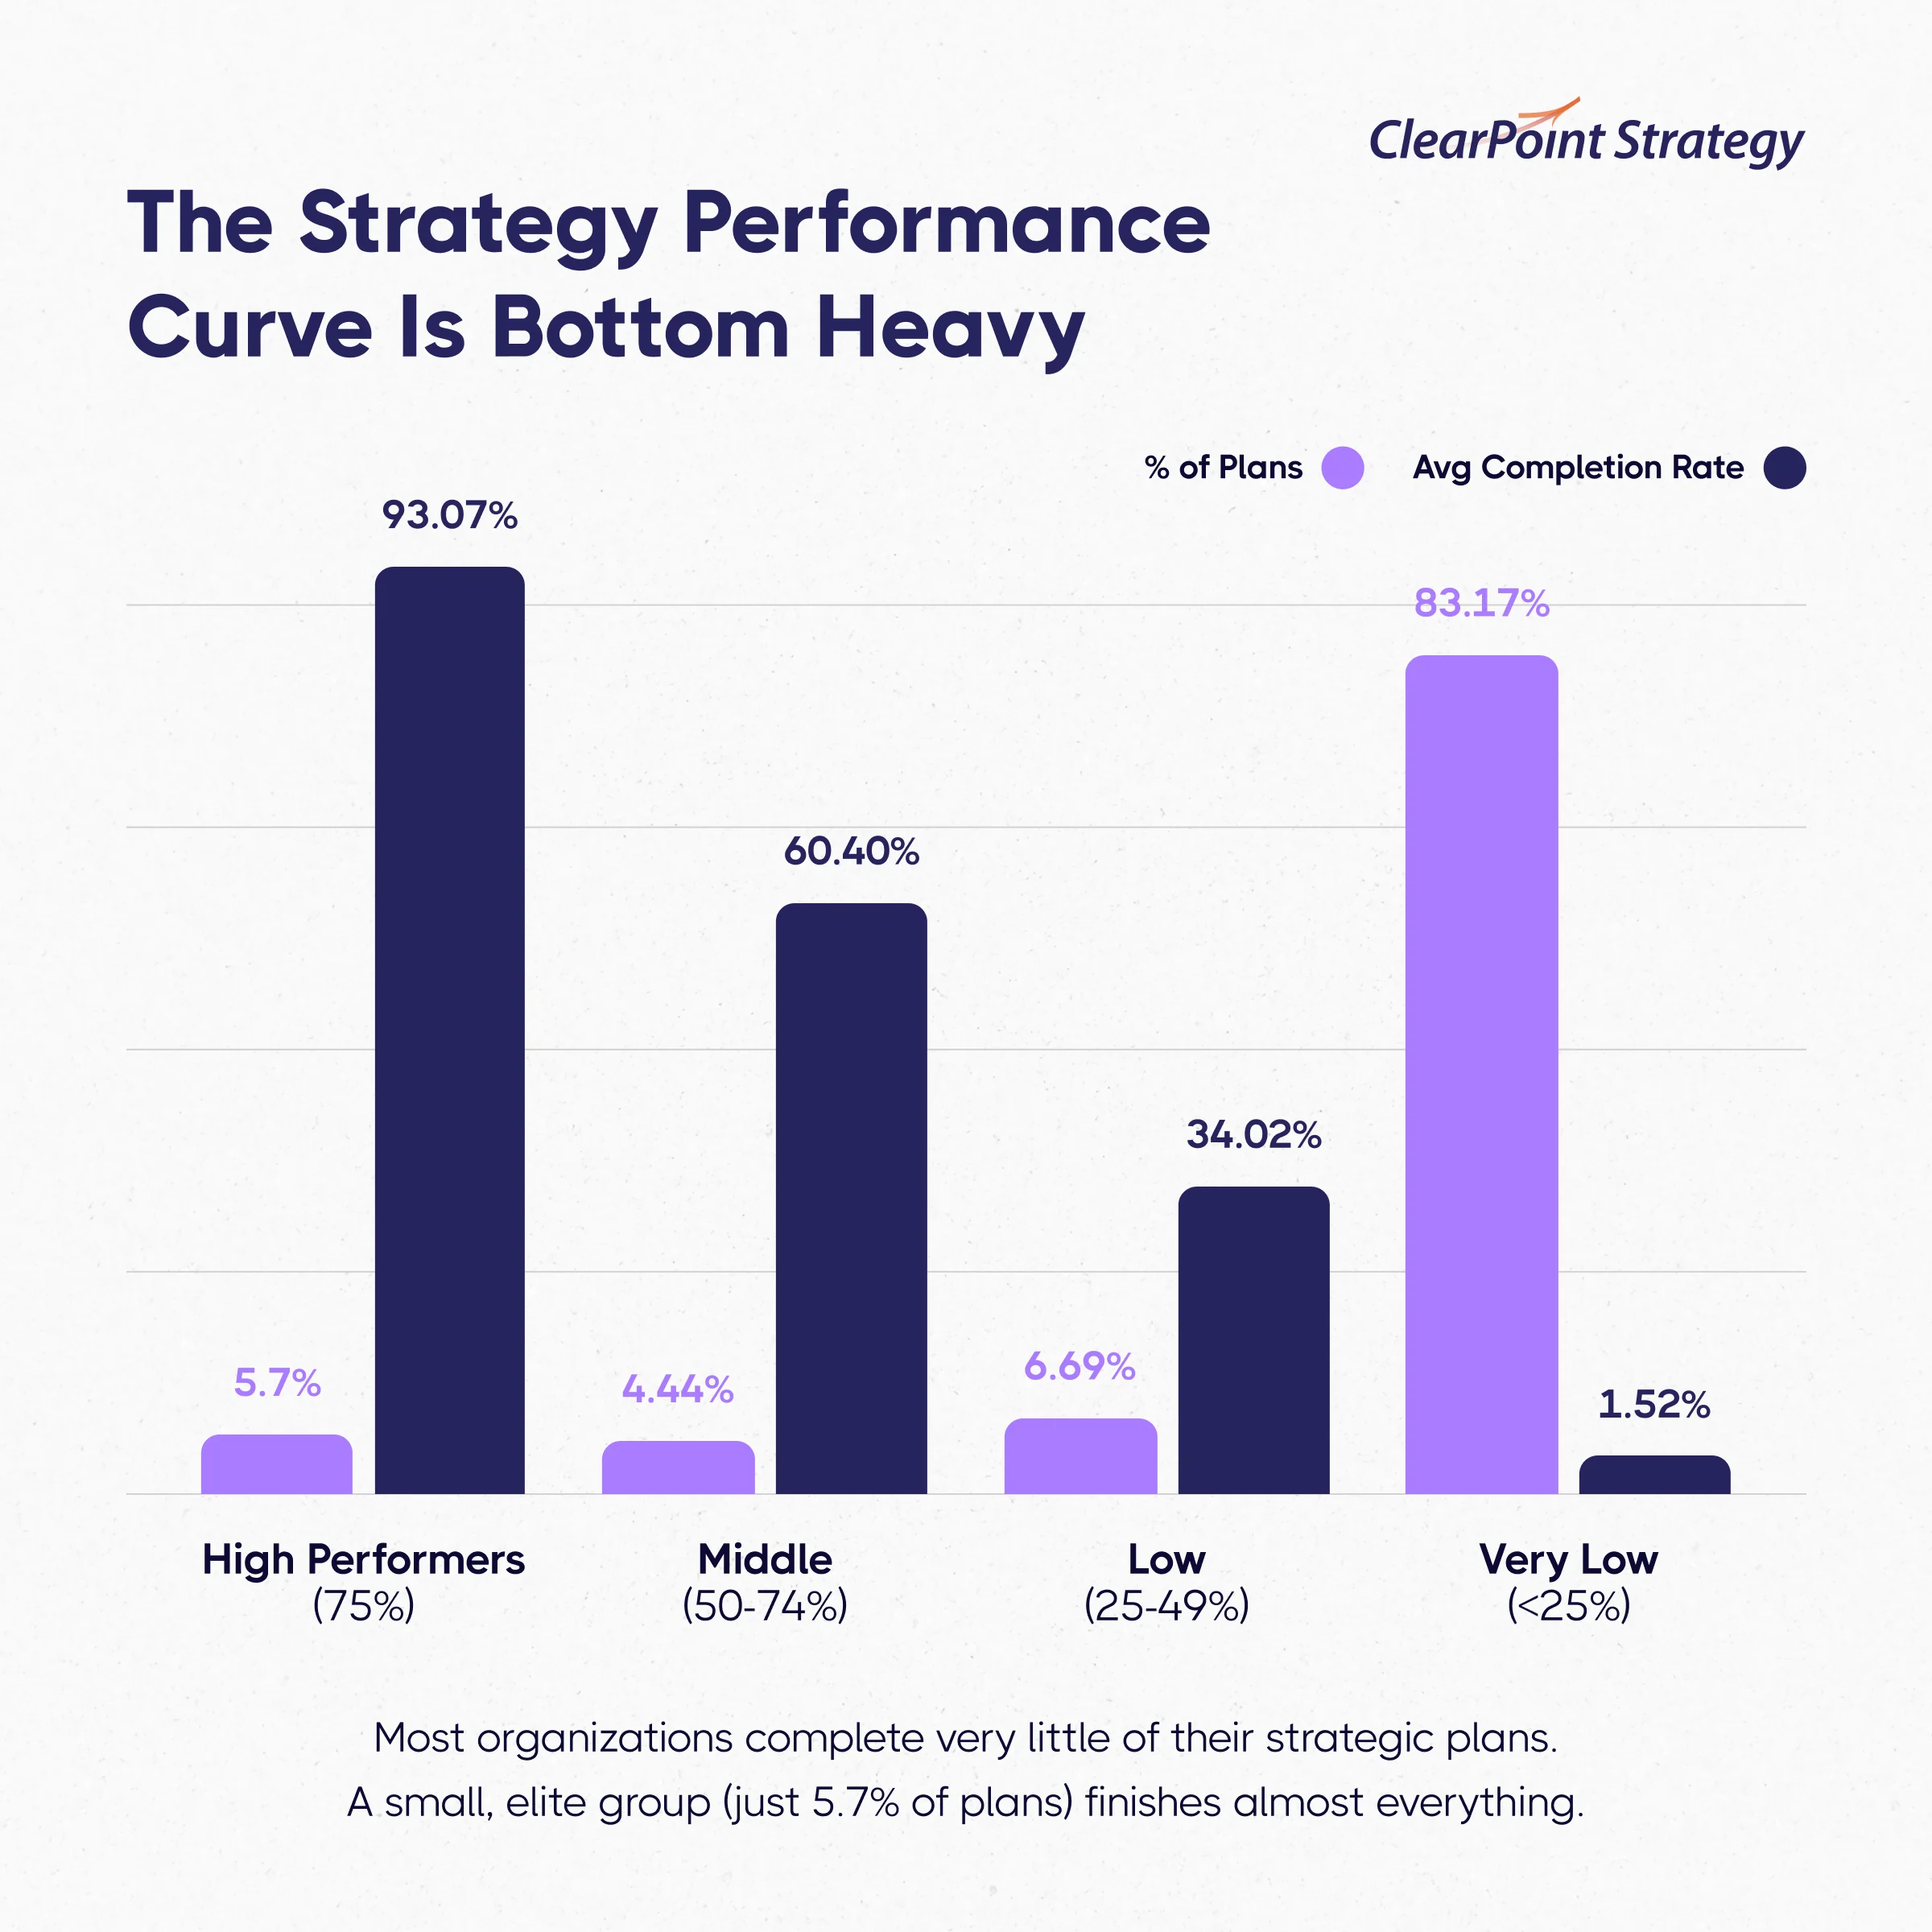
- The top 5.7% of organizations, completing 75% or more of projects, use the same four-perspective structure with tighter execution discipline, not a different framework.
That’s the right instinct.
But the uncomfortable truth you may still discover is that, while the framework is sound, the execution is where you’re likely to fall short.
How do we know this? We’ve seen the data. Our 2026 Strategic Planning Report analyzed 31.2 million rows of activity data from 20,582 strategic plans spanning 2017 to 2024. Every one of those plans is, structurally, a Balanced Scorecard — a set of goals, measures, projects, and milestones organized around strategic perspectives.
The data shows exactly where BSC execution breaks down, and what the organizations that get it right are doing differently.
Get the complete dataset to unlock better performance this year. Download the 2026 Strategic Planning Report now.
The Baseline: What BSC Execution Actually Looks Like
Before the formula, the reality check.
Across all 20,582 plans in the dataset:
<p style="padding-left: 30px;">☑️ The average organization completes just <strong>12.5% of strategic projects</strong> per year</p>
<p style="padding-left: 30px;">🟩 Only <strong>39% of strategic goals are rated green</strong> (on track or above plan)</p>
<p style="padding-left: 30px;"><strong>🧑‍🦰 74.3% of active goals have no named owner</strong></p>
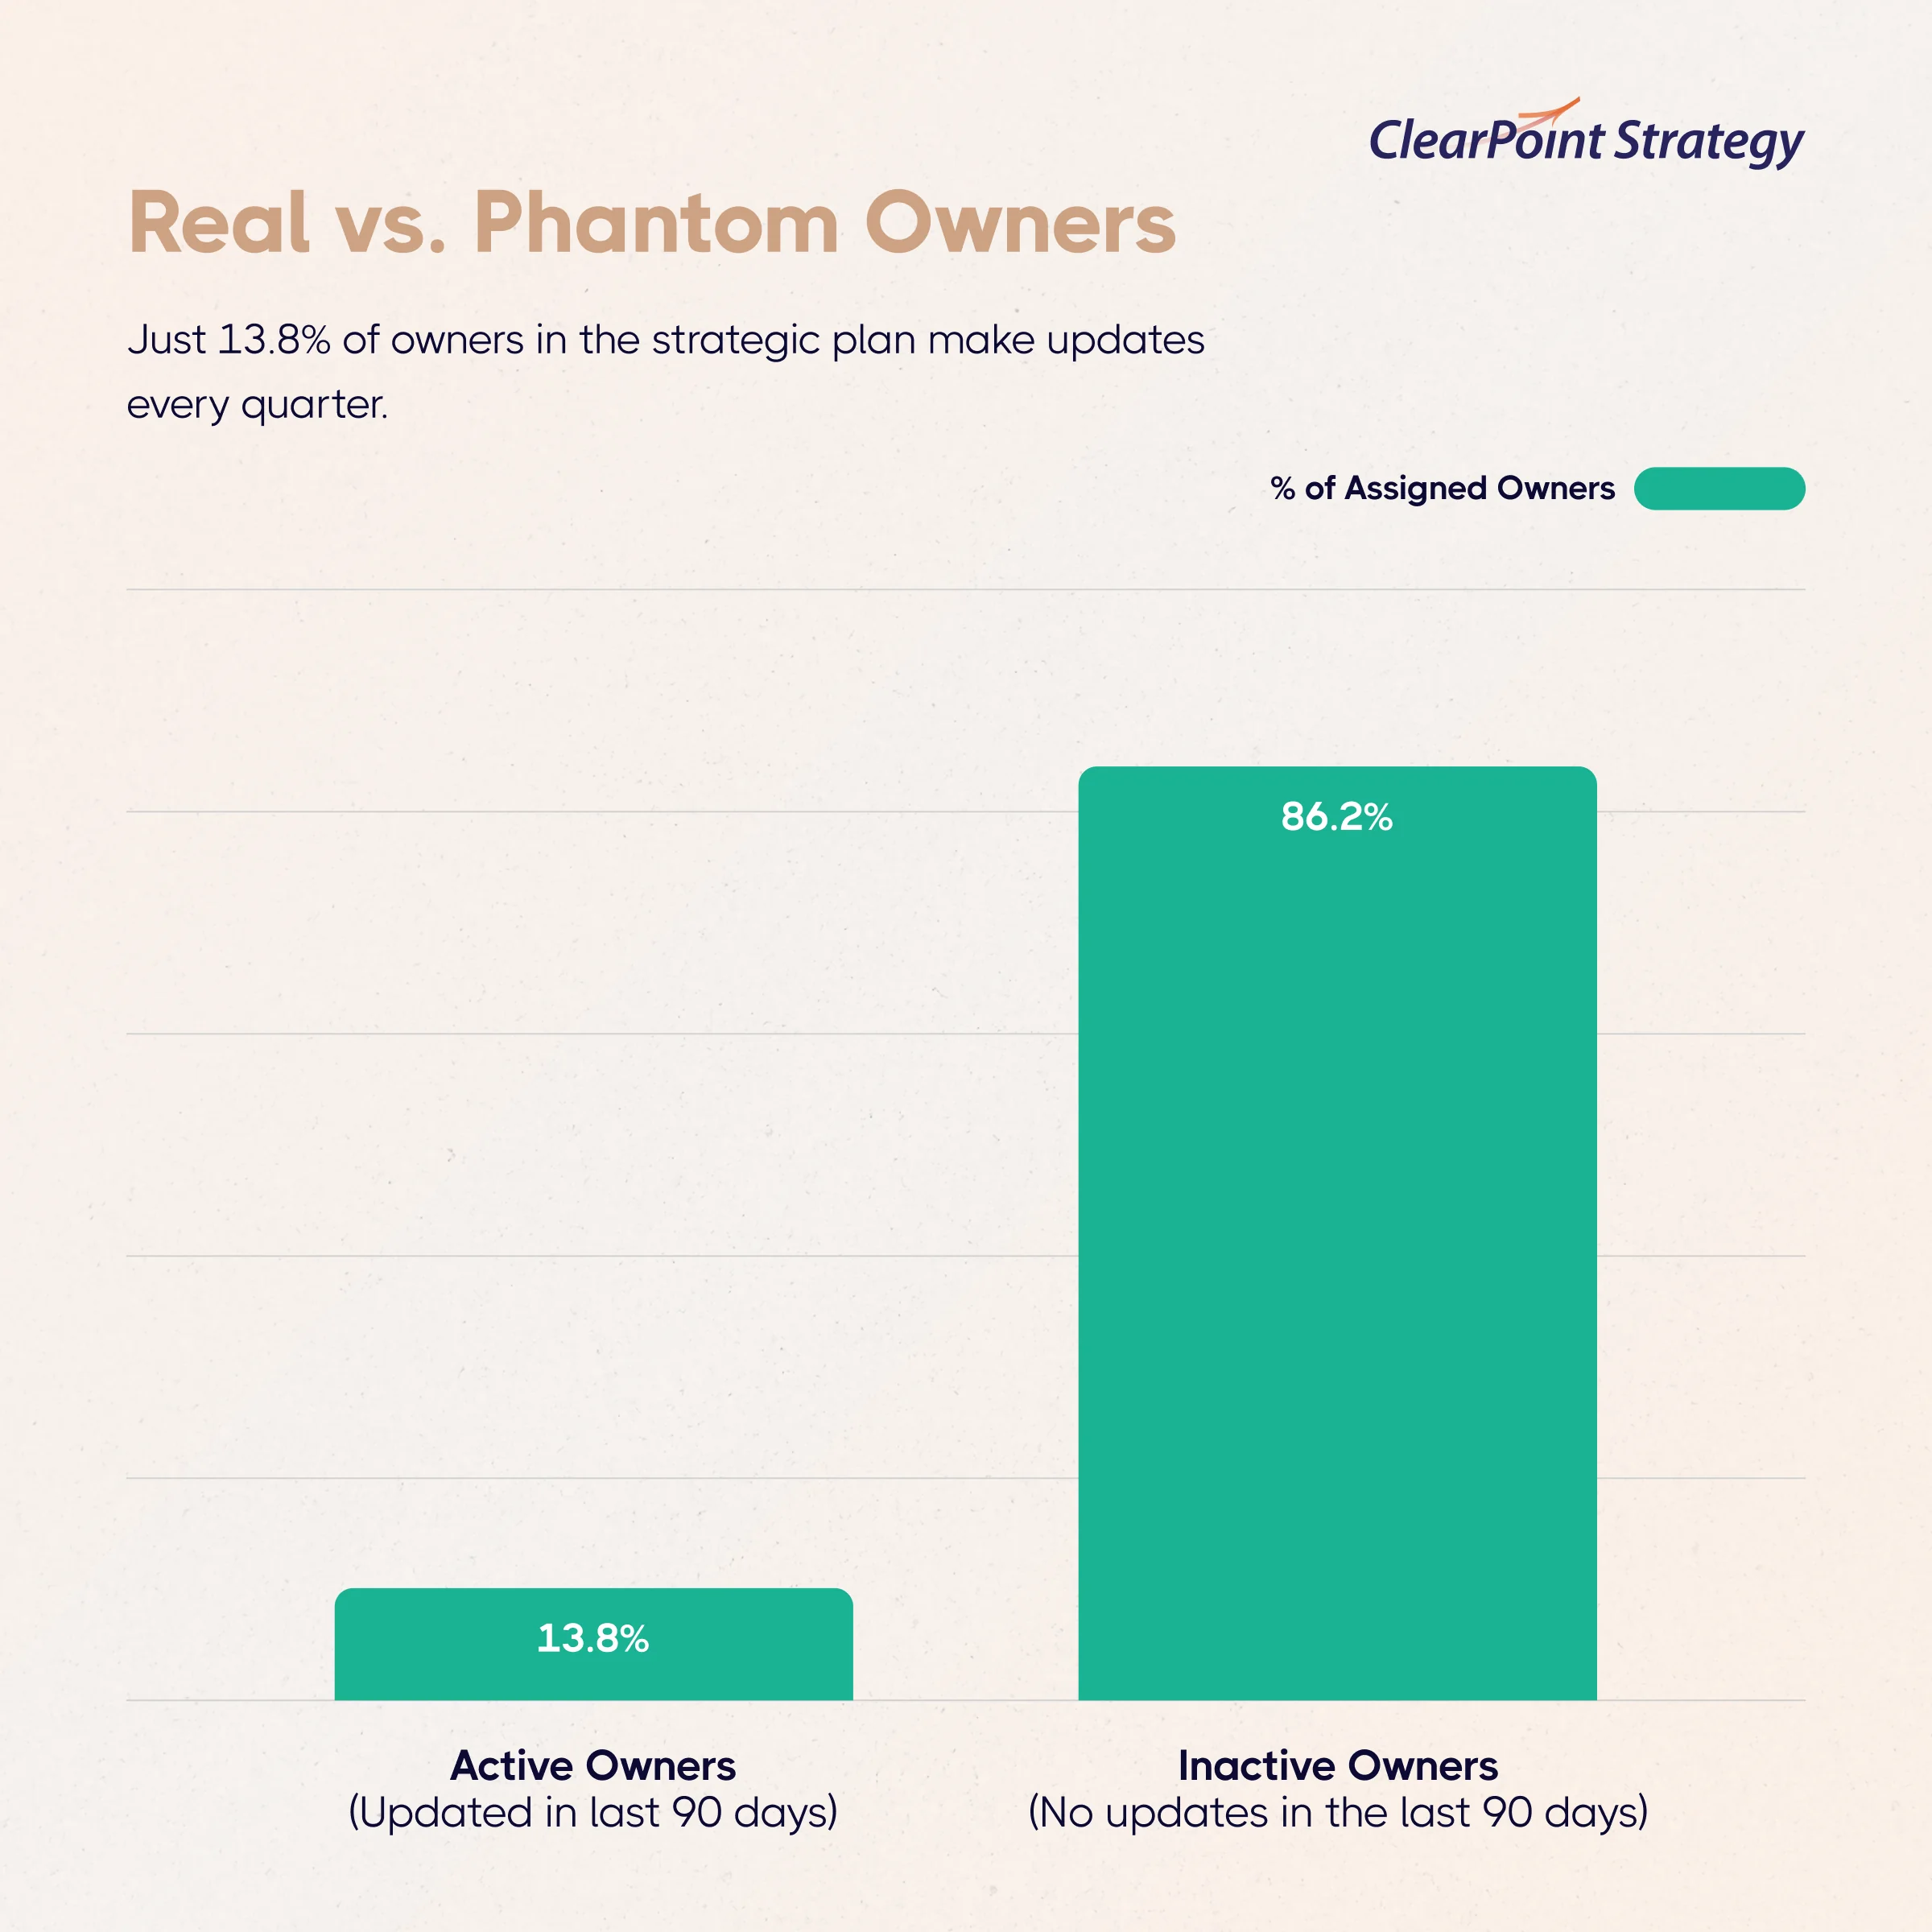
<p style="padding-left: 30px;">✍️ Only <strong>13.8% of assigned owners are active</strong> (have made updates in the last 90 days)</p>
The Balanced Scorecard’s four perspectives give you a powerful structure for thinking about strategy. They don’t, by themselves, solve execution.
The Strategy Success Formula
The data from these plans points to five levers that, together, determine whether a Balanced Scorecard runs or sits on a shelf:
<p style="text-align: center; font-size: 120%;"><strong>Success = Focus × Ownership × Measurement × Flow × Team</strong></p>
This formula is intentionally multiplicative. A BSC that scores well on four levers but fails on one still underperforms. Strong measures don’t save a plan with no owners. Clear ownership doesn’t rescue a portfolio that’s three times too large to govern.
The goal isn’t to improve everything at once. It’s to find your weakest lever and pull it first.
Lever 1: Focus — Your BSC Is Probably Too Big
The Balanced Scorecard’s four-perspective structure — Financial, Customer, Internal Process, Learning & Growth — is a feature. It becomes a bug when teams fill each perspective to the brim.
The data on this is unambiguous:
- Plans with fewer than 20 total elements (goals, projects, measures, milestones) succeed 68% of the time.
- Plans with 60 or more elements succeed just 8% of the time.
Here’s the sweet spot across high-performing plans:
- 5–9 goals
- 9–11 measures
- 5–8 projects
- 15–20 milestones
Not per perspective. Total.
For a BSC, that means roughly 1–2 goals per perspective with 2–3 measures each.
👉Before your next planning cycle, count your total BSC elements. If you’re above 40, cut before you improve anything else.
Lever 2: Ownership — The Biggest Gap in Most Scorecards
The Balanced Scorecard explicitly links strategic objectives to the people and processes responsible for delivering them. In practice, that linkage breaks down fast.
The data:
- 74.3% of active strategic goals have no named owner.
- 71% of measures lack an assigned owner.
- 68.2% of milestones lack an assigned owner.
It gets worse when you look at the owners who are assigned:
- Only 13.8% are active (updated in the last 90 days)
- 86.2% are inactive — ownership exists on paper, not in practice
Goals with active owners see a 12% boost in completion rates. Across a full BSC portfolio, that’s the difference between a plan that drifts and one that delivers.
👉Assign one owner to every element — not a department, a person — and enforce the 90-day update rule.
Lever 3: Measurement — Fewer, Decision-Grade Signals
The BSC framework was designed to balance financial lag indicators with the operational, customer, and learning lead indicators that drive them. That balance is the point.
More measures don’t improve the balance. They obscure it.
Across the dataset:
- Median: 9 active measures per plan
- Average: 24.7 active measures per plan
The gap between median and average reveals the problem. Large organizations stack measures — creating the appearance of accountability without the substance. When owners are responsible for updating 30+ measures on a quarterly cadence, most of those updates become stale or symbolic.
The high-performing target is roughly two measures per goal. Enough to tell a complete story. Small enough to actually govern.
👉Keep only measures that pass this test: Is it understandable to leadership? Can it be updated reliably? Does it trigger a decision about resources, scope, or timing? If the answer to any of those is no, that measure belongs in an operational dashboard, not the strategic scorecard.
Lever 4: Flow — The Calendar Undermines More Scorecards Than Strategy Does
Even well-structured BSCs with clear ownership and lean measurement fail when the delivery calendar creates predictable bottlenecks.
The data shows a consistent pattern across all 20,582 plans:
- January sees 8.5x more project starts than December.
- 29% of all projects have end dates in December.
- 18% close in June — no other single month exceeds 10%.
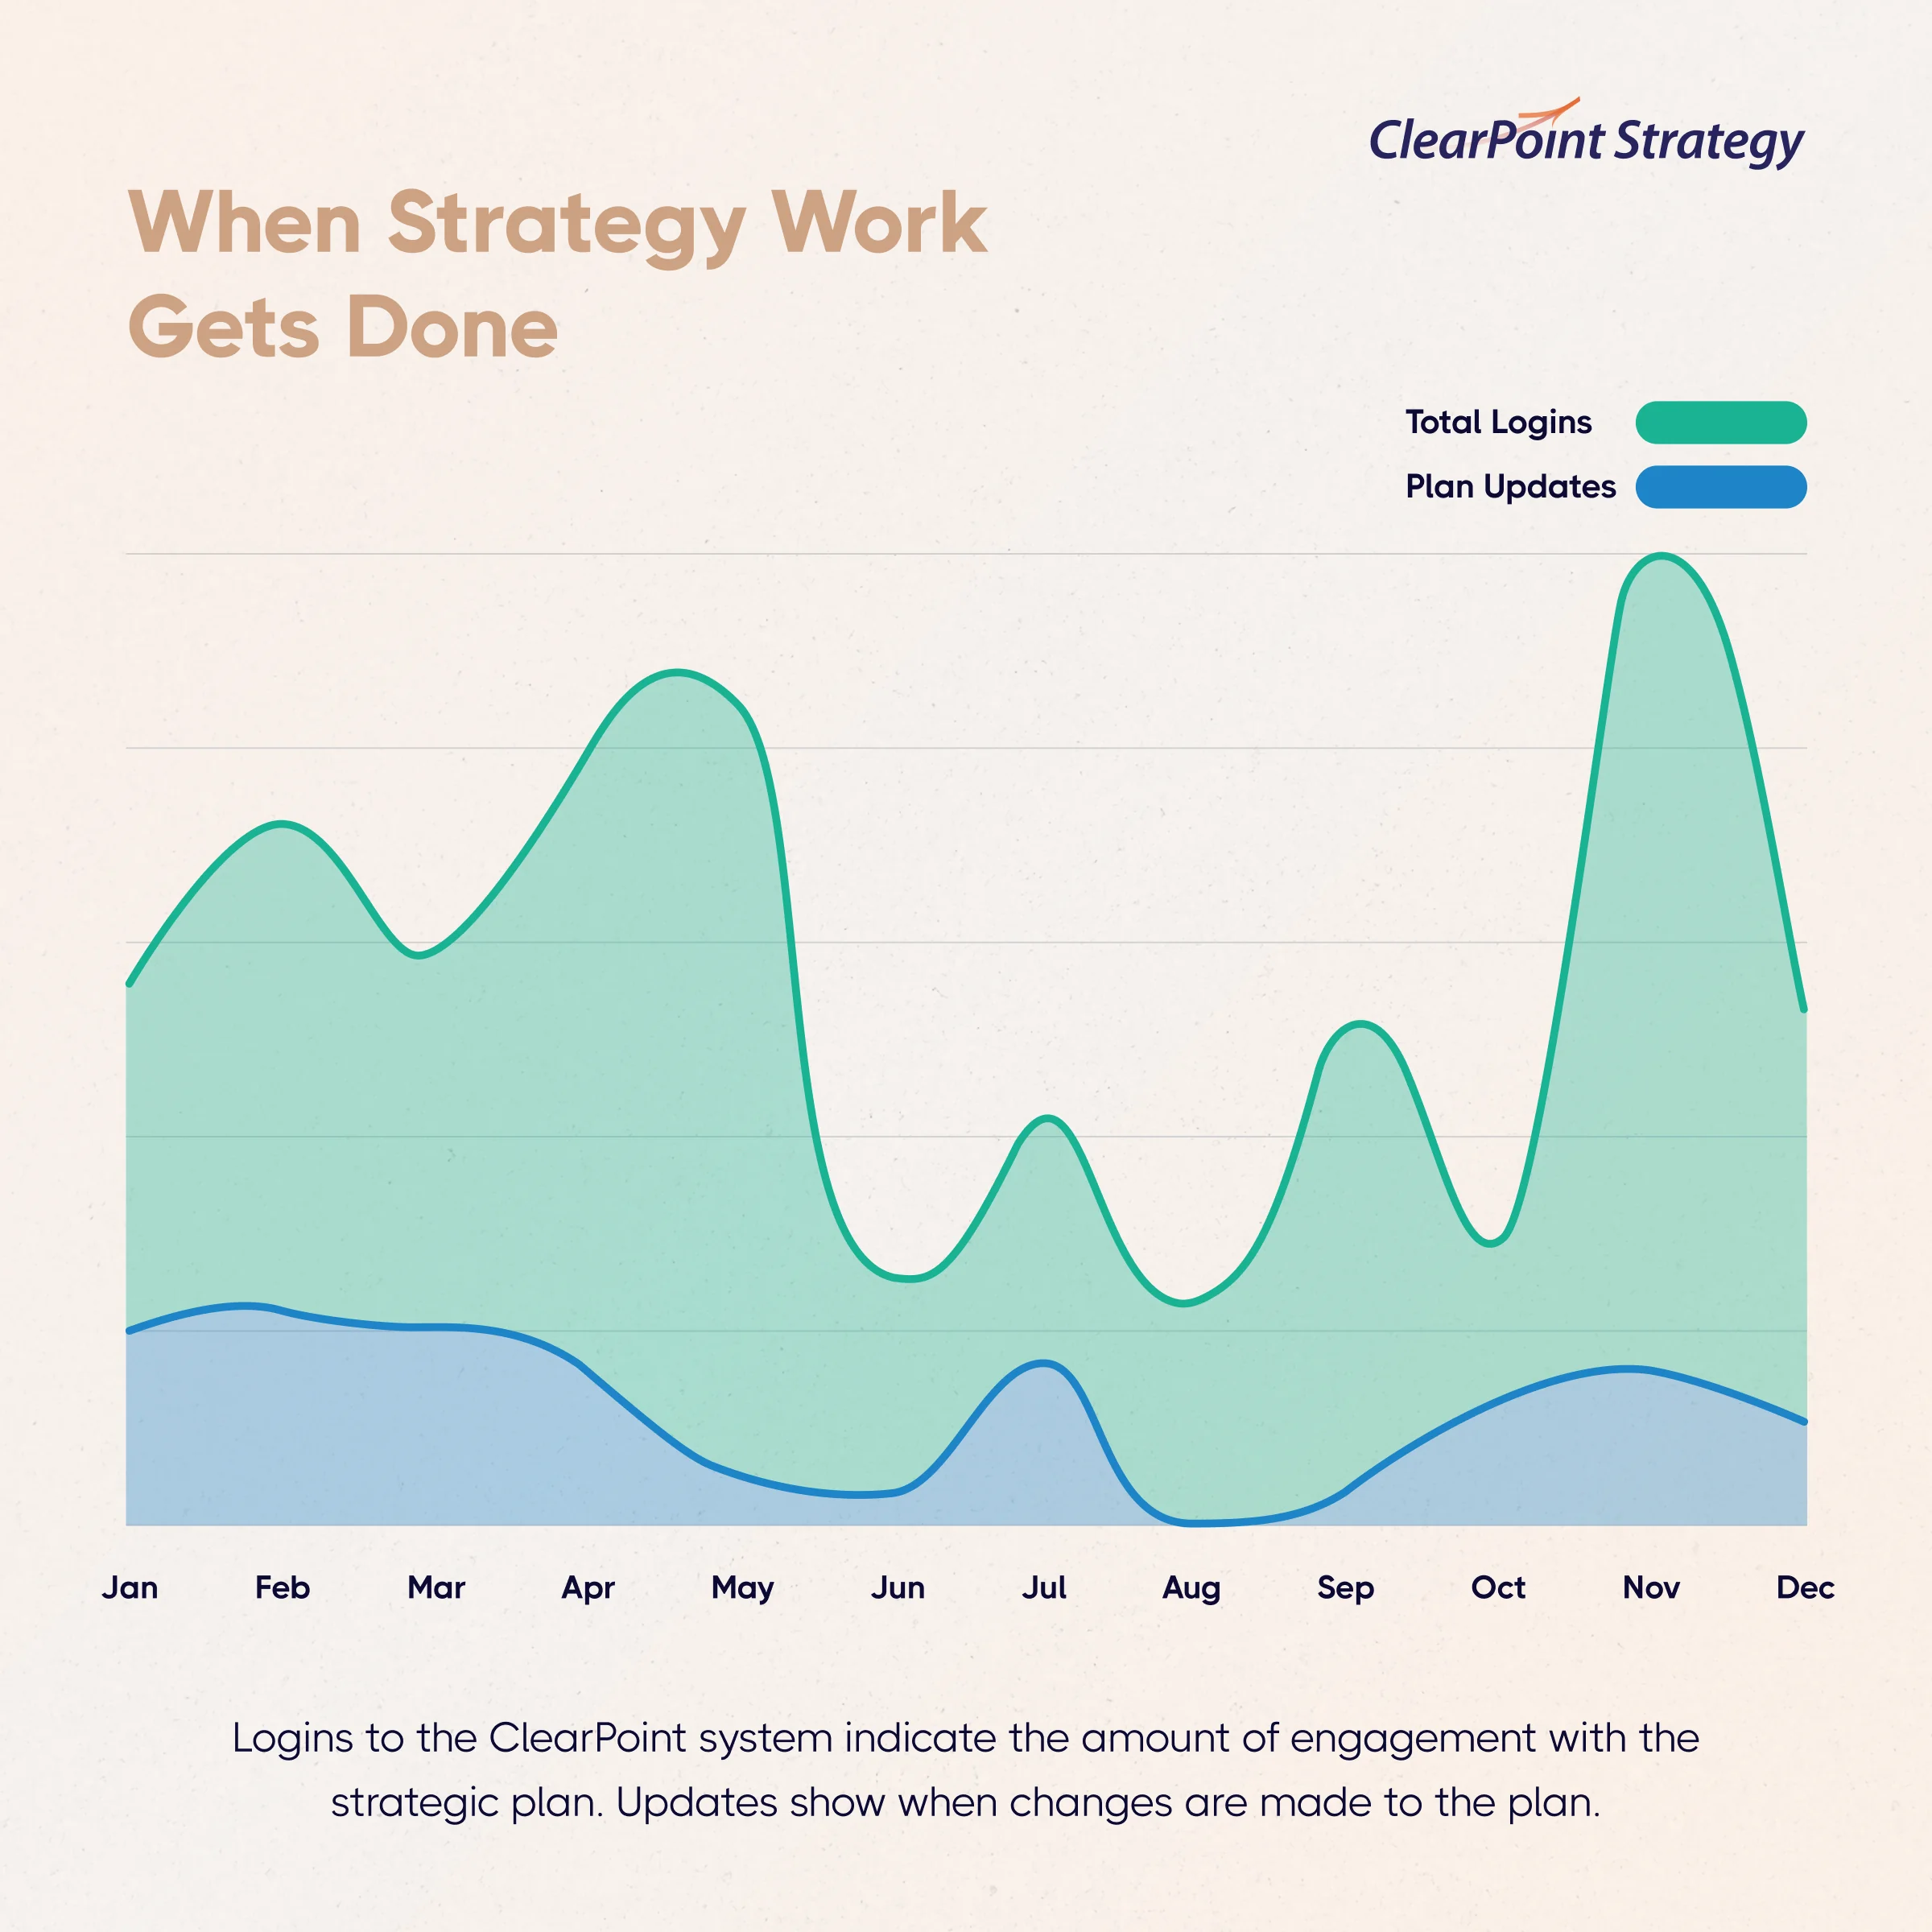
The result is a scorecard that launches with momentum, slows in summer, and scrambles to close everything at year-end.
For BSC users who report to boards or executive teams, that year-end crunch is particularly visible — and particularly costly.
The BSC’s quarterly review rhythm is one of its most valuable features. But it only works if delivery is actually flowing across the year, not stacked at fiscal boundaries.
👉Map every project and milestone across the calendar. Rebalance overloaded months. The quarterly review should surface progress — not prompt a fire drill.
Lever 5: Team — Execution Needs People, Not Just Perspectives
The Balanced Scorecard doesn’t execute itself. It needs a team behind it.
The data shows this more starkly than most organizations expect:
- Nonprofits average 3.03 collaborators per plan and complete just 5.29% of projects.
- Energy & Utilities average 4.9 owners per initiative and lead all sectors at 25.81% completion.
- Professional Services average 17.3 collaborators per plan and underperform at 9.05% completion.
The Professional Services number is the most instructive.
Large teams with diffused accountability don’t outperform small teams with focused ownership. They underperform them. Collaboration that doesn’t translate into clear individual accountability is coordination overhead, not execution capacity.
The BSC works best with a lean strategy pod, one that’s small enough to move but senior enough to make decisions — not a committee that reviews the scorecard quarterly but a group of owners who are actively working it.
👉Name the pod, give it a clear charter, and make monthly updates non-negotiable.
What the Top 5.7% Are Doing Right
The highest-performing organizations in this dataset — those completing 75% or more of their strategic projects — aren’t using a different framework. They’re using the same BSC structure with tighter execution discipline.
<div class="index-cards"><div class="index-card"><div class="index-card-content"><p>Three things consistently separate them:</p><ol><li>Their plans are small enough to govern. Every element has a clear path to completion.</li><li>Ownership is real, not symbolic. They assign one person per element and enforce the 90-day update rule.</li><li>Reviews are quarterly, not annual. The scorecard is a live management tool not a year-end ritual. </li></ol></div><div></div>
The Balanced Scorecard’s logic is sound. The data just shows it only pays off when the execution infrastructure is in place to run it.
ClearPoint Solves the Execution Gap
You didn’t choose the Balanced Scorecard by accident — you chose it because you wanted a clear, connected view of how every initiative drives your outcomes.
But as the data shows, structure alone isn’t enough.
The difference between a Balanced Scorecard that delivers and one that drifts comes down to execution infrastructure — tools, workflows, and accountability systems that keep strategy alive. That’s exactly what ClearPoint Strategy was built for.
Every feature is designed to reinforce the five levers of successful execution:
- Focus: ClearPoint makes it easy to build lean, right-sized scorecards — surfacing what matters most instead of overwhelming teams with noise.
- Ownership: Automated reminders, update tracking, and individual assignments ensure every goal, measure, and project has a real person accountable for progress.
- Measurement: Decision-grade reporting turns KPIs into action signals, connecting real-time updates directly to leadership dashboards.
- Flow: Integrated scheduling and automated status cycles smooth the calendar curve — keeping momentum consistent quarter after quarter.
- Team: Multiple users can update shared plans in real time, add context through discussion threads or annotations, and see linked dependencies across departments so teams stay aligned.
In short, ClearPoint Strategy closes the gap between knowing what to do and actually doing it.
The Balanced Scorecard gives you the framework — ClearPoint gives you the system to make it work.
See how it works and start improving execution today.
<p style="font-size:80%;"><em>Data sourced from ClearPoint Strategy’s 2026 Strategic Planning Report, which analyzed 31.2 million rows of activity data from 20,582 strategic plans spanning 2017 to 2024.</em> <em>Download the full 2026 Strategic Planning Report for complete benchmarks, methodology, and industry comparisons.</em></p>

%20OKRs%20Meaning%20A%20Practical%20Guide.png)