
![How To Do Strategy Execution Like The Top 1% [DATA]](https://cdn.prod.website-files.com/637e14518f6e3b2a5c392294/6943dc61ad7ba3aa1e7a00ae_how-to-do-strategy-execution-like-the-top-data-blog-header.webp)
![How To Do Strategy Execution Like The Top 1% [DATA]](https://cdn.prod.website-files.com/637e14518f6e3b2a5c392294/688a2e9e7c35a603fab4b409_Dylan_Miyake_1.webp)
Discover what separates the top 1% of organizations that complete 93% of their strategic projects—and learn five data-backed principles to master strategy execution in
Here's a number that should keep every strategy leader up at night: 83%.
83 as in: 83% of organizations complete less than 25% of their strategic projects.
Think about that for a moment. Eight out of ten organizations are failing to finish three-quarters of what they set out to do.
And yet, there's this other number that tells a completely different story: 5.7%.
5.7% of organizations average 93% completion on their strategic projects.
They're not just good at execution—they're systematically excellent at it.
For the past seven years, we've been sitting on a dataset that most strategy consultants would give their left arm to see. Over 31 million rows of anonymized data from 20,582 strategic plans, tracking 117,547 goals, 317,809 measures, and 130,324 projects from 2017 to 2024. And what this data reveals isn't just interesting—it's actionable.
The gap between the top 1% and everyone else isn't about vision or ambition. It's about five specific, measurable behaviors that separate elite execution from strategic failure.
And here's the thing: They're all teachable.
Want all the insights in full detail? Download the 2026 Strategic Planning Report here.
Why Most Strategic Plans Are Just Expensive Wish Lists
I've spent enough time looking at strategic plans to know that most of them look pretty impressive in PowerPoint. Beautiful slide decks, ambitious goals, inspiring mission statements. But when you actually track what happens after the presentation ends, most plans become what I call "shelf-ware"—something that sits on a shelf (physical or digital) gathering dust while everyone goes back to their day jobs.
The data backs this up in painful detail. When we looked at how organizations track their strategic work:
- 74.3% of strategic goals have no owner assigned. Not "the wrong owner" or "unclear ownership"—literally no one is responsible.
- 86.2% of assigned owners haven't updated their work in the last 90 days. They're essentially names on a page with no actual accountability.
- 22% of measures never even get started. Organizations track them in their system but never collect a single data point.
This isn't a technology problem. This isn't even a strategy problem. It's an execution system problem. And the organizations in the top 1% have figured out how to solve it.
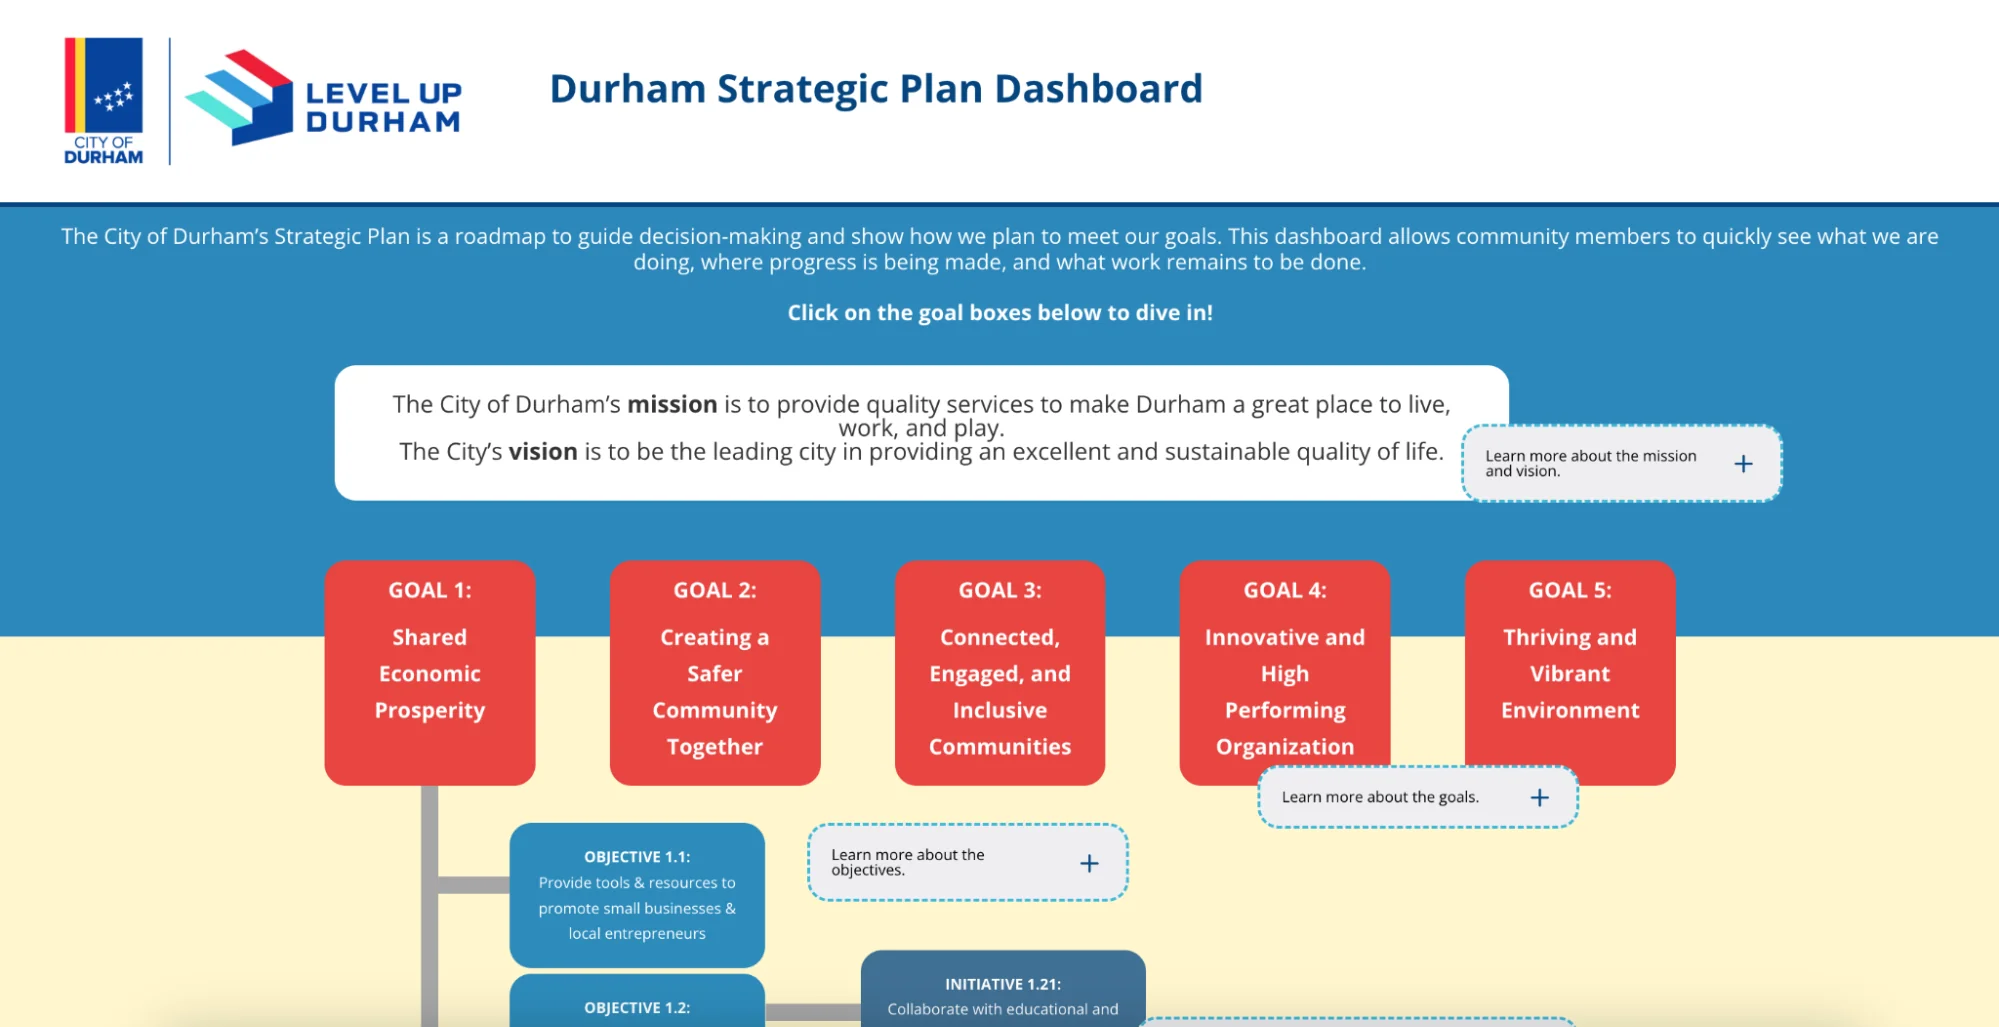
Durham's Journey: From Excel Hell to Data-Driven Governance
Leaders of Durham, North Carolina launched the first strategic plan in the city's 150-year history in 2011. They had ambition, they had community buy-in, and they had over 500 performance measures they needed to track.
The first implementation was... a learning experience.
Despite having software to manage their strategic plan, most staff reverted to Excel within a year. Why? Because there was no clear ownership, no accountability structure, and nobody knew how their data was actually being used.
Sound familiar?
But here's where it gets interesting. Instead of giving up, Durham's leadership asked a different question in 2014: "What does a truly data-driven organization actually look like?"
They assembled a cross-functional team, reimagined their entire performance management structure, and implemented what we now recognize as the five core principles of elite execution.
As a result, Durham now:
- Operates with over 100 trained employees actively managing their strategic plan.
- Integrates performance data directly into budget decisions (which has so far produced $1.8 million in savings by eliminating spending that didn't advance strategic priorities).
- Has won multiple national awards.
- Has maintained a triple-A bond rating despite economic challenges.
- Maintains full cooperation between city and county governments.
The difference? They focused on execution fundamentals, not strategic complexity.
The Five Principles of Elite Execution
After analyzing thousands of strategic plans, we've identified exactly what separates the top performers from everyone else. It's not rocket science, but it does require discipline:
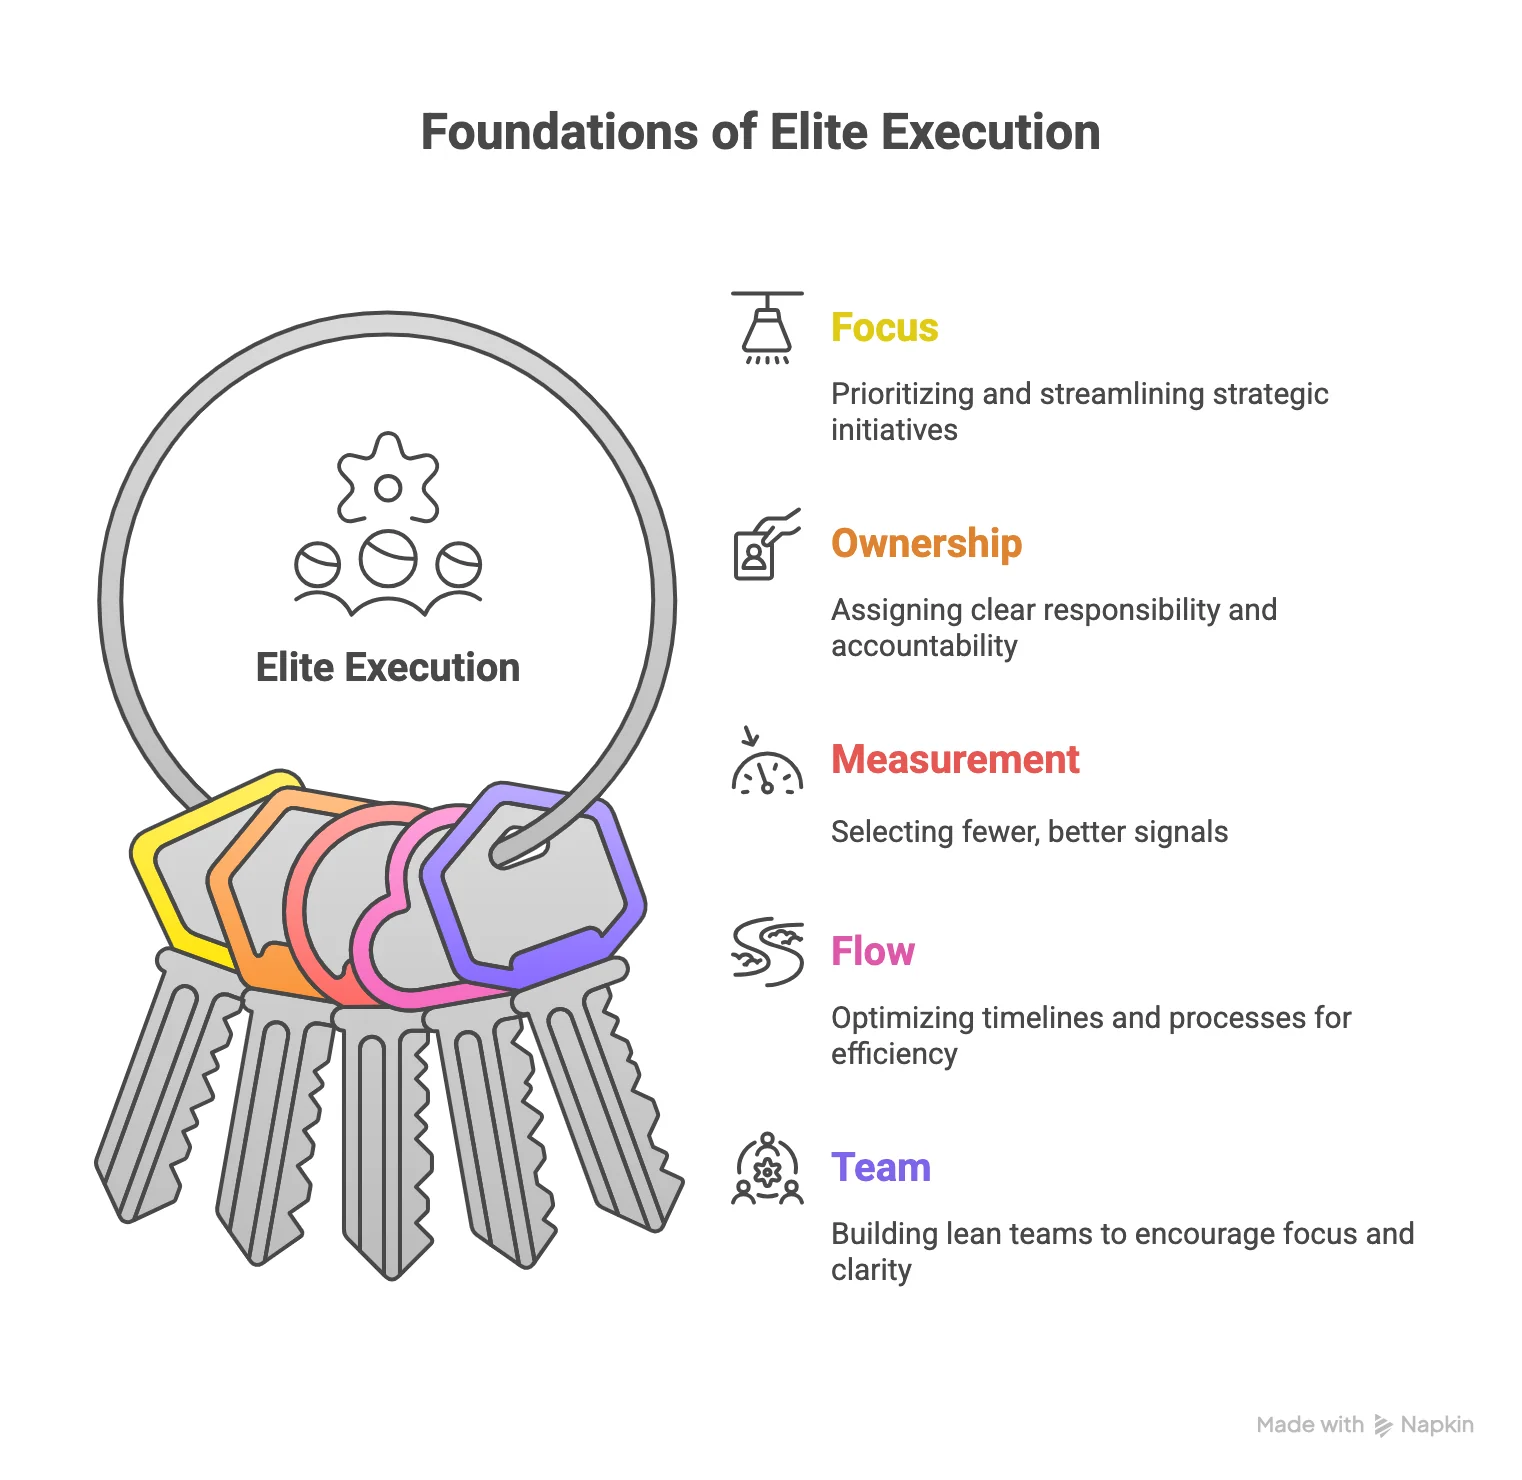
1. Focus: Right-Size the Portfolio
Here's what the data tells us about portfolio size:
Plans with fewer than 20 total elements succeed 68% of the time.
Plans with 60 or more elements succeed just 8% of the time.
The top performers maintain what we call the "optimal portfolio composition":
- 5-9 strategic goals (median: 5)
- 9-11 measures (median: 9)
- 5-8 projects (median: 8)
- 15-20 milestones (median: 17)
Fort Lauderdale learned this lesson the hard way. When they launched "Press Play Fort Lauderdale" in 2013, they started with 12 goals, 38 objectives, 191 initiatives, and 142 key performance indicators. Their management system involved cross-departmental meetings with over 100 staff members every two months.
The result? Limited collaboration and increased frustration. Too many initiatives meant nothing got the focused attention it needed.
According to Kristin Tigner, their Structural Innovation Manager, the breakthrough came when they adopted a "simplify, excel, and expand" approach. Instead of trying to do everything at once, they focused on executing a smaller set of priorities exceptionally well before expanding to new areas.
2. Ownership: Make Names Real
Remember that 86.2% of assigned owners never update their work?
The top 1% treat ownership differently. They follow what we call the "90-day rule": If an owner hasn't updated in 90 days, reassign or remove them.
But it goes deeper than that. The best organizations default each goal, measure, project, and milestone to one owner—not a committee, not a department, a person. And they track two metrics religiously:
- Percentage of unowned elements
- Percentage of active owners
These metrics sit on page one of their strategic plan, visible to everyone.
Carilion Clinic, a not-for-profit healthcare organization in Virginia with 13,000 employees, exemplifies this principle.
When they created scorecards for their provider practices, they ensured each metric had a specific owner—whether it was a department, section, or individual provider. This clear ownership allowed them to link compensation to patient-centered care and accurately track hard metrics tied to their mission.
Darren Eversole, their Director of Finance, notes that having around 300 scorecards managed through ClearPoint has been successful specifically because "everyone is rowing in the same direction, physicians and providers have control of their results as an individual, which contributes to the overall performance of the scorecard."
When ownership is real, accountability becomes automatic.
3. Measurement: Select Fewer, Better Signals
Here's where most organizations go wrong: They confuse comprehensive tracking with effective measurement.
The data shows that the standard is about two measures per goal. The elite performers add a third measure only after two consecutive quarters of on-time reporting.
They also have a ruthless archiving policy: Any measure with two consecutive quarters marked "Not Started" gets archived.
JEA, one of the largest utilities in the country serving 2,200 employees, structures their strategy around focus areas that cascade down to objectives, initiatives, and performance measures.
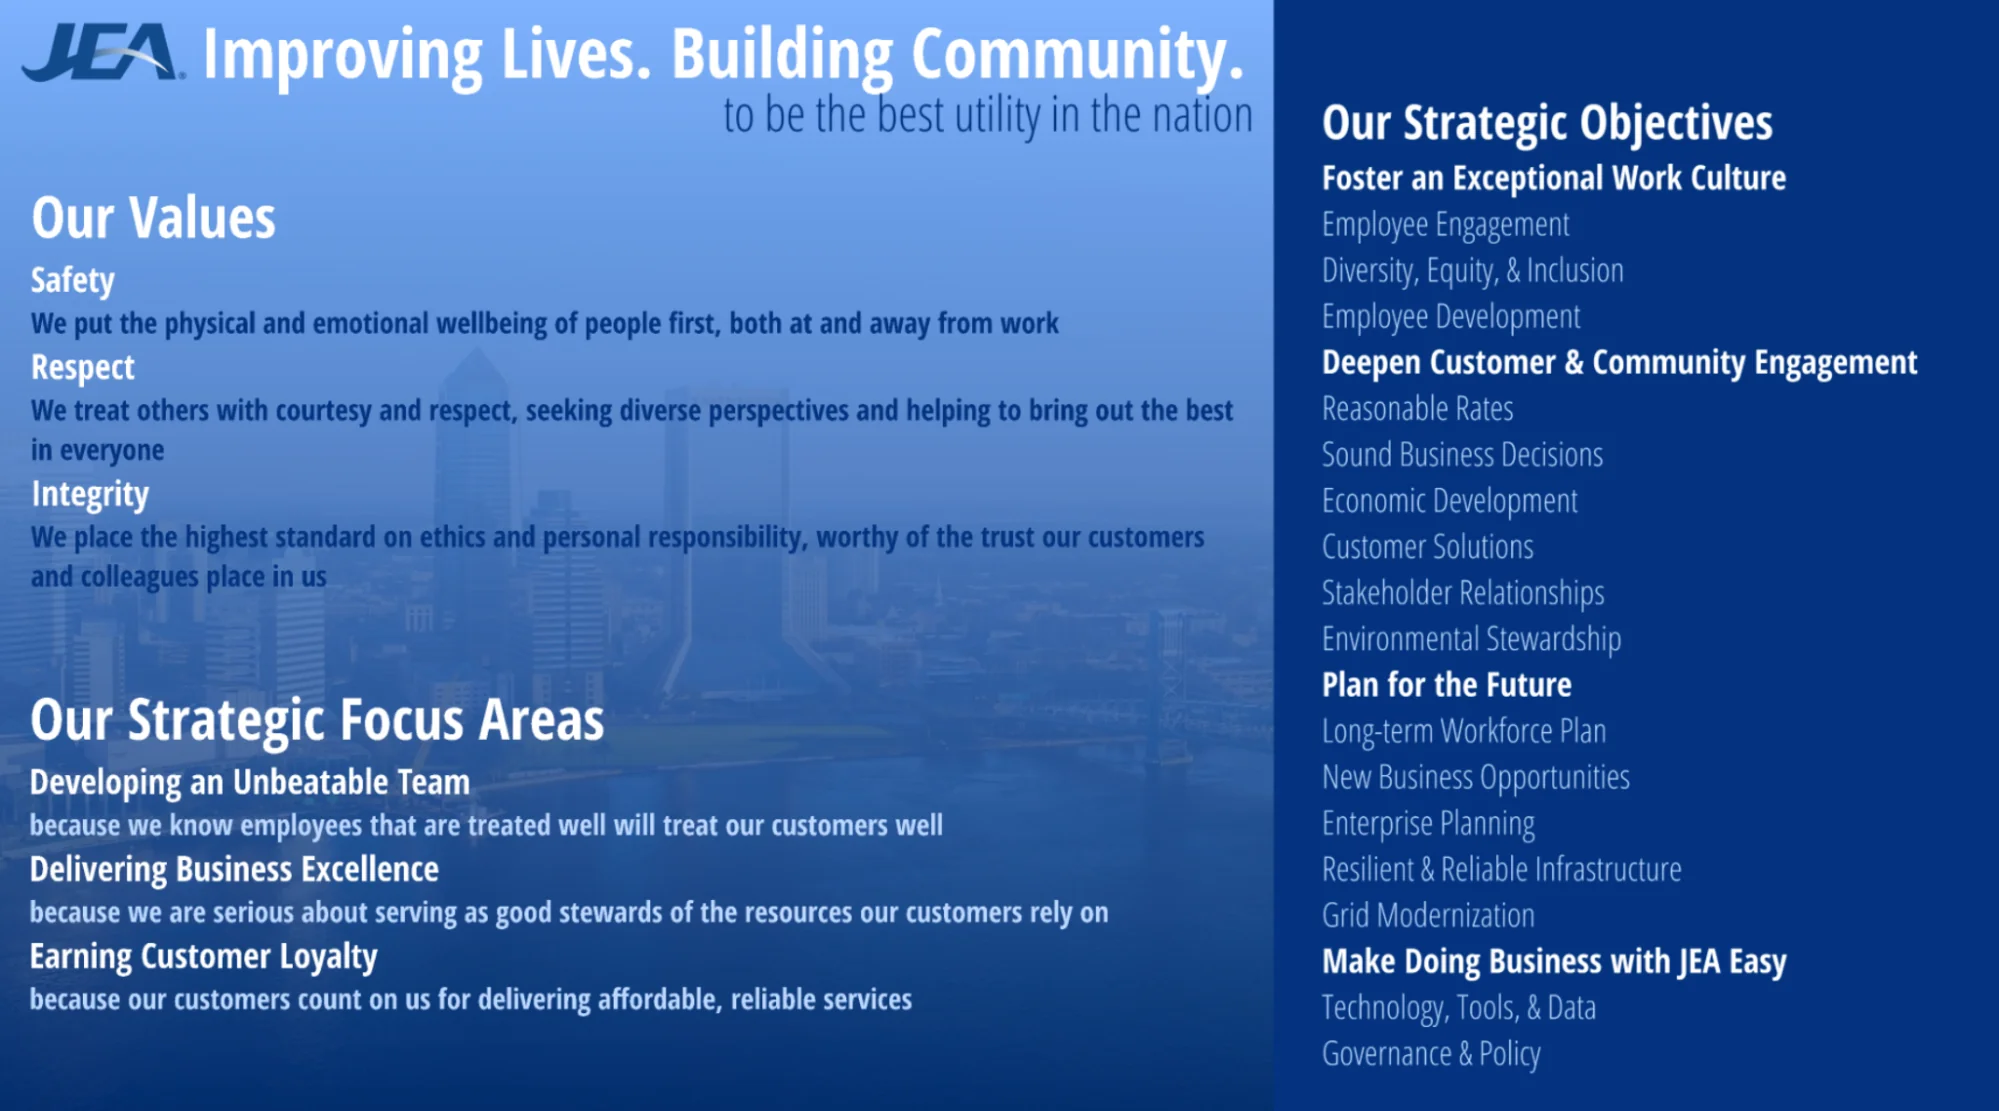
Kendra Cash, their Enterprise Strategy Specialist, explains their philosophy:
"Our day-to-day metrics live in internal systems, but anything related to our strategy lives in ClearPoint. It keeps things clean and eliminates confusion."
By maintaining this clear separation and focusing only on strategic measures, JEA can track hundreds of tasks while keeping leadership focused on what actually matters. Each quarter, they produce comprehensive strategy reports with "more visuals and fewer tables" to tell the story quickly—because measurement isn't about data volume, it's about strategic insight.
4. Flow: Smooth Out the Calendar
When we analyzed project completion dates across our entire dataset, we found something remarkable: 29% of all projects have end dates in December, and another 18% finish in June. No other single month exceeds 10%.
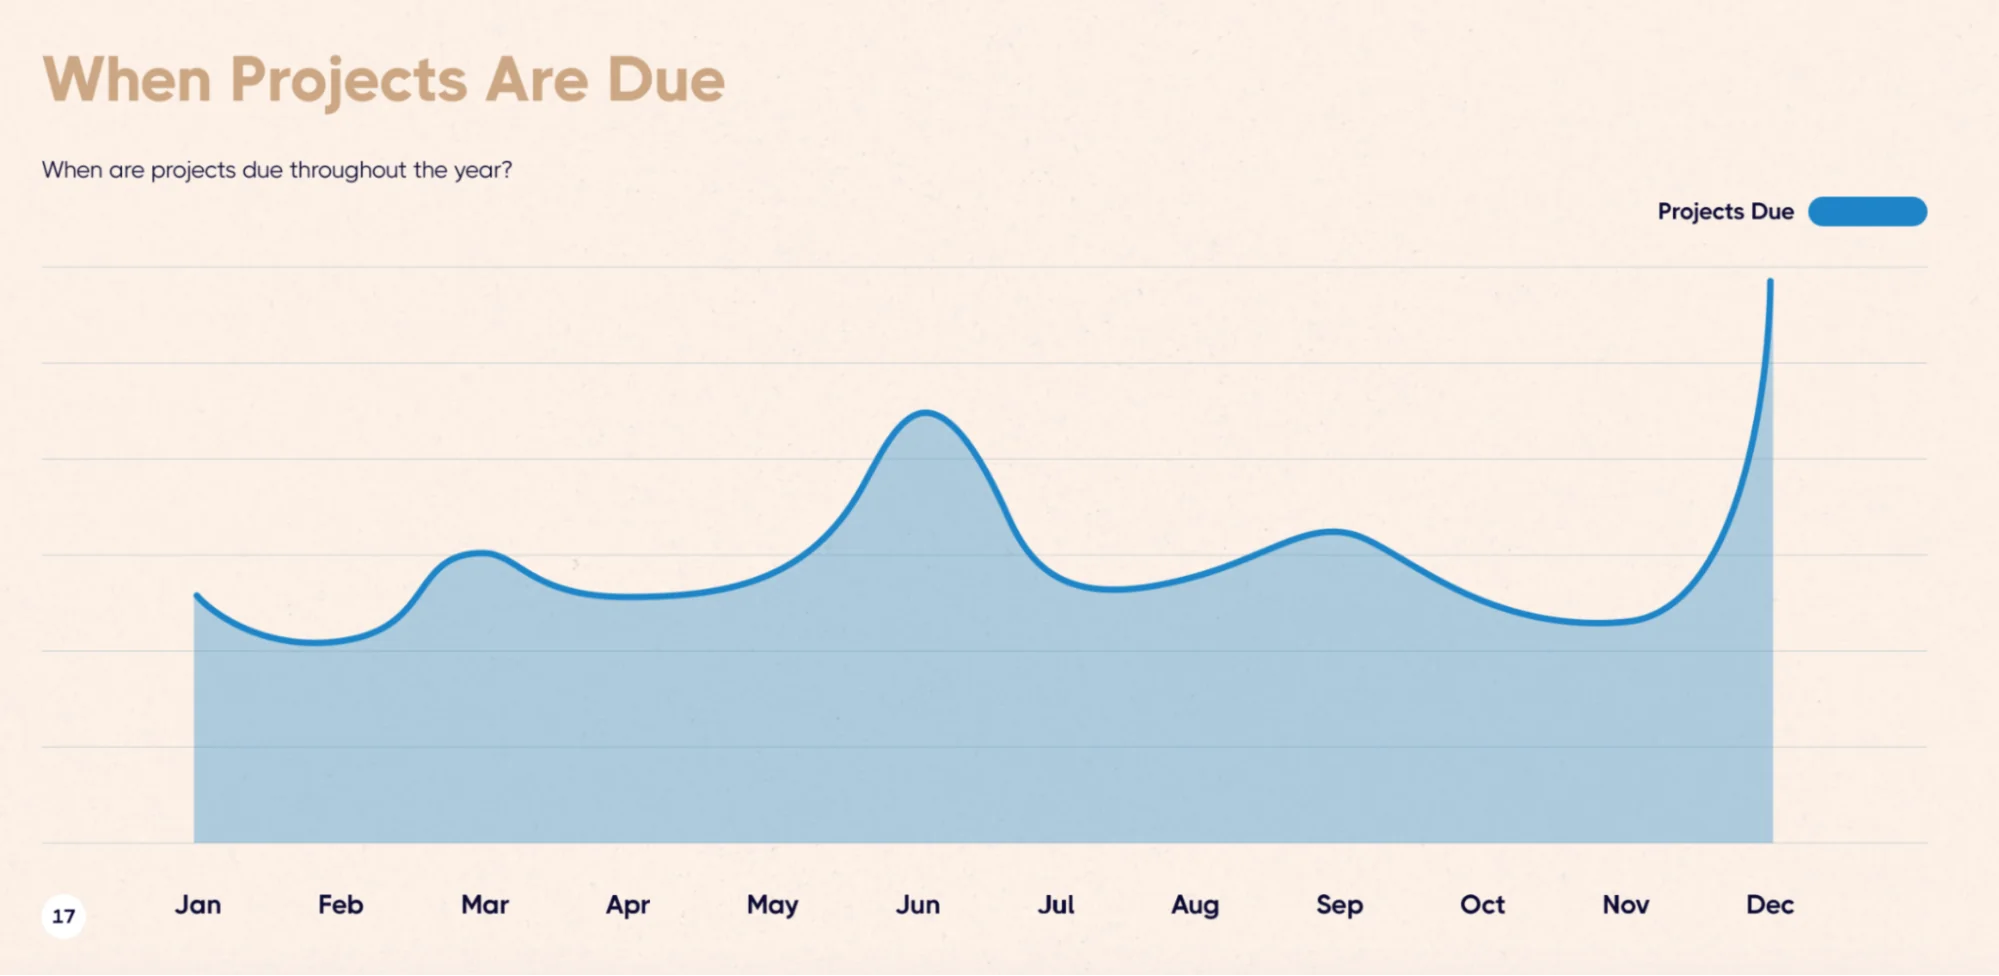
The top performers recognized this creates an execution bottleneck. Their solution?
Set a guardrail: No single month should contain more than 15% of planned finishes. They pull work forward from December and June into Q2 and Q3, creating one mid-quarter finish window per quarter.
This might sound like a minor scheduling adjustment, but it has profound implications. When everyone is trying to finish projects at the same time, resources get stretched, quality suffers, and projects that could have been completed earlier get delayed because the organization is drowning in year-end or mid-year work.
The data also revealed something interesting about project timelines: During COVID in 2020-2021, median project duration dropped to 163 days—cut nearly in half. Organizations could move fast when they had to. But by 2023-2024, project timelines had stabilized back to about one year (364 days).
Ted Jackson, ClearPoint's Co-Founder, interprets this:
"2020-2021 showed us that organizations can move fast—project durations were cut in half. But the shift back to year-long timelines wasn't a regression. It was a recognition: strategic transformation takes sustained, deliberate effort."
The elite performers understand that not every project needs a year to complete, but strategic initiatives do need time to create lasting change. By spreading work evenly throughout the year, they maintain momentum without creating artificial pressure.
5. Team: Lean Pod, Surgical Collaboration
Here's where conventional wisdom and the data diverge completely. Most organizations think bigger teams mean better results. The data says otherwise.
The top performers keep their core "pod" at 10-16 people (owners plus collaborators). They add one collaborator to unblock cross-functional work and reserve two or more collaborators only for defined joint delivery.
Education sector organizations provide a perfect counterexample. They run the leanest teams with an average of just 1.8 owners and 8.2 collaborators per strategic plan—the lowest across all sectors we analyzed. Meanwhile, Professional Services fields the most collaborators at 17.3 per plan with 3.7 owners.
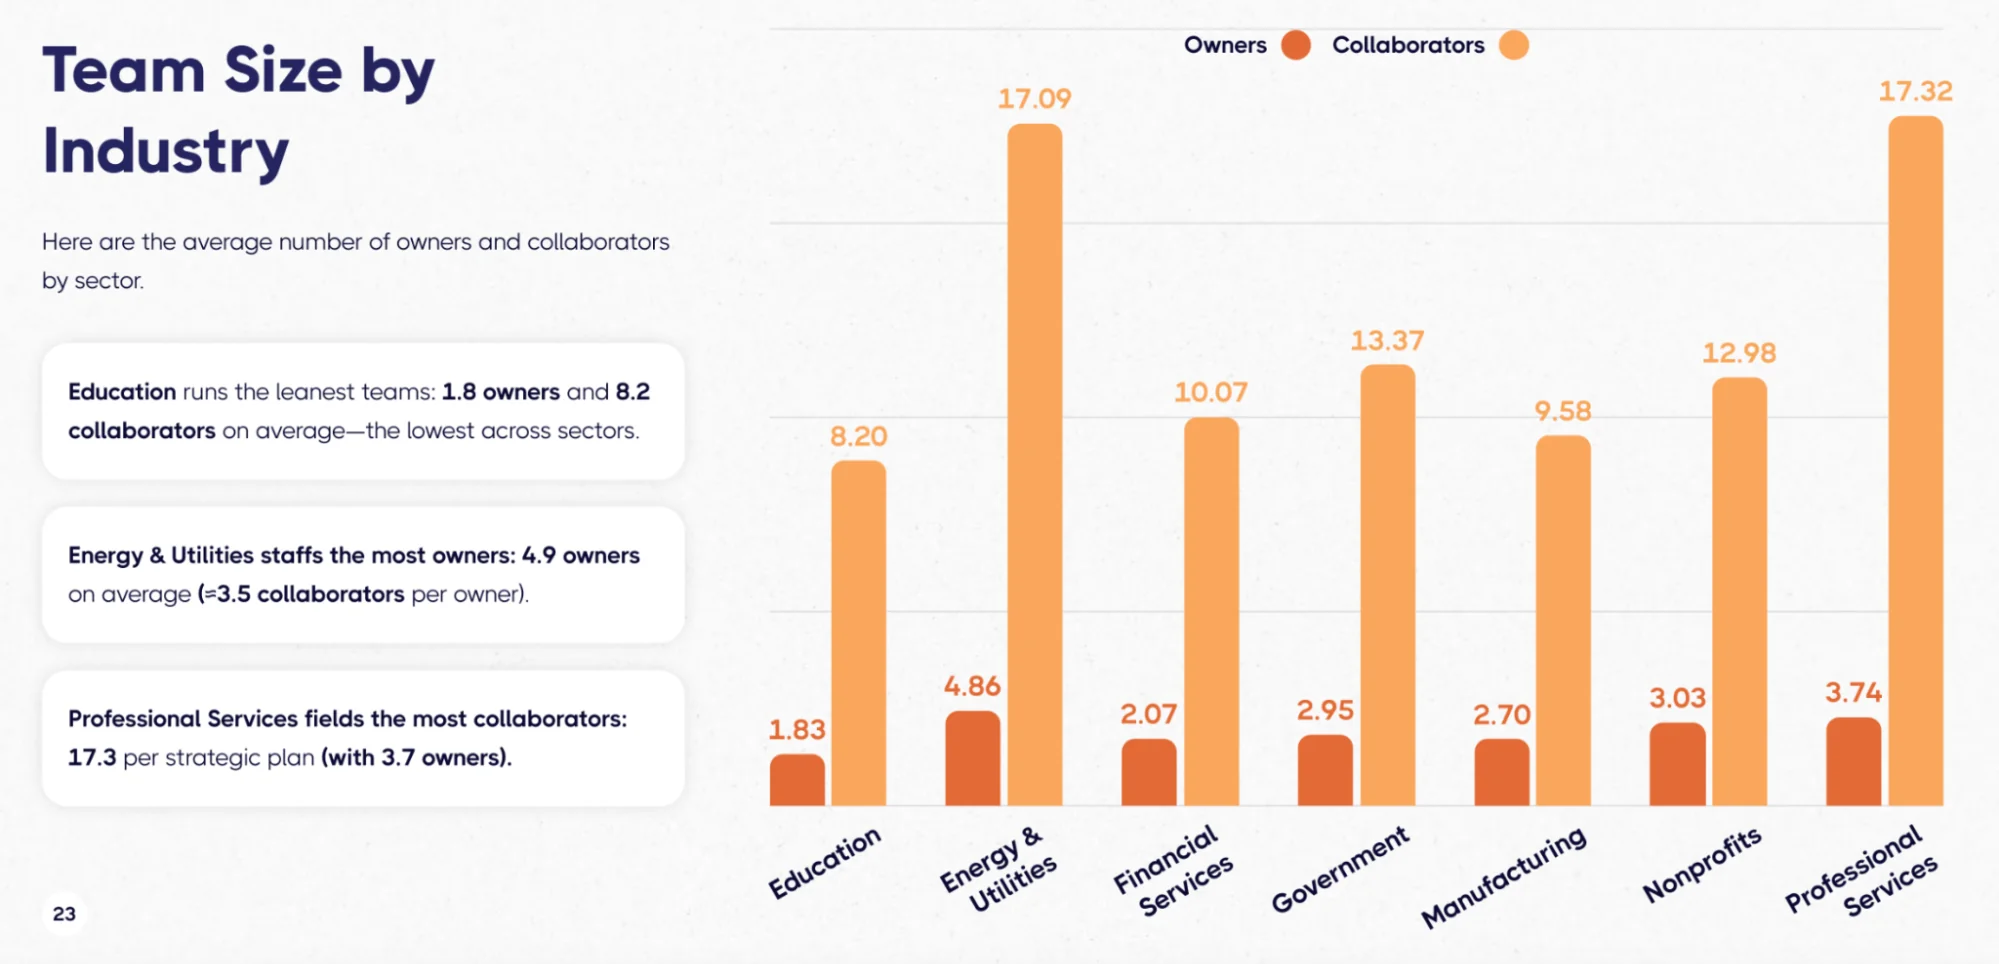
The difference in execution? Education organizations, despite their lean teams, maintain focus and clarity. Professional Services organizations, with their larger teams, often struggle with coordination overhead.
The breakthrough insight from the elite performers is this:
Collaboration isn't about how many people you include—it's about surgical precision in who you include and why.
One of the biggest benefits organizations report is breaking down silos by making cross-functional work visible through collaborator assignments.
The November-February Execution Window
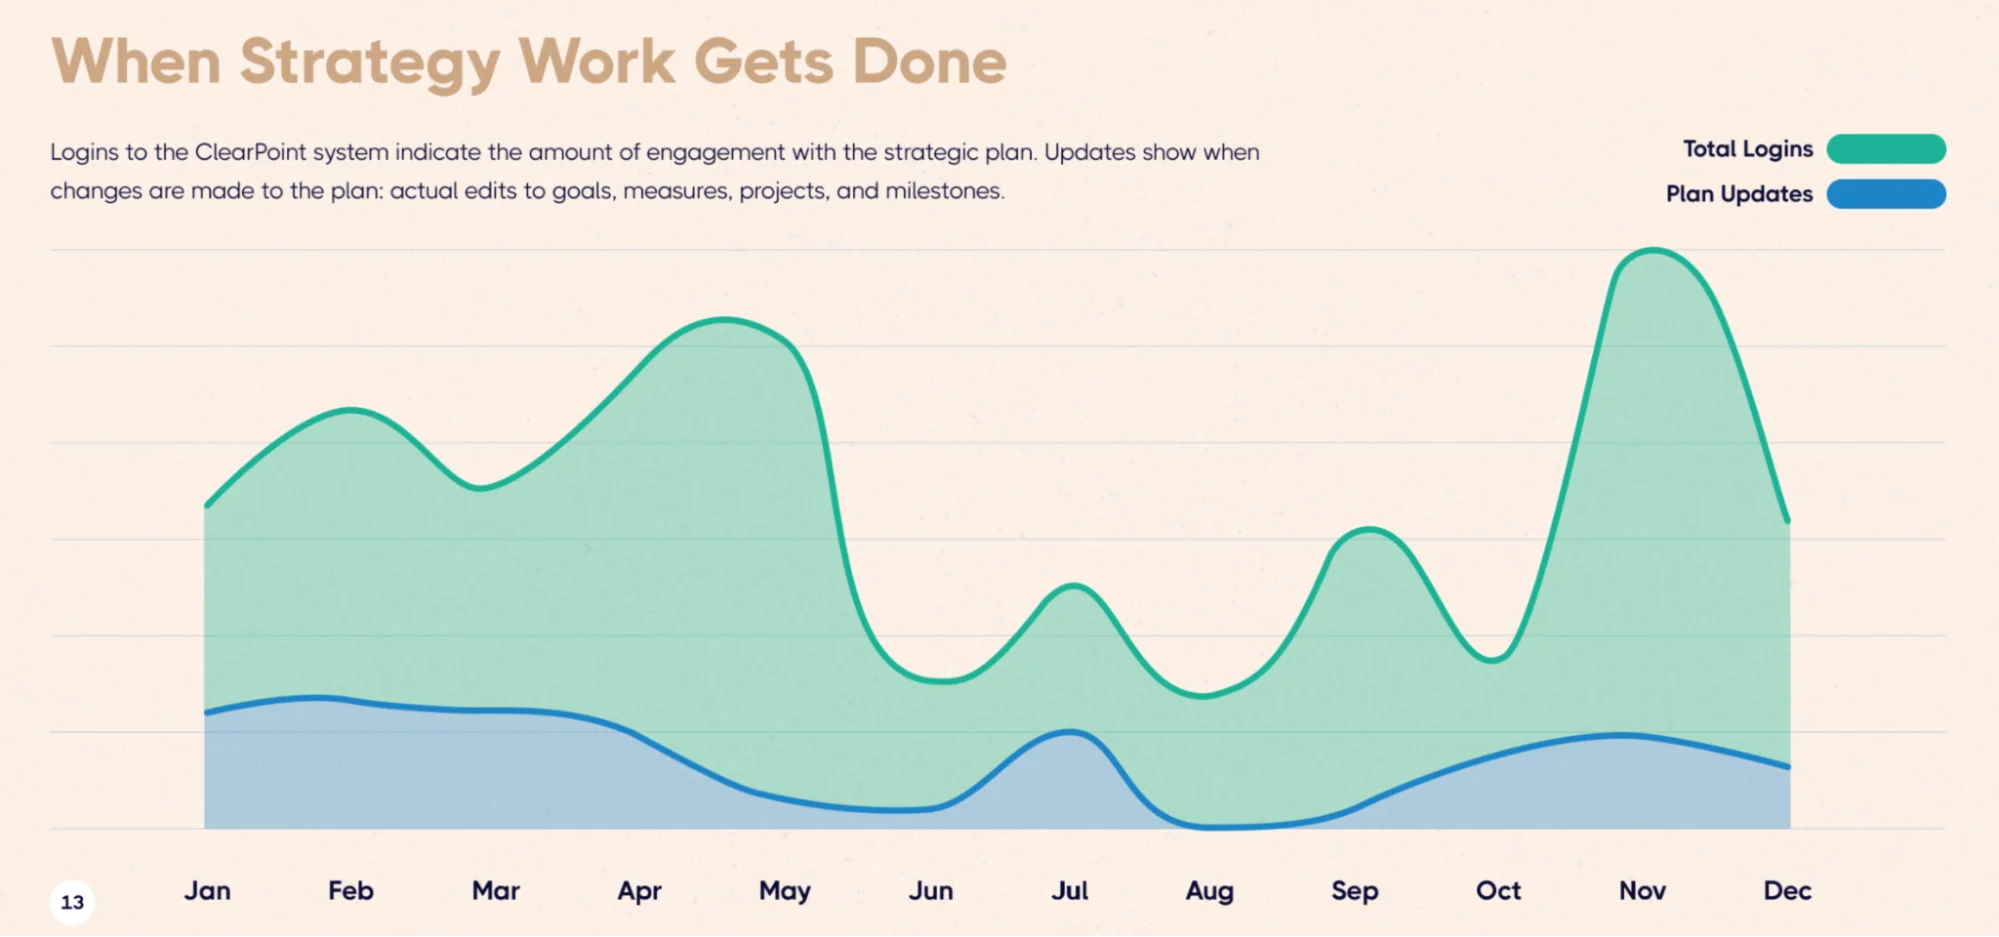
The seasonal data revealed something unexpected about how the best organizations operate. November records the highest engagement of any month—about 44% higher than August—as leaders build next year's strategic plan and ensure a smooth transition.
But here's the critical part:
February records the most updates, with 2,045,105 changes made to strategic plans—about 43.5% higher than August. January launches 8.5 times more projects than December and 1.8 times more than all of Q4 combined.
The top performers aren't just planning in November and December. They're executing a deliberate transition cycle:
- November-December: Building next year's plan, aligning goals, setting targets
- January: Launching projects and making strategic work operational
- February: Peak execution—turning plans into progress
This creates what I call the "November-February execution window"—a four-month period where elite performers transition from strategy to execution while everyone else is still finishing last year's work or slowly ramping up.
Why Industry Doesn't Matter (Much)
One of the most surprising findings in our analysis is how little industry matters when it comes to execution excellence. Yes, there are differences in portfolio size:
- Manufacturing, Non-Profits, and Professional Services set twice as many goals (median of 10) than Governments and Financial Services (5)
- Education tracks the most measures (median of 16)
- Energy & Utilities show the highest milestone intensity (median of 20)
But when it comes to completion rates, the spread is narrower than you'd think. Energy & Utilities leads at 25.81% completion, while Non-Profits are at 5.29%—but even the best industry is only completing about one-quarter of its strategic projects.

The point? Being in the "right" industry doesn't guarantee success, and being in a "challenging" industry doesn't excuse failure. The five principles work regardless of sector because they address fundamental execution dynamics that apply everywhere.
Fort Lauderdale operates in local government. Durham operates in local government. Carilion Clinic operates in healthcare. JEA operates in utilities. They're all in different industries, different contexts, different challenges. What they share is a commitment to execution fundamentals.
The Real Cost of Mediocre Execution
Let me bring this back to that 83% number. When eight out of ten organizations complete less than 25% of their strategic projects, we're not just talking about wasted time or missed opportunities. We're talking about organizational drift.
Every incomplete project represents resource investment with no return. Every unowned goal is strategic intent with no accountability. Every phantom owner is a person going through the motions without impact.
Meanwhile, the top 1% isn't just completing projects—they're building organizational muscle memory. Each completed initiative strengthens their execution capacity. Each measured result improves their decision-making. Each owned goal creates a culture of accountability.
Durham didn't transform overnight. It took them three years from their first struggling implementation in 2011 to their reimagined approach in 2014. But once they committed to execution fundamentals, the results compounded.
Shari Metcalfe, Durham's Strategy and Performance Manager, notes: "A big turning point for our performance management was getting a system that we could use to manage all that data. It's just easier. Less time putting numbers in a system and more time actually looking at the numbers and making decisions based on those."
That shift—from data entry to data-driven decision-making—is what separates the top performers from everyone else.
Building Your Execution System
So how do you actually implement these five principles in your organization? Start with measurement:
Week 1: Audit your current portfolio
- Count your goals, measures, projects, and milestones
- Calculate how many are in the "optimal range"
- Identify which elements have no owner
Week 2: Implement the 90-day rule
- Pull a report of all owners who haven't updated in 90 days
- Reassign or remove them
- Make "% active owners" a visible metric
Week 3: Archive non-starters
- Identify all measures with 2+ quarters of "Not Started"
- Archive them (don't delete—just remove from active tracking)
- Free up your team to focus on what matters
Week 4: Review your calendar
- Map when your projects are due throughout the year
- Identify months over 15% of total
- Move projects to create more even flow
Week 5: Right-size your team
- Count owners and collaborators on each major initiative
- Identify where you're over 16 people
- Be surgical about who needs to be involved and why
This isn't about transformation—it's about tuning. The organizations that excel at execution didn't revolutionize their approach. They implemented basic disciplines consistently.
The Uncomfortable Truth About Excellence
Here's what seven years of data has taught me: Elite execution isn't complicated, but it is uncomfortable.
👉It's uncomfortable to cut goals when everything feels important.
👉It's uncomfortable to remove owners who aren't performing.
👉It's uncomfortable to archive measures you thought you needed.
👉It's uncomfortable to limit collaboration when everyone wants to be included.
👉It's uncomfortable to admit that your current approach isn't working.
But you know what's more uncomfortable? Being in the 83% forever. Watching your strategic plans become expensive wish lists. Explaining to your board why this year's initiatives didn't get finished either. Seeing your team lose faith in the planning process because nothing ever changes.
The top 1% made a choice: They decided that execution fundamentals matter more than strategic ambition. They recognized that finishing 93% of a focused portfolio beats starting 100% of an unfocused one. They embraced the uncomfortable disciplines that create predictable results.
Robin Champ, LBL Strategy's VP of Strategic Foresight, captures this perfectly:
"The top 5.7% of organizations average 93% completion, demonstrating that elite execution is possible, systematic, and institutional. Meanwhile, 83% of organizations complete less than 25% of their strategy—representing the largest untapped performance opportunity in business."
That gap—between possible and actual—represents the opportunity in front of you.
Looking Forward
As I look at this data, I'm reminded that strategy execution is fundamentally a learning journey. Every organization in our top 1% faced setbacks. Durham's first implementation failed. Fort Lauderdale had to simplify their approach. Carilion spent years refining their scorecard system.
The difference is they learned from those setbacks instead of repeating them.
The data doesn't lie: There is a proven formula for execution excellence. Focus × Ownership × Measurement × Flow × Team isn't just theory—it's backed by 31 million rows of data from 20,582 strategic plans.
But here's the final insight: Reading about these principles changes nothing. Implementation is everything.
So where will you start? Will you audit your portfolio this week? Will you implement the 90-day rule? Will you archive those non-starter measures?
Or will you stay in the 83%?
The data says the choice is yours. And unlike most strategic challenges, this one has a clear, proven path forward.


