

Use the data we mined from 20,000+ real strategic plans to improve your strategy execution in 2026.
From talking to our customers about strategy day in and day out, we know how hard it can be to turn business plans into reality. The data bears out this fact: Only 12.5% of strategic projects are ever completed. Not only does this negatively impact an organization’s ability to compete, but it’s also a waste of time, money, and human capital.
Why is the success rate so abysmal? And is there anything that can be done to turn things around?
To find out, we launched our own research project using the more than 20,000 real strategic plans housed in ClearPoint’s own strategy execution software. We gathered more than 31.2 million strategic data points across 7 industries, pulling together the most comprehensive dataset ever assembled on real strategic planning practices.
Not surprisingly, our analysis reveals some powerful trends that define what drives breakthrough results. These insights expose common execution gaps, reveal optimal portfolio structures, uncover ownership accountability challenges, and illustrate the natural rhythms organizations must align with to thrive.
Knowing these statistics gives you a unique opportunity to benchmark your own strategy execution against industry leaders and peers. By understanding where typical organizations struggle — and where the top performers excel — you can pinpoint practical steps to close your execution gaps and accelerate your strategic momentum.
Join the ranks of the top performers in 2026! Reserve your copy of the 2026 Strategic Planning Report to get more valuable data and insights.
50 Strategic Planning & Execution Statistics
Note: The statistics below apply to the years 2017 through 2024 unless another, specific time is specified. Also, organizations use different terms. For simplicity’s sake we’re sticking with “goals” (which is the same as “objectives”) and “projects” (which is the same as “initiatives”).
Only select data points are included in this post; we encourage you to download the 2026 Strategic Planning Report to get the full story! It includes even more valuable data, presented in context, as well as trend analyses and recommendations for strategy professionals.
General Strategic Execution and Performance Statistics
- 84.5% of strategic projects failed to reach completion.
- Only 5.7% of organizations completed 75% or more of their projects (we refer to these as “high performers”).
- 6.69% of organizations completed 25–49% of their projects (“low performers”).
- The highest percentage — 83.17% — of organizations are very low performers, completing less than 25% of their projects.
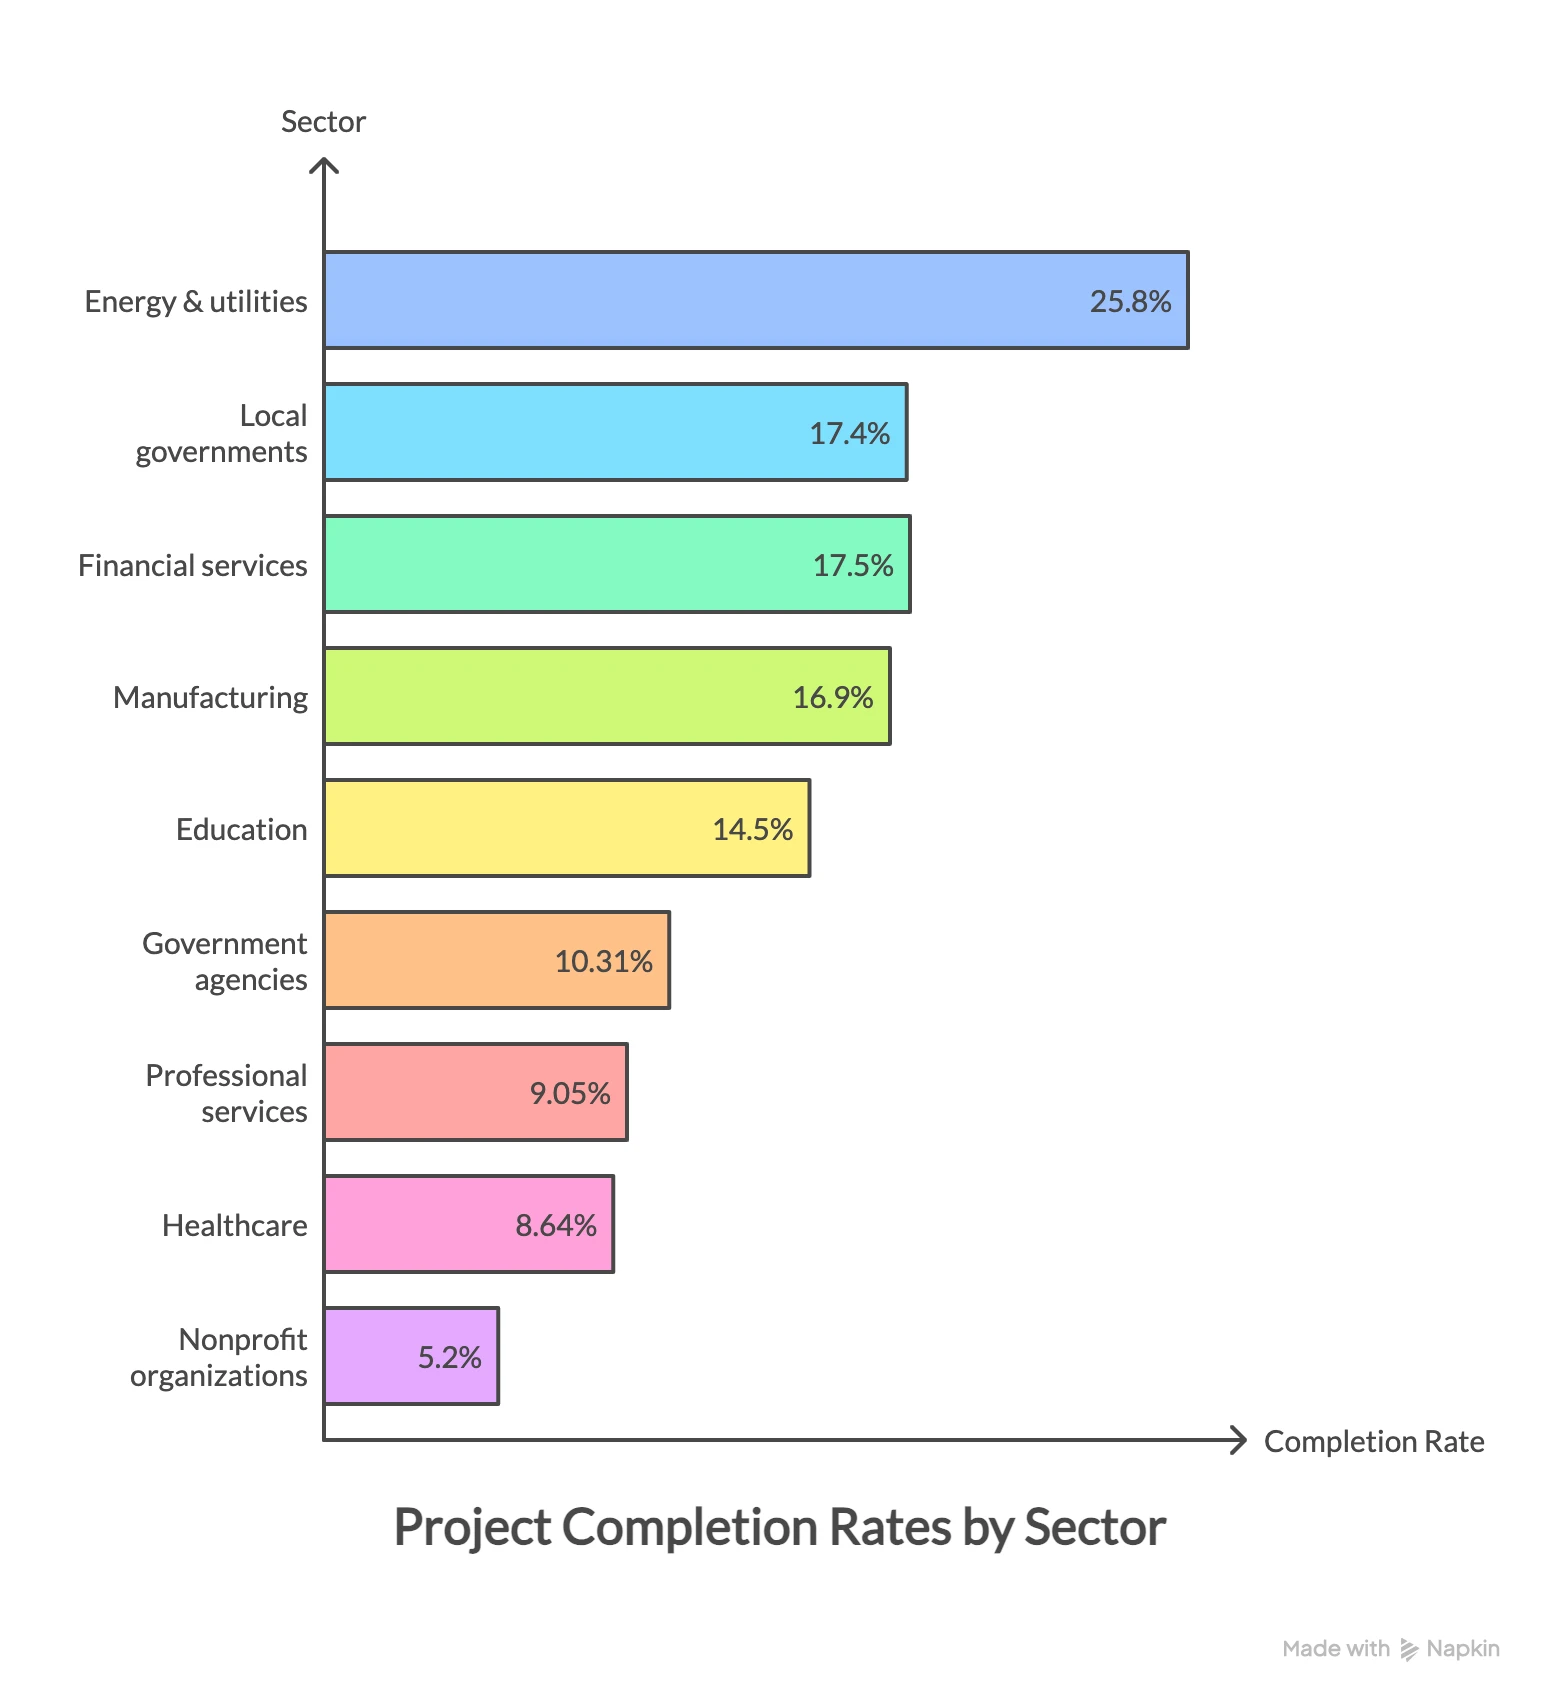
- Energy & utilities is the top-performing sector, with a 25.8% initiative completion rate.
- Local governments have a 17.4% average completion rate.
- The financial services industry has a 17.5% average completion rate.
- Manufacturing companies have a 16.9% average completion rate.
- The education sector has a 14.5% average completion rate.
- Government agencies (distinct from local governments) have a 10.31% average completion rate.
- Professional services organizations have a 9.05% average completion rate.
- Healthcare organizations have an 8.64% average completion rate.
- Nonprofit organizations have a 5.2% average completion rate.
Strategic Elements Statistics
*Elements refers to goals (aka objectives), projects (aka initiatives), measures, and milestones.
- The median number of projects rose 60%, from 5 in 2017 to 8 in 2024.
- The median number of milestones increased from 15 in 2017 to 17 in 2024.
- The average number of milestones per strategic plan nearly doubled between 2017 (32.87 milestones) and 2024 (56.11 milestones).
- Plans with fewer than 20 elements achieved a 68% high performer rate.
- Plans with 20 to 40 elements achieved a 22% completion rate.
- Plans with 40–60 elements achieved a 15% completion rate.
- Plans with 60 elements achieved an 8% completion rate.
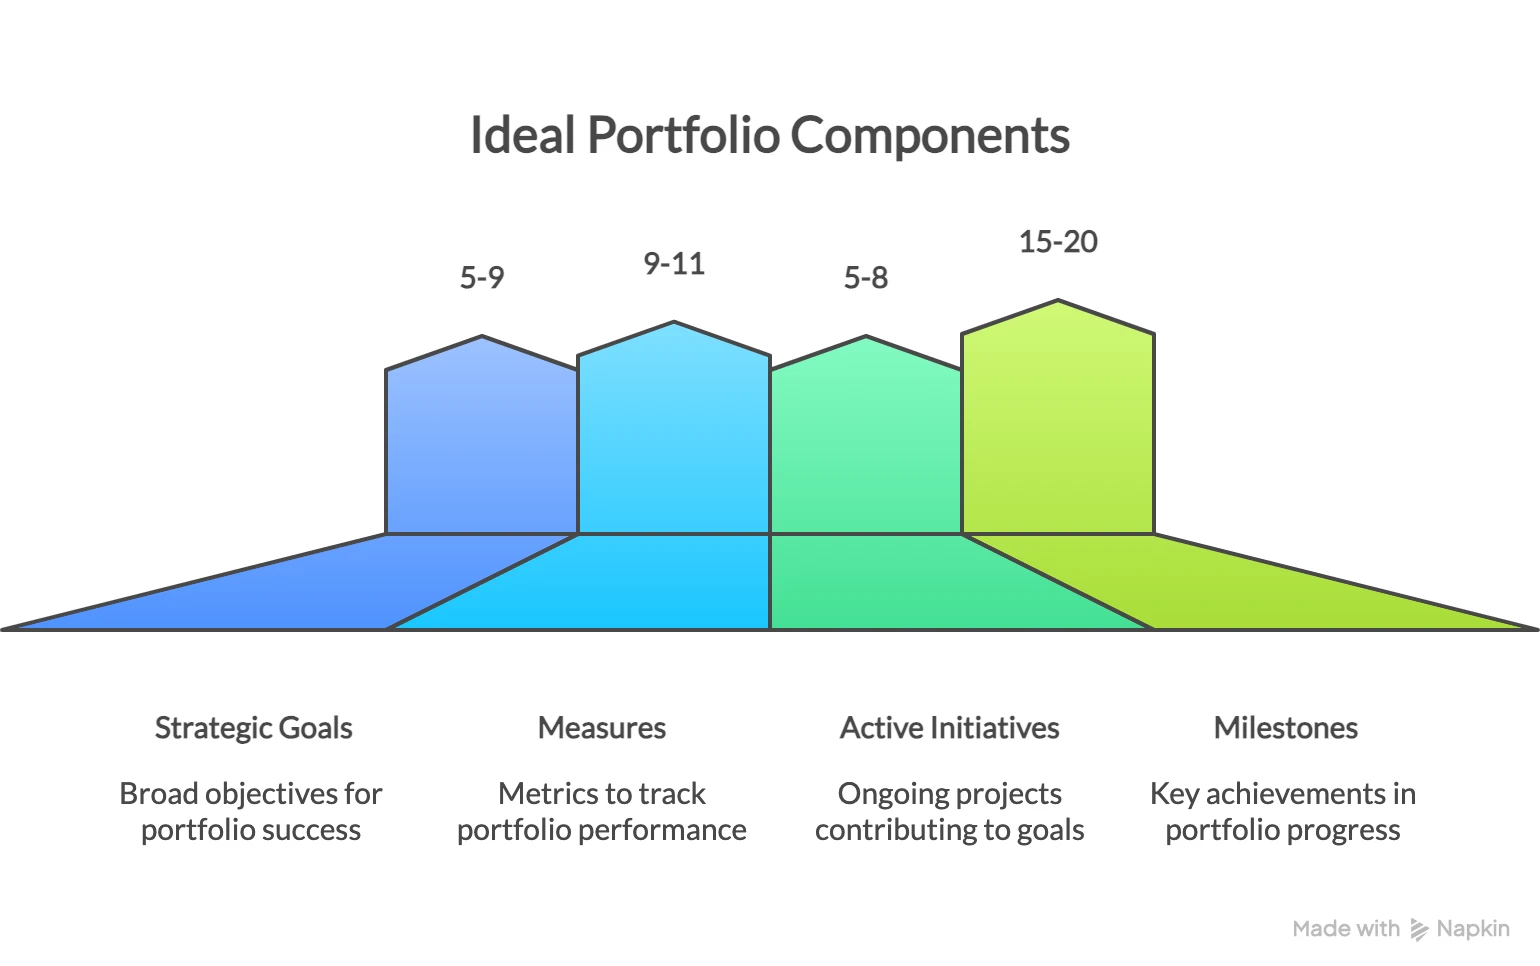
- The ideal portfolio has 5–9 strategic goals.
- The ideal portfolio has 9–11 measures.
- The ideal portfolio has 5–8 active projects.
- The ideal portfolio has 15–20 milestones.
- High performers have 5.83 measures per goal.
- High performers have 2.50 projects per goal.
- Low performers have 3.43 measures per goal.
- Low performers have 1.08 projects per goal.
- Low performers have 46.2 strategic elements.
- Governments have a median of 5 goals and 11 measures.
- Energy & utilities companies have a median of 9 goals, 5 projects, and 20 milestones.
Ownership Statistics
- 74% of strategic goals lack owners.
- 71% of measures are unassigned.
- 57% of projects have no clear ownership.
- 68% of milestones have no accountable party.
- 86% of assigned owners are "phantom owners" (have made no updates in 90+ days).
- Of all assigned owners, 13.8% are active owners (updated in the past 90 days).
- High-performing organizations have a 22.51% active ownership rate.
- Ownership increases the chances of completion by 12.8%.
- Energy & utilities companies have an average of 4.9 owners per plan.
- Local governments have an average of 2.95 owners per plan.
- Educational institutions have an average of 1.83 owners per plan.
- Financial services organizations have an average of 2.07 owners per plan.
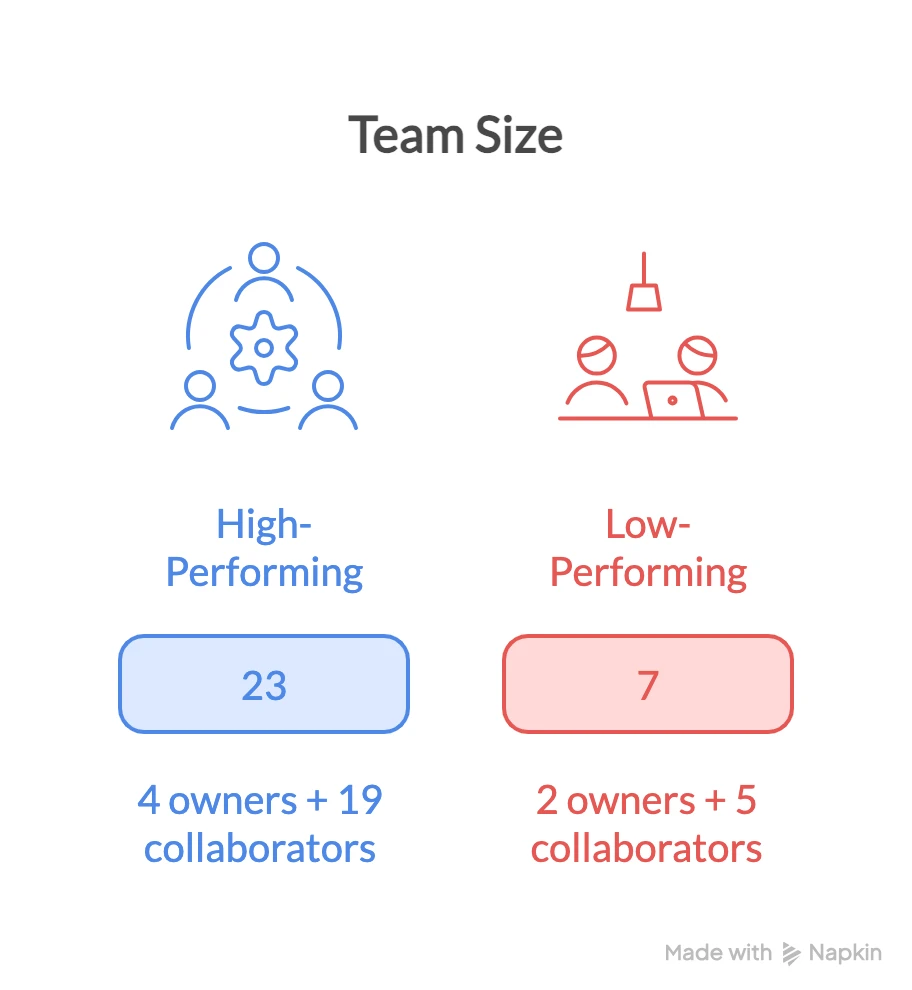
- High-performing teams have 23 people (4 owners + 19 collaborators).
- Low-performing teams have 7 people (2 owners + 5 collaborators).
Timing, Deadlines, and Calendar Cycles
- 28% of the annual total of initiative deadlines occur in December.
- 18% of the annual total of initiative deadlines occur in June.
- The month of January saw the most annual project launches — 30% — and 2 million plan updates.
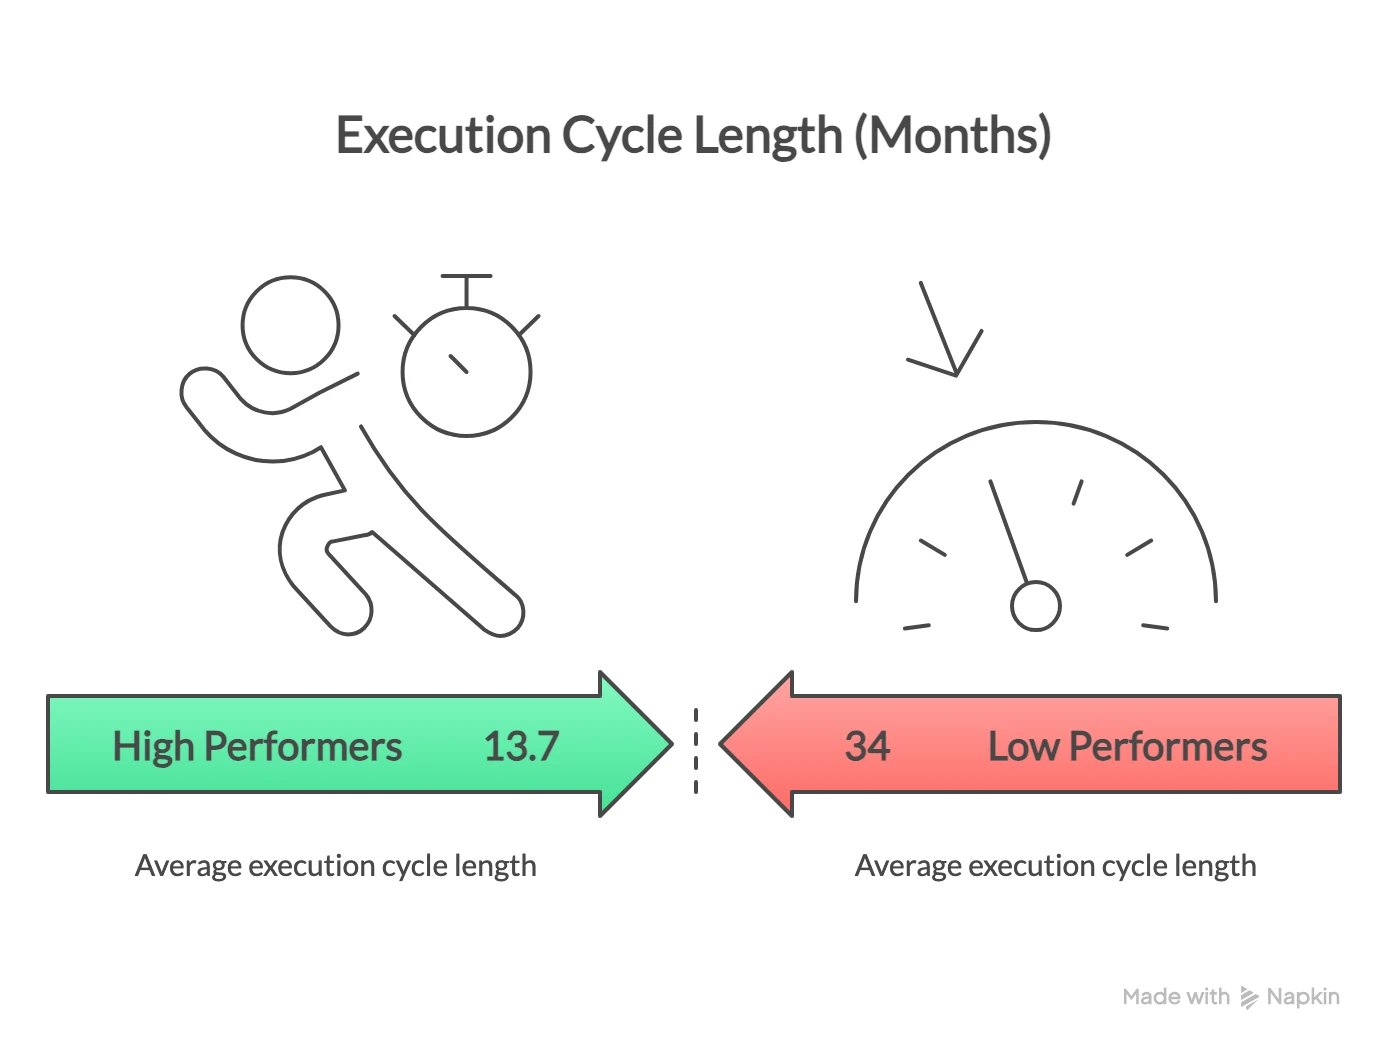
- High performers have execution cycles of 13.7 months.
- Low performers have execution cycles of 34 months.
Level up your approach to strategy in 2026 with ClearPoint.
The good news out of all this: Strategy execution can be learned. By making use of the insights gleaned from strategy data, top-performer status is actually within your reach. You can start improving now with ClearPoint, a leading strategy management platform that was designed to help you overcome the major stumbling blocks that so often stand in the way of execution — even if you get all the other aspects like the number of portfolio elements and timing — absolutely right.
For example, many organizations struggle with accountability and alignment, which slows progress. ClearPoint offers an intuitive platform that helps you stay organized, assign clear ownership, and track progress in real time. Explore more of our standout features here.
Plus, at any point, you can leverage the strategy expertise of the ClearPoint team to help you improve your approach. And as a user you also gain access to a community of ClearPoint customers in your industry who love to share their experiences and advice.
If you’d like to see how ClearPoint can help you level up your approach to strategy in 2026, book a demo and we’ll show you!