We analyzed 20,582 strategic plans. Get a copy of the full report.
Free tool ·
All
Twelve strategy dashboards by audience and sector, each with its cadence and the measures on it. Pick the ones your leadership would open, name an owner, export the spec.
Free to use. No account. Email only to export.
7.1%
of 410 active organizations publish an embedded public dashboard · 9.5% in local government · Aug 2026
128
measures the median organization tracks, across 15 scorecards · n = 593 · Sept 2026
83%
of metrics have no owner assigned at all · 272,360 of 327,582 · Jan 2026
52.0%
of 10,046,276 status records carry no result · Jan 2026
ClearPoint platform data · 2026 snapshots
A strategy dashboard is a live view of objectives, measures and initiatives against target, built from the tracked plan so it updates when owners update — not when an analyst rebuilds it. Good ones show status as text and arrow, the owner and the last-updated date on every tile. Only 7.1% of the 410 active organizations on the ClearPoint platform publish a public one (August 2026).
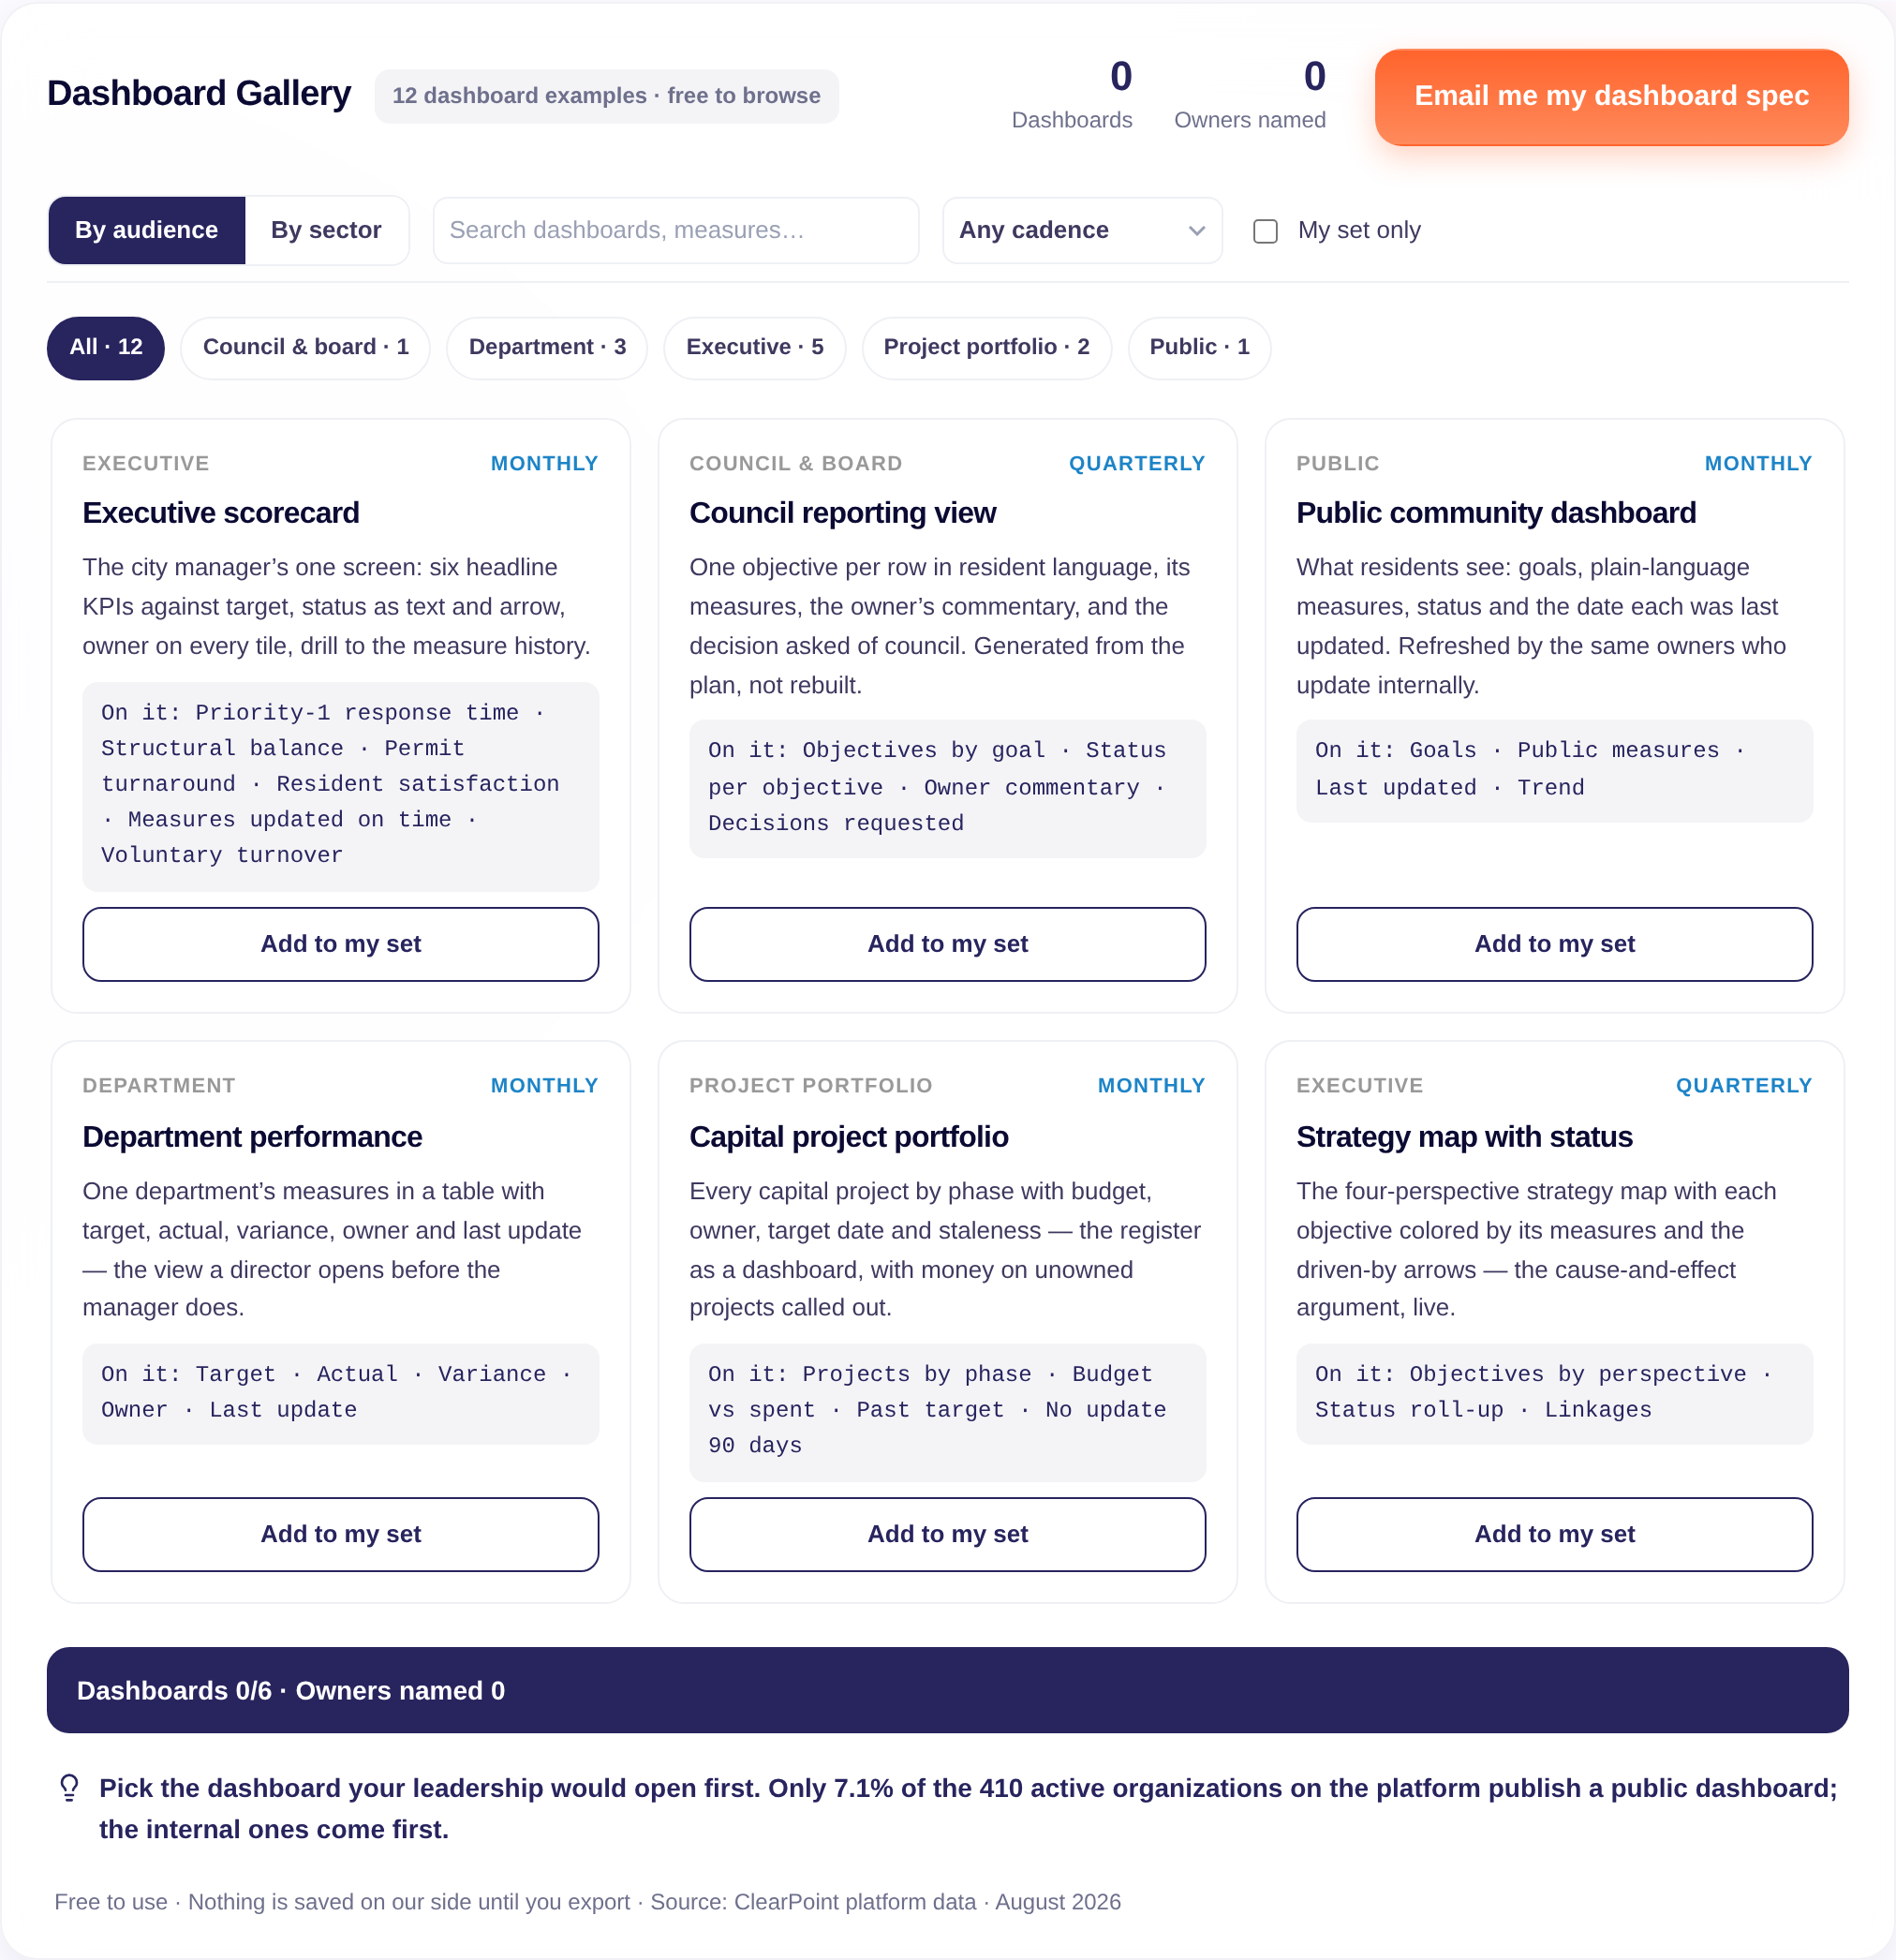
The gallery, as text. Twelve dashboard examples by audience (executive, council and board, department, public, project portfolio) and sector, each with its cadence and the measures on it. Every example uses the fictional City of Metropolis; no client data.
The city manager’s one screen: six headline KPIs against target, status as text and arrow, owner on every tile, drill to the measure history.
Priority-1 response time · Structural balance · Permit turnaround · Resident satisfaction · Measures updated on time · Voluntary turnover
One objective per row in resident language, its measures, the owner’s commentary, and the decision asked of council. Generated from the plan, not rebuilt.
Objectives by goal · Status per objective · Owner commentary · Decisions requested
What residents see: goals, plain-language measures, status and the date each was last updated. Refreshed by the same owners who update internally.
Goals · Public measures · Last updated · Trend
One department’s measures in a table with target, actual, variance, owner and last update — the view a director opens before the manager does.
Target · Actual · Variance · Owner · Last update
Every capital project by phase with budget, owner, target date and staleness — the register as a dashboard, with money on unowned projects called out.
Projects by phase · Budget vs spent · Past target · No update 90 days
The four-perspective strategy map with each objective colored by its measures and the driven-by arrows — the cause-and-effect argument, live.
Objectives by perspective · Status roll-up · Linkages
Clinical, safety and experience measures against internal targets with owner and commentary — the view a quality committee reads before the meeting.
Readmission rate · Patient experience · Hand hygiene compliance · Falls per 1,000 days
Retention, completion and engagement measures by program with the accreditation evidence linked from each tile.
Fall-to-fall retention · Six-year completion · Course success · Evidence links
Reliability, safety and customer measures for a public utility with regulatory targets and the owner of each — built for the operations review.
SAIDI / SAIFI · Safety incidents · Customer outage minutes · Main breaks
Risk appetite measures against limits with the owner and the last review date — a scorecard the risk committee can read without a data team.
Capital ratio vs limit · Open audit findings · Compliance training · Loan concentration
Objectives with three key results each, confidence and progress, owner named — the quarter on one screen without a spreadsheet.
Objectives · Key results · Confidence · Progress
One project, one page: milestones, budget, risks, owner commentary and the decision needed — generated weekly from the same records.
Milestones · Budget · Risks · Decision needed
Fiche format: Title · Audience · Cadence · Measures
Source: ClearPoint Strategy — https://www.clearpointstrategy.com/free-tools/dashboard-galleryWe’ll email a CSV of your selected dashboards — audience, cadence, measures, owner — and a printable one-page set summary. Nothing else, unless you ask.
Nothing is saved on our side until you export.
On its way to your inbox
A dashboard rebuilt by an analyst every month gets opened once; one that reads the measures your owners already update stays alive. In a 30-minute session we build one of these on your measures and show it refresh itself.
Why dashboards get opened once
Three things on every tile: status as text and arrow, the owner’s name, and the date it was last updated. A dashboard that has them is a view on live measures; one that does not is a slide. On the ClearPoint platform, 83% of metrics have no owner (January 2026) — which is why most dashboards are rebuilt by hand and read once.
Audience and language. An executive dashboard shows the six to eight measures leadership decides on, with drill-through to history; a public dashboard shows goals and a few measures per goal in resident language, with the last-updated date visible. Only 7.1% of the 410 active organizations on the platform publish an embedded public dashboard — 9.5% in local government (August 2026); the ones that last are refreshed by measure owners, not a comms team.
7.1% publish a public dashboard. The ones that last are refreshed by owners, not by a comms team.
A template is an empty layout; an example shows which measures, at which cadence, for which audience. The gallery gives you examples you can copy as a spec — audience, cadence, measures, owner — and export.
| Dashboard template | This tool | |
|---|---|---|
| Layout | Empty grid | 12 worked examples |
| Measures | Placeholders | Named, per audience and sector |
| Cadence | Not stated | On every example |
| Owner | Not stated | You name one per dashboard |
| Export | Excel / PowerPoint | CSV spec + one-pager |
| Email required | To download | Only to export |
Fewer than it builds. The median organization tracks 128 measures across 15 scorecards (n = 593, September 2026); a set of three to six dashboards — one executive, one per major audience — covers what gets decided. The gallery caps your set at six.
Trusted by the teams whose plans are public
“We had eleven dashboards and a council that opened none of them. One executive view and one public view, refreshed by the owners, and the questions in the meeting changed.”
[Cleared client quote — same vertical only] — name, title, organization
City of Fort Lauderdale · Durham County · City of Coral Springs · City of Goldsboro · JEA
Yes. Browse the twelve examples, filter by audience or sector, and build your set without an account. Email is asked only when you export the spec.
A single screen of the six to eight measures leadership actually decides on, each with target, status as text and arrow, an owner, and a drill-through to the measure history. It is a view on the tracked plan, not a slide rebuilt monthly.
Goals in resident language, a few public measures per goal, the status against target, and the date each measure was last updated. Only 7.1% of the 410 active organizations on the ClearPoint platform publish an embedded public dashboard (9.5% in local government, August 2026).
A scorecard organizes objectives and measures inside a framework (Balanced Scorecard, OKR, custom); a dashboard is the visual layer on top of it. The gallery shows both.
A CSV spec of your selected dashboards — audience, cadence, measures, owner — and a printable one-page set summary.
No. Every example uses the fictional City of Metropolis and illustrative measures. Client dashboards are shown in a demo, with permission.
All answers ship as text in the DOM — the accordion only hides them visually.
Method
Twelve archetypes designed by ClearPoint’s strategy team from the dashboards organizations build on the platform; every example uses the fictional City of Metropolis. No client dashboard is reproduced.
Public dashboards: 410 active organizations with an embedded public dashboard flag, August 2026 — 7.1% overall, 9.5% local government. Measures: DISTRICTSTATS, September 8, 2026, 593 organizations; medians. Ownership: January 2026 archive, 327,582 metrics.
The three-to-six dashboard range is a practice judgment, not a measured optimum.
Thirty minutes, your KPIs, a dashboard that refreshes itself.
Book a 30-min demo
.svg)
