Ideas for measuring employee culture, compensation, performance, and more.
- Define each KPI's formula once and apply it the same way everywhere. Metrics such as absenteeism rate and cost per hire depend on an agreed formula.
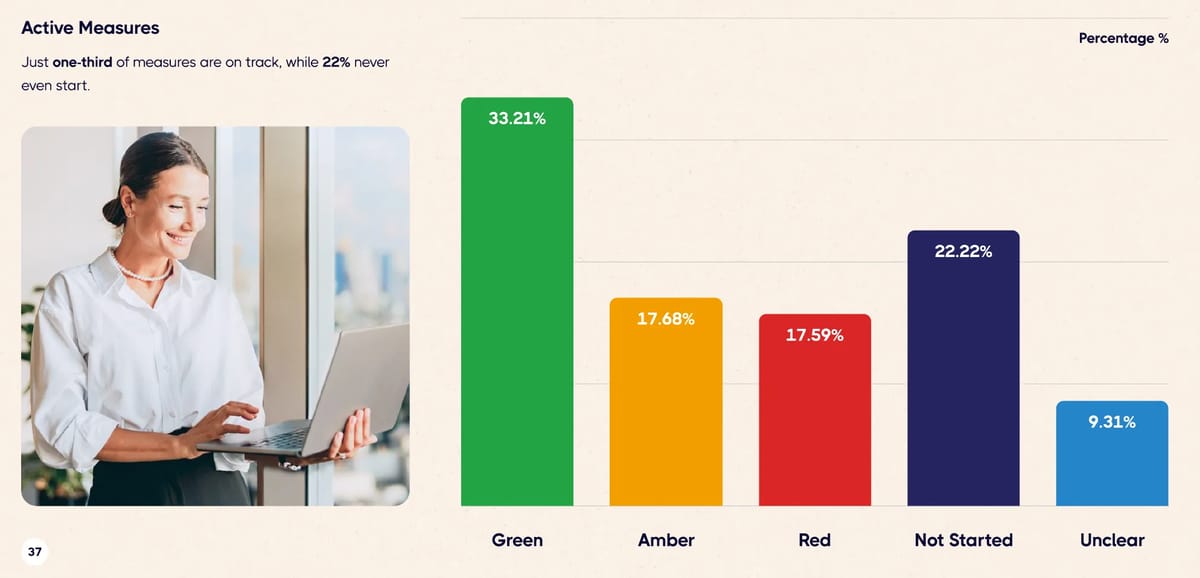
- Update a RAG status on every measure monthly. About 33% of measures are green in a typical plan; amber and red show where to intervene.
- Archive any measure stuck on "Not Started" for two consecutive quarters. A measure parked there that long likely matters little.
- Review the HR scorecard monthly and its metrics annually. Revisit a KPI whenever you complete an objective or your initiatives change.
- Pick only the few HR measures that tie to a strategic goal. Start from the free Human Capital KPI library.
Over the last decade, human resources (HR) has undergone a remarkable transformation—shifting from a behind-the-scenes benefits manager to a powerhouse driving organizational strategy and unlocking human potential.
Managers seem to recognize that it is now (more than ever) vital to have the right team executing company strategy. Well-known organizations and enterprises from all over the world regularly discuss how important it is to hire and retain the right talent, and this ability is often regarded as one of the greatest predictors of organizational success. But how do you measure the success of the team?
While many organizations recognize this shift in thought, not all of them are correctly measuring success with updated HR key performance indicators (KPIs).
Get the library of 48 human capital KPIs
50+ HR KPIs & Metric Examples–And How To Implement Them
Compensation KPIs
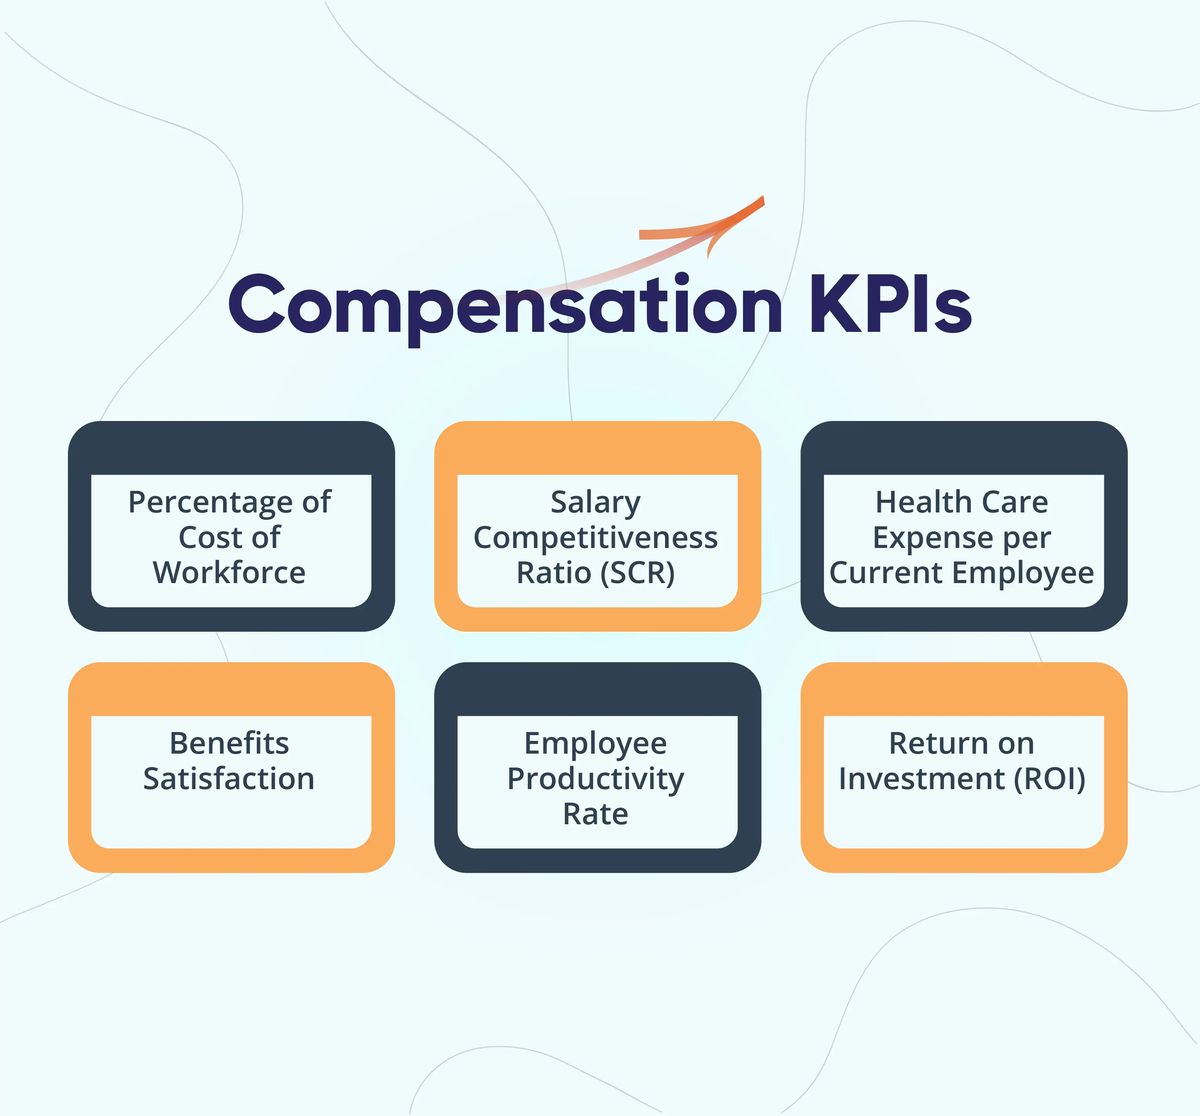
Cost of Workforce as a percentage of total expenses
LaggingThe cost of the workforce as compared to all costs can be measured by summing all salaries and dividing by the total company costs within a given period.
- Formula
Salary costs ÷ total company costs.- Example
- $4,200,000 ÷ $12,000,000 = 35%.
- What good looks like
- there is no universal number — service and knowledge businesses run far higher shares than manufacturers, so benchmark against industry peers and read it alongside revenue per employee
- Weak → strong
- "Control labor costs" → "Hold workforce cost at or below 35% of total costs this fiscal year, owned by the CFO via quarterly workforce planning".
Salary Competitiveness Ratio (SCR)
LeadingUsed to evaluate the competitiveness of compensation options.
- Formula
Average company salary ÷ average salary offered by competitors (or by the industry).- Example
- $76,000 ÷ $80,000 = 0.95.
- What good looks like
- a ratio of 1.0 means you pay at market and below 1.0 makes hiring and retention harder; set the target by role family against your chosen market position rather than one company-wide number
- Weak → strong
- "Pay competitively" → "Raise the salary competitiveness ratio from 0.95 to 1.0 for hard-to-fill roles within two budget cycles, owned by the Compensation Manager".
Can be determined by dividing the average company salary by the average salary offered from competitors or by the rest of your industry.
Health Care Expense per Employee
LaggingProvides an understanding of the comprehensiveness of a company's health care plan.
- Formula
Total health care costs ÷ all employees.- Example
- $2,400,000 ÷ 200 employees = $12,000.
- What good looks like
- the average employer-sponsored premium reached ~$9,325 for single and ~$26,993 for family coverage in 2025, up 5–6% in a year, so the goal is slower growth rather than a fixed number
- Weak → strong
- "Control health costs" → "Hold health care expense per employee at or under $12,600 (5% growth) next plan year, owned by the Benefits Manager via plan-design and pharmacy changes".
Can be determined by taking the total price of health care costs divided by all employees.
Show all 6 Compensation KPIs
Benefits Satisfaction
LaggingBetter when higherThis allows a company to see how satisfied an employee is with specific benefits they are offered.
- Formula
(Satisfied benefits-survey responses ÷ total responses) × 100.- Example
- 136 satisfied ÷ 170 responses = 80%.
- What good looks like
- there is no universal number — break the score out by benefit, then weigh low scores against what each benefit costs, since the least-valued benefit is often the best one to redesign
- Weak → strong
- "Offer benefits people value" → "Raise benefits satisfaction from 80% to 85% at the next annual survey, owned by the Benefits Manager via a redesigned leave package".
Can be determined through surveys, and can be used to break down each benefit individually.
Employee Productivity Rate
LaggingBetter when higherHelps to measure workforce efficiency over time.
- Formula
Total revenue ÷ total headcount.- Example
- $40,000,000 ÷ 200 employees = $200,000.
- What good looks like
- there is no universal number — it swings widely by industry and business model, so compare it with direct peers and your own trend, and watch it alongside margin and service quality
- Weak → strong
- "Be more productive" → "Grow revenue per employee from $200,000 to $220,000 by next fiscal year, owned by the COO via process automation".
Can be determined by taking the total company revenue and dividing it by the total number of employees.
Return on Investment (ROI)
LaggingBetter when higherAs an organization, you want to ensure that the dollars you are putting into training your employees is paying off.
- Formula
(Gain from investment − cost of investment) ÷ cost of investment.- Example
- ($130,000 − $100,000) ÷ $100,000 = 30%.
- What good looks like
- there is no universal number — compare it with your cost of capital or hurdle rate and with other uses of the same money, over the same time period
- Weak → strong
- "Invest wisely" → "Raise average ROI on approved capital projects from 30% to 35% this fiscal year, owned by the CFO via a standard business-case review".
Can be defined as the profit per dollar invested in social compensations/wages.
Employment KPIs
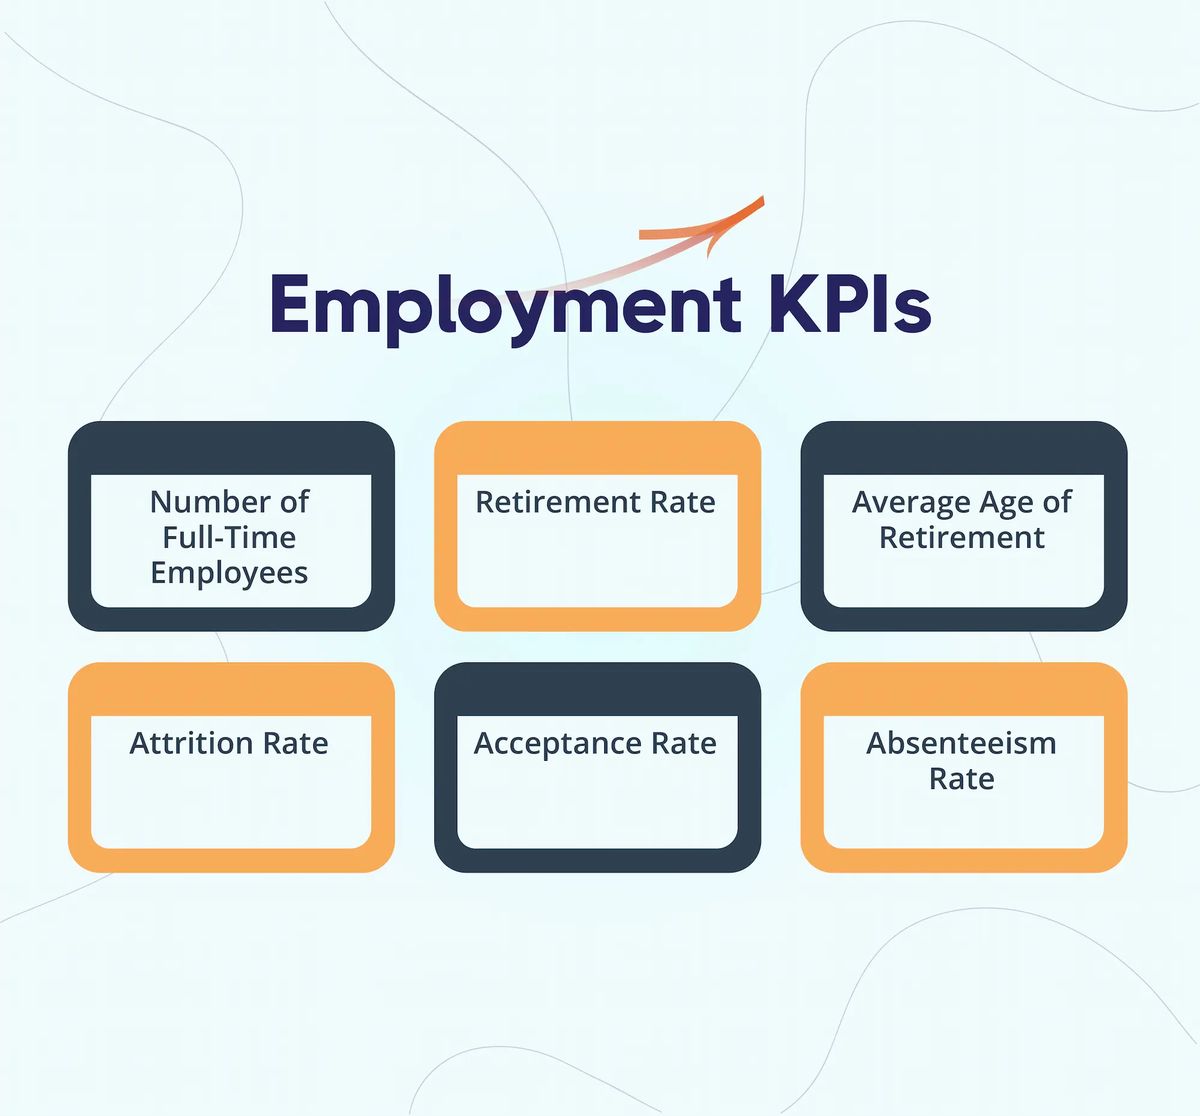
Number of Full-Time Employees
LaggingKeeps tabs on the growth of the company workforce over time.
- Formula
Full-time employees at start of period + full-time hires − full-time departures.- Example
- 190 + 25 hired − 15 departed = 200 full-time employees.
- What good looks like
- there is no universal number — track it against the approved headcount plan and against revenue or service volume, so growth in staff follows growth in the work
- Weak → strong
- "Grow the team" → "Reach 220 full-time employees, up from 200, by year-end within the approved plan, owned by the HR Director".
Number of Employees Per Location
Tracks employees’ work location preferences—at home or in the office—so you can better understand your workforce and make informed decisions about your building space and company policies.
- Formula
Count of employees assigned to each work location (office, hybrid, or remote).- Example
- 120 office + 60 hybrid + 20 remote = 200 employees.
- What good looks like
- there is no universal number — compare each site's headcount with its desk capacity and actual on-site use, so space and policy decisions follow where people really work
- Weak → strong
- "Use our offices better" → "Match office seating to the 120 on-site employees by year-end, owned by the Facilities Manager via quarterly headcount-per-location reviews".
Number of Contractors
Examines the growth in associated workers over time.
- Formula
Count of independent, agency, and contract-firm workers active at period end.- Example
- 30 independent + 12 agency + 8 contract-firm = 50 contractors.
- What good looks like
- federal survey data put independent contractors at ~7.4% of U.S. employment, temp-agency workers at ~0.6%, and contract-firm workers at ~0.5%; watch your own mix against full-time headcount over time
- Weak → strong
- "Watch our contractor use" → "Hold contractors at or below 50 through year-end, with every assignment over six months reviewed for conversion by the HR Director".
Can be compared to the number of full-time workers to better understand workforce trends.
Show all 27 Employment KPIs
Retirement Rate
LaggingThis metric is particularly important for any organization developing a strategic workforce plan.
- Formula
(Employees who retired ÷ headcount) × 100.- Example
- 12 retirees ÷ 400 headcount = 3%.
- What good looks like
- there is no universal number — the risk is concentration, so pair it with the share of staff eligible to retire in the next five years and flag critical roles with no ready successor
- Weak → strong
- "Plan for retirements" → "Name a ready successor for every critical role within two years while the retirement rate runs near 3%, owned by the HR Director".
Can be calculated by looking at the number of employees who retired as a percentage of the headcount.
Average Age of Retirement
LaggingThe summed age of all retiring employees divided by the number of retiring employees.
- Formula
Sum of retiring employees' ages ÷ number of retiring employees- Example
- 3,050 years ÷ 50 retirees = 61 years.
- What good looks like
- Gallup finds U.S. retirees report an average retirement age of 61, while nonretirees expect to retire at 66; there is no right age, so use the trend to plan succession and knowledge transfer
- Weak → strong
- "Plan for retirements" → "Name a ready successor 12 months ahead for every role whose holder is within five years of the 61-year average retirement age, owned by the HR Director".
Being aware of these trends aid in forecasting retirement and planning for workforce replacement.
New Hire 90-Day Failure Rate
LaggingBetter when lowerHelps determine how successful the talent acquisition process is at finding the right fit for jobs.
- Formula
(New hires who leave or are let go within 90 days ÷ total new hires) × 100.- Example
- 6 ÷ 75 hires = 8%.
- What good looks like
- there is no universal number — track it by role and recruiting source against your own baseline; a rising rate usually means a gap between the job as described and the job as lived (lower is better)
- Weak → strong
- "Make better hires" → "Cut the 90-day new-hire failure rate from 8% to 5% within two quarters, owned by the Talent Acquisition Manager via realistic job previews".
First Year Voluntary Termination Rate
LaggingBetter when lowerReflects on how welcoming the company is to new hires.
- Formula
(Employees who leave voluntarily within their first year ÷ employees hired in the period) × 100.- Example
- 9 ÷ 60 hires = 15%.
- What good looks like
- there is no universal number — compare it with your overall voluntary turnover; a first-year rate well above it points to onboarding, manager fit, or a job that does not match how it was sold (lower is better)
- Weak → strong
- "Keep new hires longer" → "Cut first-year voluntary terminations from 15% to 10% for the next hiring cohort, owned by the HR Business Partner via a structured 90-day onboarding plan".
A high percentage suggests that the right people are being hired, but not embraced.
Average Time to Fill a Job Vacancy
LaggingBetter when lowerTracks how efficient the hiring process is in terms of time resources used to fill a vacant spot.
- Formula
Total days to fill ÷ number of roles filled.- Example
- 1,200 days ÷ 30 hires = 40 days.
- What good looks like
- HR recruiting benchmarks put the median time to fill at about a month and a half for both executive and nonexecutive roles in 2025, so set targets by role family and track the slowest stages (lower is better)
- Weak → strong
- "Fill jobs faster" → "Cut average time to fill from 40 to 35 days for non-executive roles by Q4, owned by the Talent Acquisition Manager".
Hiring Process Satisfaction Rate
LaggingBetter when higherProvides perspective on how well the process works from the employee’s perspective.
- Formula
(Satisfied survey responses ÷ total survey responses) × 100.- Example
- 102 satisfied ÷ 120 responses = 85%.
- What good looks like
- there is no universal number — survey new hires right after onboarding, track the satisfied share against your own baseline, and fix the steps rated worst first
- Weak → strong
- "Make hiring a better experience" → "Raise hiring-process satisfaction from 85% to 90% by Q4, owned by the Talent Acquisition Manager via faster interview scheduling".
Cost per Hire
LaggingBetter when lowerAcknowledges the amount of resources invested into acquiring the best talent.
- Formula
(Internal + external recruiting costs) ÷ number of hires.- Example
- $120,000 ÷ 30 hires = $4,000.
- What good looks like
- HR benchmarking put the 2025 median cost per hire at ~$1,200 for nonexecutive roles and ~$10,625 for executive roles, so track it by role level and watch quality of hire alongside it (lower is better)
- Weak → strong
- "Hire more efficiently" → "Cut cost per hire from $4,000 to $3,500 within a year, owned by the Talent Acquisition Manager via more employee referrals".
Can be determined by averaging the total marketing, hiring process, and referral (if necessary) costs per hire.
Effectiveness of Training
LaggingBetter when higherHelps the company understand how comfortable new hires feel after their training vs. before.
- Formula
Average post-training confidence score − average pre-training confidence score.- Example
- 4.2 − 3.0 = 1.2 points.
- What good looks like
- there is no universal number — a consistent rise in confidence from before to after training, backed by on-the-job results, matters more than any single survey score
- Weak → strong
- "Train new hires better" → "Lift the average new-hire confidence gain from 1.2 to 1.5 points on the post-training survey by Q4, owned by the onboarding lead".
Typically determined through a post-training survey.
Training Cost per Employee
LeadingHelps to measure the amount invested in onboarding new hires.
- Formula
Total training spend ÷ number of employees trained.- Example
- $350,000 ÷ 400 = $875.
- What good looks like
- Training magazine's 2025 Training Industry Report puts average spend at $874 per learner, with small companies ($1,091) spending more than midsize ($782) or large ($468); judge it alongside training results
- Weak → strong
- "Invest in training" → "Hold training spend near $875 per employee while lifting post-training assessment scores 10% this year, owned by the L&D Manager".
Percentage of Employees Trained
LeadingHelps a company see how quickly new hires are being onboarded.
- Formula
(Employees who completed required training ÷ employees required to complete it) × 100.- Example
- (45 ÷ 50) × 100 = 90%.
- What good looks like
- there is no universal number — required training should approach full completion, so track the gap to 100% and how long new hires take to close it
- Weak → strong
- "Onboard new hires faster" → "Have 100% of new hires complete required training within 30 days of start by Q2, owned by the onboarding lead".
Diversity Rate
LaggingKeeps track of how successfully the organization is creating an environment that fosters an open and accepting community.
- Formula
(Employees in group ÷ total headcount) × 100.- Example
- 90 ÷ 200 employees = 45%.
- What good looks like
- compare each group's share with the labor market you hire from; women were ~47% of employed people in the U.S. in 2025, and local census or labor data give a fairer benchmark for each role
- Weak → strong
- "Build a more diverse workforce" → "Raise the share of women in management from 45% to 48% within two years, owned by the HR Director via diverse candidate slates".
Number of D&I Initiatives Implemented
LeadingThe number of D&I initiatives implemented measures organizational commitment to establishing and maintaining a culture of diversity and inclusion.
- Formula
Count of D&I initiatives completed in the period.- Example
- 2 mentoring programs + 3 hiring-process changes + 1 pay-equity review = 6 initiatives.
- What good looks like
- there is no universal number — a few initiatives with named owners and measured outcomes beat a long list, so track each one's result, not just the count
- Weak → strong
- "Do more on D&I" → "Implement 6 D&I initiatives this year, each with a named owner and an outcome measure, owned by the D&I Council chair".
Attrition Rate
LaggingBetter when lowerHelps a company figure out how successful they are at retaining talent.
- Formula
(Separations ÷ average headcount) × 100.- Example
- 18 leavers ÷ 200 avg headcount = 9%.
- What good looks like
- ~10% annual voluntary turnover is often considered healthy; sustained 20%+ usually signals a retention problem, though it varies sharply by sector
- Weak → strong
- "Keep turnover low" → "Hold voluntary turnover below 10% annually, owned by the People team, reviewed each quarter".
Determined by dividing the number of employees who left the company in a given period by the average number of employees in that time period.
Turnover Rate For Highest Performers
LaggingBetter when lowerTurnover of top performers in particular is negative and comes at a higher cost.
- Formula
Number of high performers who departed in the past year ÷ total high performers identified.- Example
- 4 ÷ 50 = 8%.
- What good looks like
- there is no universal number — lower is better, and it should sit well below your overall turnover rate; treat every top-performer exit as a signal worth reviewing
- Weak → strong
- "Keep our best people" → "Cut top-performer turnover from 8% to 5% within the year, owned by HR Business Partners via stay interviews".
This metric indicates the success of retention efforts and aids planning for talent replacement. Can be determined by dividing the number of high performers to leave in the past year by total high performers identified.
Average Time to Find a Hire
LaggingBetter when lowerHelps track the efficiency of the hiring process.Candidates Interviewed per Hire
LeadingDetermined by calculating the total number of candidates interviewed by the total number of hires in a particular hiring period.
- Formula
Candidates interviewed ÷ hires in the hiring period.- Example
- 120 ÷ 20 = 6 candidates per hire.
- What good looks like
- there is no universal number — fewer interviews per hire usually means sharper screening, but too few can narrow the pool; set it against your own baseline by role
- Weak → strong
- "Interview more efficiently" → "Cut candidates interviewed per hire from 6 to 4 by year-end, owned by the Talent Acquisition Manager via structured phone screens".
Yield Percentage
LeadingThis is the percentage of candidates remaining after each round of elimination in the hiring process.
- Formula
(Candidates advancing past a stage ÷ candidates entering that stage) × 100.- Example
- (60 ÷ 300) × 100 = 20%.
- What good looks like
- there is no universal number — yields vary by role and stage, so map each stage against your own baseline and look for the one where yield drops sharply
- Weak → strong
- "Improve our hiring funnel" → "Raise screen-to-interview yield from 20% to 25% by Q3, owned by the recruiting lead via sharper screening criteria".
A low percentage might indicate the need to update an unclear or unattractive job posting, and a high percentage indicates a larger number of qualified candidates with whom to continue the hiring process.
Knowledge Achieved With Training
LaggingBetter when higherHelps the company see not specifically the price of the training, but whether it was effective.
- Formula
((Average post-training score − average pre-training score) ÷ average pre-training score) × 100.- Example
- ((84 − 60) ÷ 60) × 100 = 40%.
- What good looks like
- there is no universal number — look for a clear pre-to-post gain, high pass rates on the exam, and evidence people still apply the skill weeks later, compared against your own course baseline
- Weak → strong
- "Make training stick" → "Raise average knowledge gain from 40% to 50% on core compliance courses by Q3, owned by the Learning & Development Manager".
Seeing if the individuals retained knowledge well enough to apply it is critical. Can be determined by creating an exam, and monitoring exam pass rate %, average score %, and pre/post training %.
Diversity Numbers In The Workforce
LaggingWorkplace diversity helps to cultivate innovation and competitive advantage.
Diversity of nationalities and ethnicities can be calculated by noting the differences among employee demographic segments.
Acceptance Rate
LeadingBetter when higherDividing the number of acceptances by the number of offers allows organizations to get a sense of how successful their recruitment strategies are.
- Formula
(Offers accepted ÷ offers extended) × 100.- Example
- 27 accepted ÷ 30 extended = 90%.
- What good looks like
- a large recruiting-software benchmark put overall offer acceptance at ~73% in 2022 and 2023, with business roles about 20 points above technical roles, so a rate near 90% is well above typical
- Weak → strong
- "Close more candidates" → "Hold offer acceptance at 90%+ for all roles this year, owned by the Talent Acquisition Manager via pre-offer compensation alignment".
Industry benchmarks can then be a helpful comparison.
Voluntary Termination Rate
LaggingDetermined by taking the number of employee-led resignations from the company over the total number of terminations in a given time period.
- Formula
(Voluntary separations ÷ total separations) × 100.- Example
- 14 voluntary ÷ 18 total = 78% voluntary.
- What good looks like
- across the U.S. economy, quits made up ~61% of separations in 2025 and layoffs and discharges ~34%; a share far from that mix is worth explaining
- Weak → strong
- "Understand why people leave" → "Bring the voluntary share of separations from 78% to 70% within a year by reducing avoidable quits, owned by the HR Director via exit-interview follow-up".
Involuntary Termination Rate
LaggingDetermined by taking the number of employer-led resignations from the company over the total number of terminations in a given time period.Absenteeism Rate
LaggingBetter when lowerGives perspective on the amount of labor and productivity lost due to sickness and otherwise unpredicted leave.
- Formula
(Total number of lost workdays due to absence) / (Number of available workdays in an organization) = (Absenteeism rate)- Example
- 400 absent days ÷ 50,000 scheduled = 0.8%.
- What good looks like
- U.S. full-time workers lost ~1.7% of usual hours to absence in 2025 and ~3.2% were absent in a given week; use that as an outside reference and watch for teams trending up (lower is better)
- Weak → strong
- "Reduce absences" → "Hold the absenteeism rate at or below 0.8% in every department this year, owned by department managers via return-to-work check-ins".
See the KPI dashboard template
Employee Experience KPIs
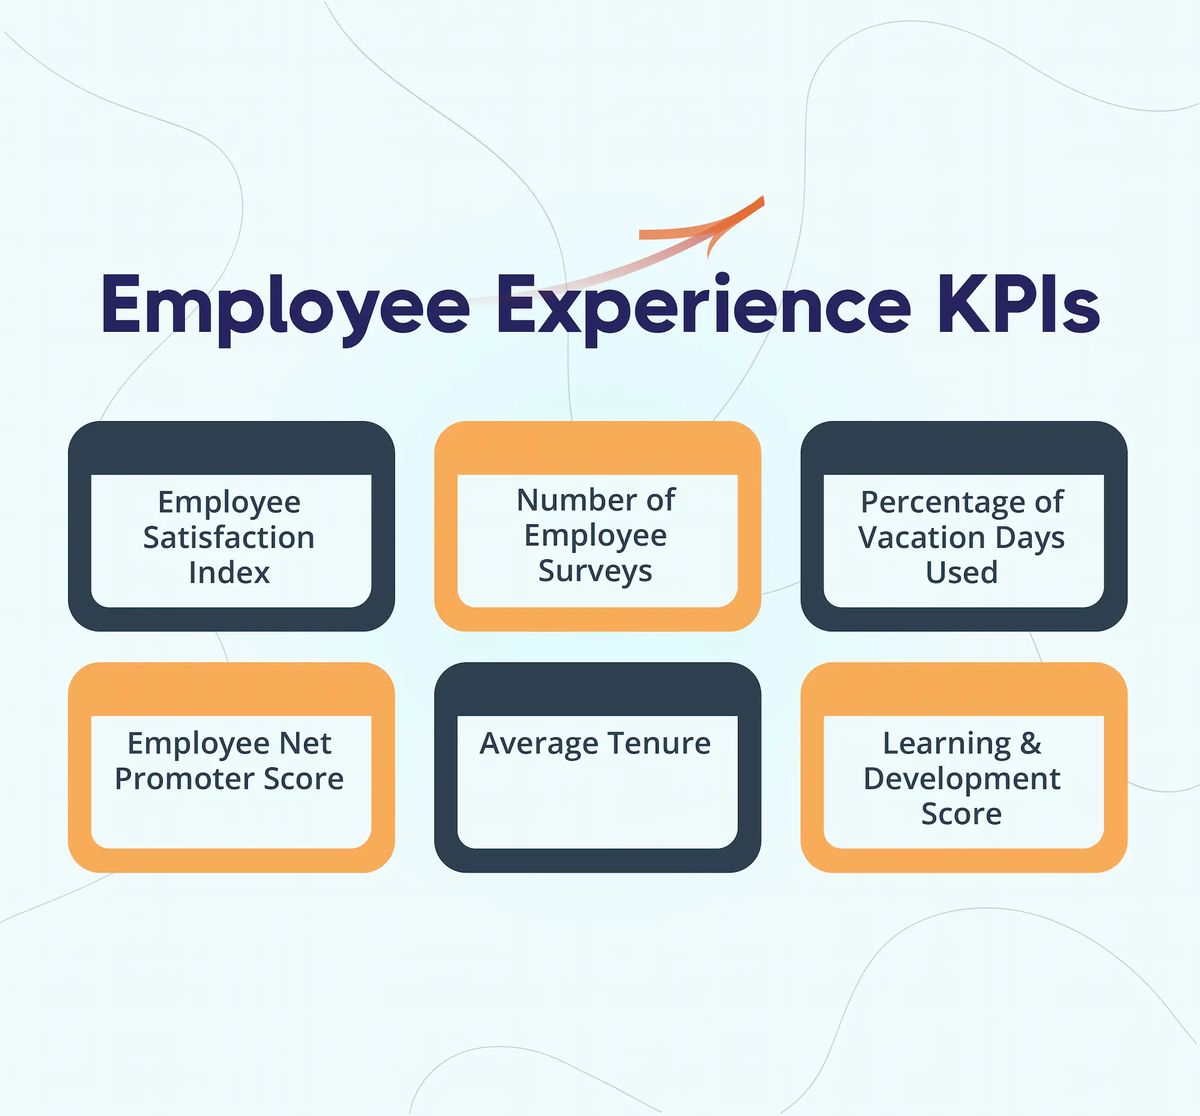
Employee Satisfaction Index
LeadingBetter when higherThis is a key metric underlying talent retention.
- Formula
(Positive responses ÷ (positive + negative responses)) × 100.- Example
- (1,800 ÷ (1,800 + 700)) × 100 = 72%.
- What good looks like
- the Conference Board's 2025 survey found U.S. job satisfaction at its highest level since the series began in 1987, with ~72% of workers 55 and older satisfied versus ~57% under 25, so benchmark by group, not one number
- Weak → strong
- "Make employees happier" → "Raise the satisfaction index from 72% to 78% on the next annual survey, owned by the CHRO via action plans for the lowest-scoring teams".
Using a company-wide survey can be helpful in gauging employee happiness.
Number of Employee Satisfaction Surveys
LeadingHelps understand how much effort is being put into maintaining and improving employee happiness.
- Formula
Count of employee satisfaction surveys conducted in the period.- Example
- 1 annual survey + 3 quarterly pulse surveys = 4 surveys.
- What good looks like
- there is no universal number — a steady rhythm, such as an annual survey plus shorter pulse checks, matters more than volume, and every survey should end in shared results and action
- Weak → strong
- "Ask employees how they feel" → "Run one annual survey and three quarterly pulse surveys this year, sharing results within 30 days of each, owned by the People Analytics lead".
Percentage of Employees Trained in Company Culture
LeadingEvaluates the importance and understanding of company-wide organizational culture.
- Formula
(Employees who completed culture training ÷ total employees) × 100.- Example
- (340 ÷ 400) × 100 = 85%.
- What good looks like
- there is no universal number — aim for every employee, new hires included, to complete it early in their tenure, and pair completion with a culture survey to check it lands
- Weak → strong
- "Train everyone on our culture" → "Reach 100% culture-training completion by year-end, with every new hire trained within 60 days of start, owned by the People Operations lead".
Show all 7 Employee Experience KPIs
Percentage of Vacation Days Used
LeadingHelps show the company attitude toward a healthy work-life balance.
- Formula
(Vacation days used ÷ vacation days available) × 100.- Example
- (6,800 ÷ 8,000) × 100 = 85%.
- What good looks like
- Pew Research finds 46% of U.S. workers with paid time off take less than they are offered, so usage well below 100% is common; moving it toward full use supports work-life balance
- Weak → strong
- "Encourage time off" → "Raise vacation-day usage from 85% to 92% by year-end, owned by the HR Director via manager-led time-off planning".
Determined by observing the number of vacation days used as compared to those unused.
Employee
LeadingBetter when higherNet Promoter Score: Measures how likely an employee is to recommend their organization as a place to work.
- Formula
% Promoters − % Detractors.- Example
- 55% promoters − 15% detractors = +40.
- What good looks like
- scores run from −100 to +100; one employer benchmark puts the median near +26 with the middle half between +11 and +44, and anything below zero means detractors outnumber promoters
- Weak → strong
- "Make this a place people recommend" → "Raise eNPS from +40 to +45 at the next pulse survey, owned by the People team via manager action plans".
This is determined by the difference in percentage of promoters and detractors.
Average Tenure
LaggingThe average length of time that an employee spends with the company helps determine employee satisfaction and talent retention.
- Formula
Sum of all employees' years of service ÷ number of employees.- Example
- 1,640 years ÷ 400 employees = 4.1 years.
- What good looks like
- BLS reports median tenure with the current employer of 4.1 years for U.S. wage and salary workers (January 2026) — 5.6 years in the public sector and 3.9 in the private sector; read it alongside turnover, not as a goal on its own
- Weak → strong
- "Keep people longer" → "Raise average tenure from 4.1 to 4.5 years within two years, owned by the CHRO via career-path programs".
Learning & Development Score
LeadingBetter when higherReveals whether your employees are satisfied with the development and continuing education opportunities afforded by your company, which impacts the overall employee experience.
- Formula
(Favorable responses on L&D survey items ÷ total responses to those items) × 100.- Example
- (1,040 ÷ 1,600) × 100 = 65%.
- What good looks like
- there is no universal number — track the favorable share against your own baseline and by team, and act on the lowest-scoring items before the next survey
- Weak → strong
- "Offer better development" → "Raise the L&D favorable score from 65% to 72% on the next annual survey, owned by the Learning & Development Manager".
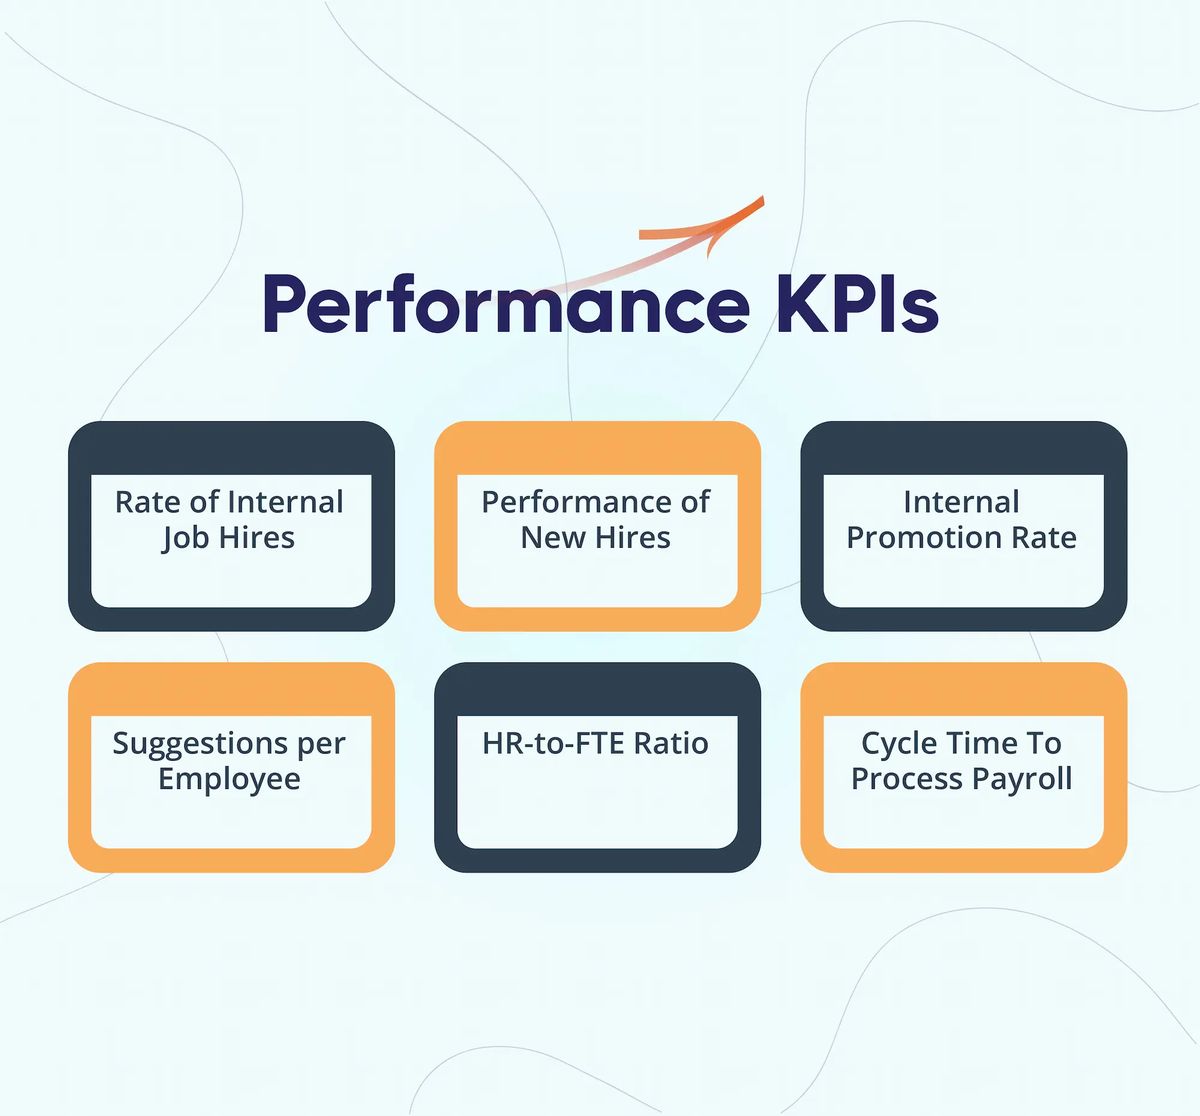
Performance KPIs
Percentage of Job Candidates Who Meet Job Criteria
LeadingHelps in evaluating the effectiveness of job postings in reaching top candidates.
- Formula
(Applicants meeting minimum job criteria ÷ total applicants) × 100.- Example
- (90 ÷ 300) × 100 = 30%.
- What good looks like
- there is no universal number — a rising share means postings are reaching the right people; compare it by channel and role against your own baseline
- Weak → strong
- "Attract better applicants" → "Raise the share of applicants meeting job criteria from 30% to 40% within two quarters, owned by the recruiting lead via rewritten postings".
Rate of Internal Job Hires
LeadingShows the effectiveness of organizational talent development.
- Formula
(Internal moves ÷ total roles filled) × 100.- Example
- 12 internal moves ÷ 40 roles = 30%.
- What good looks like
- employees who made an internal move had a ~75% chance of staying two years versus ~56% for those who did not, so a rising internal-fill share usually pays off in retention
- Weak → strong
- "Promote from within" → "Fill 35% of open roles internally, up from 30%, by year-end, owned by the Talent Acquisition Manager via posting every role internally first".
Rate of Internal Referral Hires
LaggingAllows managers to see the value added when current employees help to identify and acquire talent.
- Formula
(Hires from employee referrals ÷ total hires) × 100.- Example
- (18 ÷ 90) × 100 = 20%.
- What good looks like
- published benchmarks vary widely by study and method, so there is no universal number — track it against your own baseline and compare referred hires' retention and performance with other sources
- Weak → strong
- "Get more referrals" → "Raise the share of hires from employee referrals from 20% to 25% by year-end, owned by the Talent Acquisition Manager via a refreshed referral program".
Show all 11 Performance KPIs
Performance of New Hires
LaggingThe performance of new hires can be compared to that of other employees.
- Formula
(Average new-hire performance rating ÷ average rating of all employees) × 100.- Example
- (3.6 ÷ 4.0) × 100 = 90%.
- What good looks like
- there is no universal number — new hires closing in on the overall average by their first annual review signal strong selection and onboarding; compare by hiring source and manager
- Weak → strong
- "Hire stronger performers" → "Lift new-hire performance to 95% of the company average by their first annual review, owned by hiring managers, reviewed each quarter".
Typically done by evaluating performance reports.
Internal Promotions Vs. External Hires
LaggingThis ratio measures how many people already working at a company are considered for internal promotion versus the number of externally attracted people.
- Formula
Internal promotion candidates ÷ external hires- Example
- 30 internal candidates ÷ 60 external hires = 0.5:1.
- What good looks like
- there is no universal ratio — SHRM's 2026 benchmarking shows a median of 97% of nonexecutive positions filled externally, so even a modest rise in internal candidates is a real shift; set it against your own baseline
- Weak → strong
- "Promote from within more" → "Raise internal candidates per external hire from 0.5:1 to 0.75:1 by year-end, owned by the HR Business Partner via a post-internally-first policy".
Can be particularly effective when looking at organizational succession planning.
Internal Promotion Rate
LeadingInternal promotions indicate successful retention and growth of top performers.
Can be determined by dividing the number of promoted individuals by the total number of employees.
Suggestions per Employee
LeadingEvaluates employee engagement in improving business processes, and reflects on the openness of a company to employee input.
- Formula
Suggestions submitted ÷ number of employees.- Example
- 600 ÷ 400 = 1.5 suggestions per employee.
- What good looks like
- there is no universal number — set it against your own baseline and track how many suggestions get implemented, since volume without follow-through erodes participation
- Weak → strong
- "Get more ideas from staff" → "Raise suggestions from 1.5 to 2.0 per employee this year, with every idea answered within 30 days, owned by the Continuous Improvement Lead".
HR-to-FTE Ratio
LeadingThe number of HR full time equivalents divided by the total number of full time equivalents.
- Formula
HR full-time equivalents ÷ total full-time equivalents.- Example
- (6 HR FTEs ÷ 400 total FTEs) × 100 = 1.5 per 100 FTEs.
- What good looks like
- SHRM's 2025 benchmarking puts the median at 1.98 HR staff per 100 employees, up from 1.58 in 2017; compare against peers of similar size and service model rather than one number
- Weak → strong
- "Right-size HR" → "Hold HR staffing at 1.5 per 100 FTEs while cutting the HR request backlog 20% this year, owned by the CHRO".
Helps determine HR's ability to provide services. Larger organizations typically have a smaller ratio, but more HR staff overall, than small businesses.
Cycle Time To Process Payroll
LaggingBetter when lowerShows timeframe of process, giving projection if assistance/updated process is needed.
- Formula
Total business days from period cut-off to payroll transmit ÷ number of payroll runs.- Example
- 60 days ÷ 12 payroll runs = 5 days.
- What good looks like
- APQC data shows organizations at the 25th percentile process payroll in three days or less, the median in five, and the 75th percentile in seven or more; lower is better
- Weak → strong
- "Speed up payroll" → "Cut payroll processing from 5 to 3 business days per run within two quarters, owned by the Payroll Manager via automated time capture".
This is the number of business days in the payroll process from start to finish.
Cycle Time To Resolve Payroll Errors
LaggingBetter when lowerThe number of business days it takes to resolve payroll errors reported by employees.
- Formula
Total business days to resolve reported errors ÷ number of errors resolved.- Example
- 150 days ÷ 30 errors = 5 days.
- What good looks like
- in APQC benchmarking, the best performers resolve a payroll error in at most two to four days while the weakest take five to 10 days or more; lower is better
- Weak → strong
- "Fix payroll mistakes faster" → "Cut average payroll-error resolution from 5 to 3 business days by Q2, owned by the Payroll Manager, reviewed monthly".
A high number of days could indicate the need to review your payroll process.
Percentage of Workforce Below Performance Standards
LaggingBetter when lowerKeeps tabs on the amount of low-performing employees in an organization.
- Formula
(Employees rated below standard ÷ total employees rated) × 100.- Example
- (24 ÷ 400) × 100 = 6%.
- What good looks like
- there is no universal number — lower is better, but a near-zero share can mean ratings are inflated; pair it with improvement plans and track how many people recover
- Weak → strong
- "Fix low performance" → "Cut the share of employees below performance standards from 6% to 4% by the year-end review, owned by department managers via improvement plans".
Use RAG Statuses To Strengthen Your Measures
Red–Amber–Green (RAG) statuses turn raw KPI data into a simple “strategy traffic light” that everyone can read at a glance, making it easier to spot where performance is on track, at risk, or off course. When thresholds are clearly defined and consistently applied, leaders can quickly shift attention and resources to the measures that most need intervention.
👉Our data shows that in a typical plan, 33% of organizational measures are green, or hitting targets.
👉Two-thirds — those that are amber and red — represent massive intervention opportunities. Amber signals potential problems or minor deviations from the plan. Red Indicates significant issues requiring immediate attention. Disciplined RAG usage can help your team focus in these areas.
👉About 22% of measures have a “Not Started” status, which could indicate they are of little importance. If one or more measures is “Not Started” for two consecutive quarters, archive it.
Require monthly RAG status updates for every measure you use to promote visibility and drive results.
Turn Your HR KPIs Into Action
Once you’ve defined your human resources KPIs, it’s time to start implementing them by creating a Balanced Scorecard. A scorecard is a cluster of data that helps your leadership team critically analyze the effectiveness of your HR strategies in relation to developing a competitive advantage, improving skills, managing your culture, reducing costs, etc. It provides the means to monitor workforce indicators, analyze workforce statistics, diagnose issues, and calculate financial impacts.
Important note: You don’t need to use all of the above KPIs in your scorecard. Take time to identify which HR metrics will bring the most value to your organization and department.
Learn everything you need to know about Balanced Scorecards in this article.
Your Job’s Not Done Yet
Once you’ve successfully aligned your human resources KPIs with the organization’s goals in a scorecard, you’ve still got work to do. Don’t forget to make these steps a routine part of your job:
1. Conduct regular meetings to review HR KPI progress
Take time to consistently review your departmental scorecard to ensure it stays relevant and top of mind. Our ClearPoint team meets monthly to talk about where we might be underperforming; annually, we discuss possible metrics to change or remove.
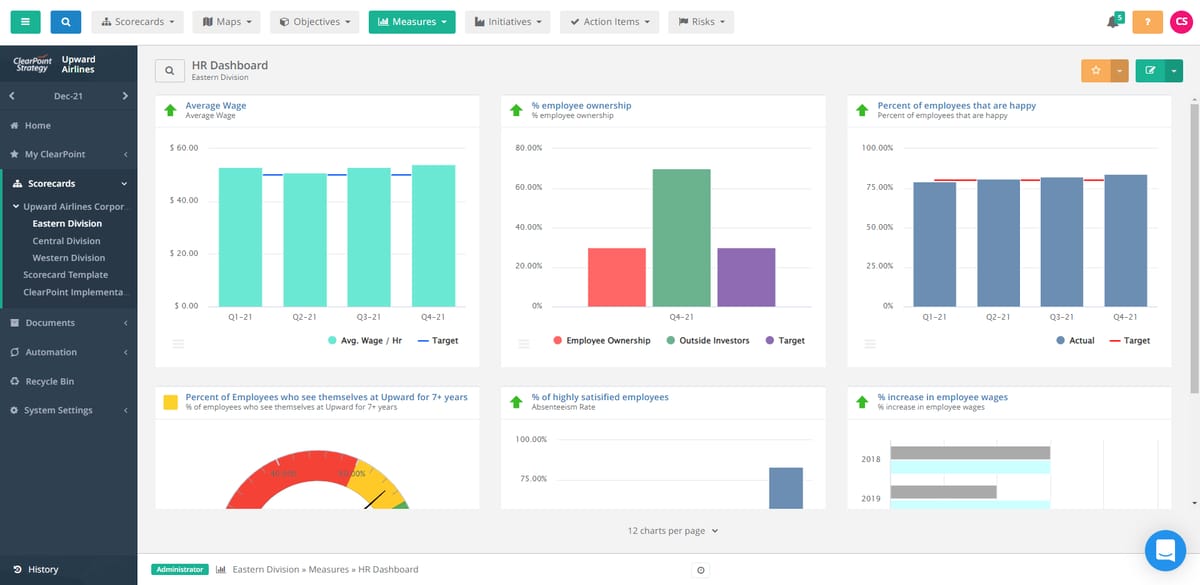
Visuals are especially helpful for departmental meetings because they make it easy to see performance at a glance. Dashboards, for instance (like the one created below in ClearPoint), capture a wealth of KPI data and allow you to present it meaningfully to the group. Everyone can quickly see where they’re falling behind target, and you can focus the conversation primarily on the problem areas.
2. Review your HR Scorecard with the leadership team
Make sure progress is aligned with the company’s strategic plan, and that it stays that way continuously. If ever organizational goals change, you may need to edit your own scorecard to maintain alignment.
3. Evaluate scorecard metrics periodically to ensure they are still valid
It’s almost inevitable that your measures will change at some point, and it will benefit you to get ahead of this. KPIs should be reevaluated whenever you complete an objective, as well as when your initiatives change. You might also discover that another KPI is a better performance indicator than a metric you’re currently using, which should also trigger a switch.
4. Share your HR metrics and progress with the entire organization
The HR KPI dashboard would also be useful here, to help communicate your department’s contribution to the strategic goals. Don’t be afraid to share both positive and negative results with the group—your department’s efforts to be transparent will generate employee goodwill, even if outcomes are different than expected.
You now have more than 50 HR KPI examples and know how to put the metrics into play with a balanced scorecard. Your next step is to choose the KPIs that will bring the most value to your organization and create your scorecard.
Unlock the Full Potential of Your HR Strategy with ClearPoint Strategy!
At ClearPoint Strategy, we provide the tools you need to measure and enhance your HR performance. Our advanced KPI software allows you to seamlessly track, manage, and report on all your HR metrics. Ready to transform your HR strategy? Book a demo with us today and discover how ClearPoint Strategy can help you implement and monitor effective HR KPIs.
See how ClearPoint runs your balanced scorecard — book a demo
Common questions
How do I pick which HR KPIs to put on the scorecard?
Start from the organization's strategic goals and keep only the HR measures that show whether HR is moving them. If the plan depends on growth, track time to fill and acceptance rate; if it depends on retention, track first-year and high-performer turnover. You do not need all 50 on this page; a handful tied to goals beats a long list.
How should we calculate turnover so the number means something?
Use one written formula, separations in the period divided by average headcount, and apply it the same way every period. Then split it: voluntary versus involuntary, first-year leavers, and high performers. A single overall rate hides the problem, because losing top performers or new hires in their first year costs far more than average attrition.
Which HR KPIs should the leadership team see?
Show leadership only the HR measures that tie directly to the strategic plan, not the full HR operating list. Typical picks are high-performer turnover, time to fill critical roles, employee net promoter score, workforce cost as a share of total expenses, and internal promotion rate. Keep transactional measures like payroll cycle time inside HR's own reviews.
When should an HR KPI be retired or replaced?
Review each KPI whenever an objective is completed or the initiatives behind it change, and at least once a year. Replace it when a better indicator emerges, when it no longer drives any decision, or when it has sat unreported for two consecutive quarters. Archive retired measures rather than deleting them so the history stays available.