
Get answers like this one, first.
Google’s AI Overviews now favor the sources you choose. Add ClearPoint once, and our research shows up in your AI answers — badged and prioritized.
Add ClearPoint as a Preferred SourceFree · one click · applies only to your own Google results.

Which strategic planning models are rising and falling? We analyze 20 years of U.S. Google Trends data.
Strategic planning models come in and out of favor. As of yet, however, there hasn’t been a clear, data-driven way to see which ones are gaining or losing momentum. That’s left strategy leaders without a good way to spot long-term shifts, pressure test their toolkit, and choose the right approach for the moment.
- Every strategy framework tracks the same three things: objectives, measures, and initiatives. The labels change; the core does not.
- Seven once-dominant models have lost search interest over two decades, including the Balanced Scorecard, SWOT, and Porter's Five Forces.
- Three models are gaining ground: VRIO, PEST analysis, and OKRs, which had almost no search activity until recent years.
- Declining search popularity does not mean a model failed; the Balanced Scorecard reshaped how organizations measure beyond financials.
- Choose a framework for how it helps you execute, not for how trendy it currently looks in search data.
We dug into the data in hopes of providing some visibility into the longevity and popularity of various frameworks. To do so, we used Google search data, specifically Google Trends. Google Trends aggregates and normalizes search activity to show the relative popularity of a term over time in a given region. Some parameters of our search:
- We chose to use searches in the United States only.
- We set the timeframe to the last 20 years (Oct 2005 – Oct 2025).
(Note that in all the charts below: 100 equals peak interest for this topic, 50 is half peak, and 0 means no searches.)
For strategic planning searches specifically, Google Trends likely reflects two realities at once: what practitioners are researching and using in the field and what students are being taught in universities.
Below, you’ll see which strategic planning models have been shrinking and which have been growing in popularity over the past two decades.
7 Strategic Planning Models Shrinking In Popularity
These seven models are less popular than they were two decades ago.
1. Balanced Scorecard
The Balanced Scorecard is a strategy management framework created by Drs. Robert Kaplan and David Norton that translates an organization’s vision into objectives, measures (KPIs), targets, and initiatives across multiple perspectives to align day-to-day work with long-term strategy.
Search activity over the past 20 years looks like this:
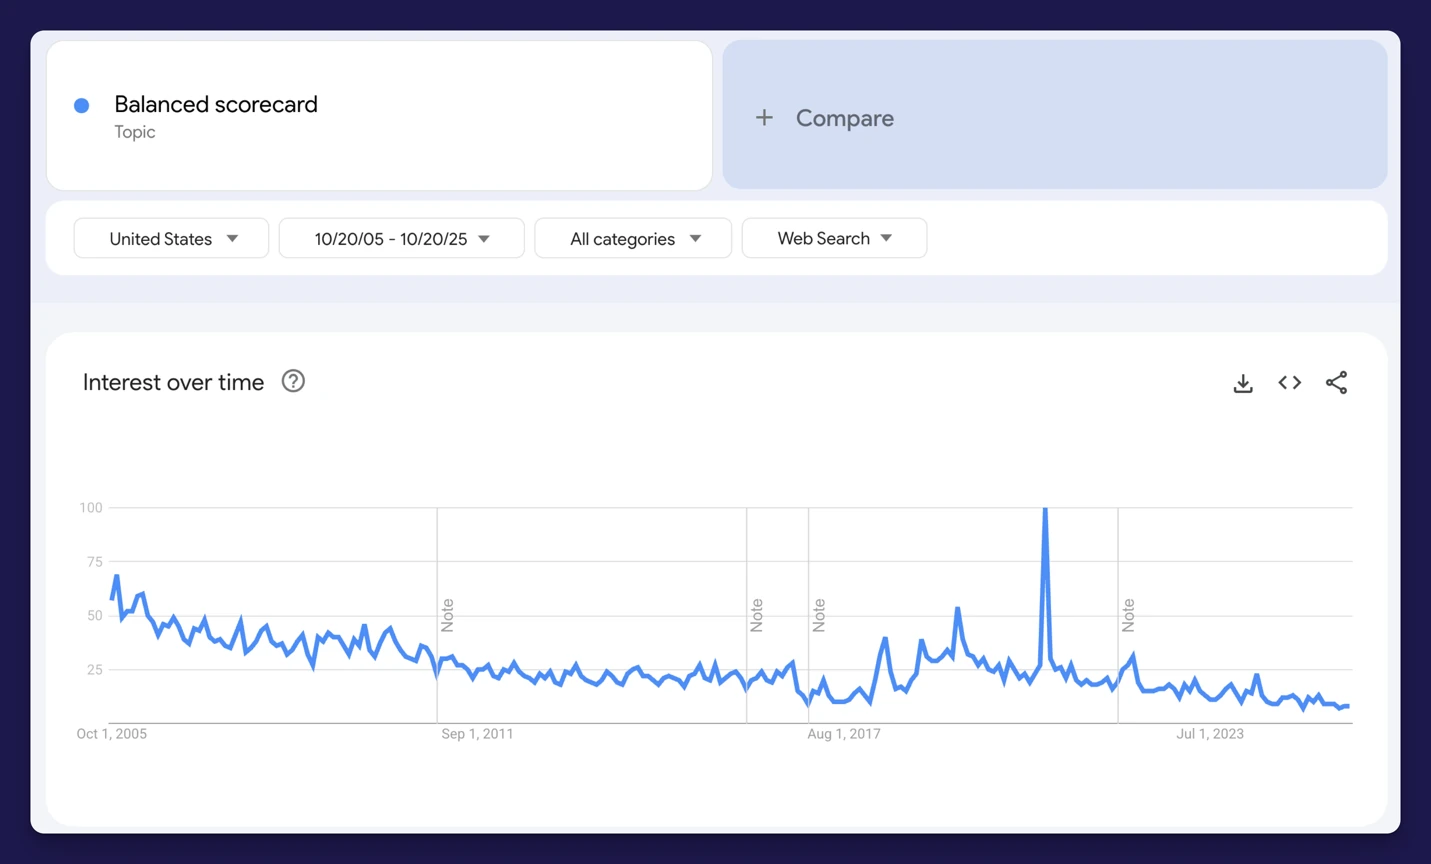
- Trend line: In the United States, search interest for “Balanced scorecard” shows a long, gradual decline to a lower baseline.
- Momentum: Over the last 12 to 24 months, interest appears flat to slightly negative with modest week-to-week variation.
- Bottom line: Based on Google Search data alone, the Balanced Scorecard is roughly 80% less popular than it was 20 years ago.
- My take: The Balanced Scorecard isn't dead, it's just no longer the default.
Related: What Is a Balanced Scorecard? A Definition
2. SWOT Analysis
SWOT Analysis is a straightforward strategic planning tool that uses an organization’s internal strengths and weaknesses and the external opportunities and threats in its environment to inform strategy.
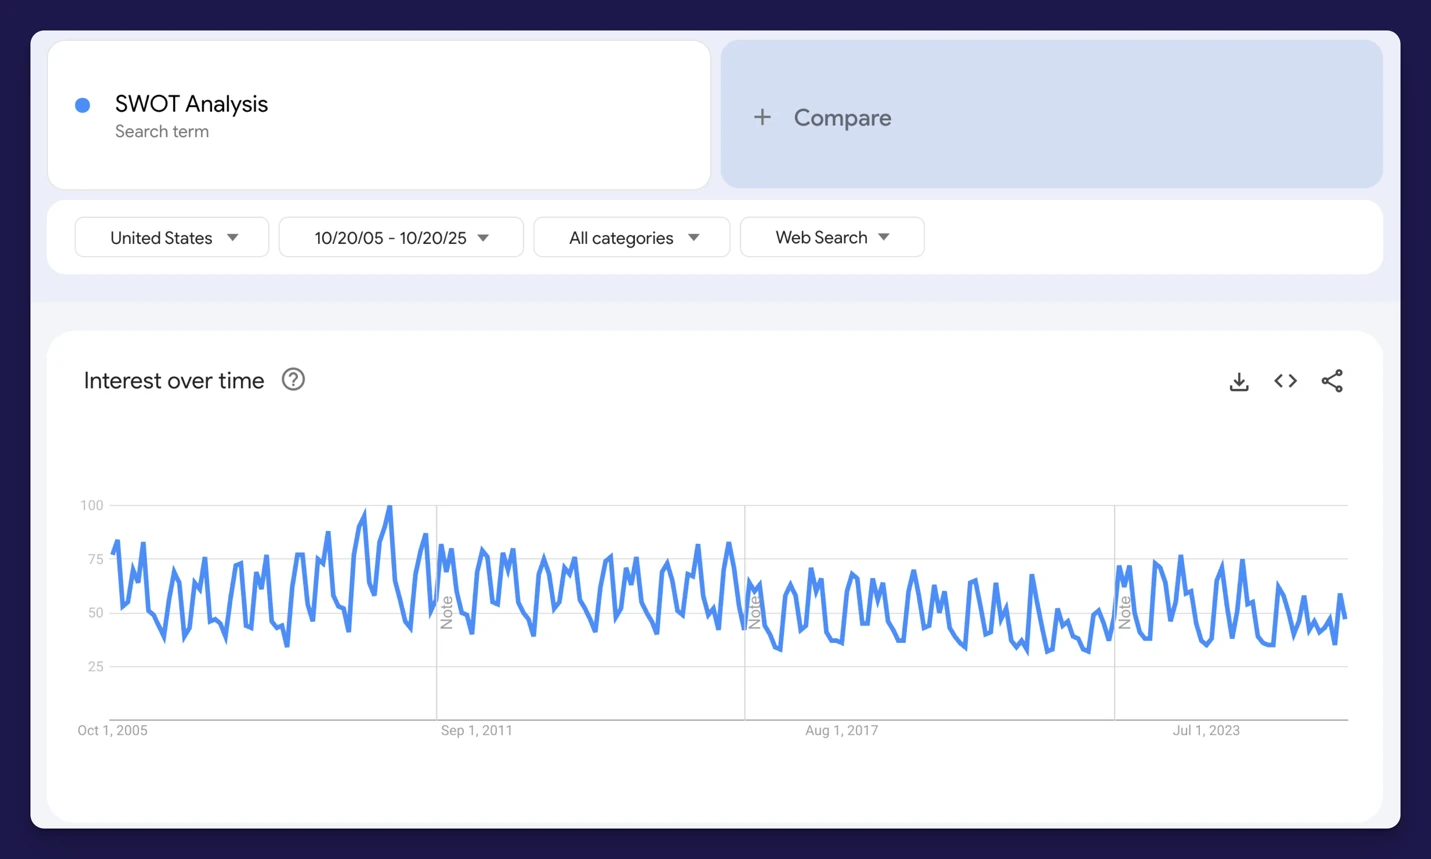
- Trend line: In the United States, search interest for “SWOT analysis” rose from 2005 to roughly 2010 and then began a gradual, long-term decline, with consistent, seasonal spikes throughout.
- Momentum: Over the last 12 to 24 months, interest appears broadly stable, following the familiar academic-year peaks and troughs.
- Bottom line: Based on Google Search data alone, SWOT Analysis is about 30% less popular than its peak approximately 15 years ago.
- My take: SWOT’s not going anywhere because it's easy to teach. It’s also not going to save your strategy.
Related: SWOT Analysis
3. Gap Analysis
Gap analysis is a technique that compares an organization’s current state to its desired future state to identify the gaps and the initiatives needed to close them.

- Trend line: In the United States, interest in “gap analysis” declined steadily from the mid 2000s (its high point) through the mid 2010s, leveled off for several years, and has turned upward again since 2024.
- Momentum: Over the last 12 to 24 months interest has accelerated, with a clear upswing into late 2025.
- Bottom line: Based on Google Search data alone, gap analysis is about 20% less popular than it was 20 years ago, but trending up.
- My take: It’s boring, practical, and effective. Maybe that's exactly what organizations need right now.
Related: Gap Analysis
4. Porter’s Five Forces
Porter’s Five Forces is a framework for analyzing industry structure and competitive pressure by evaluating the threat of new entrants, the bargaining power of suppliers and buyers, the threat of substitute products or services, and the intensity of competitive rivalry.

- Trend line: In the United States, interest shows a long-term decline with pronounced academic seasonality. After a mid-to-late resurgence in the 2010s, interest has fallen steadily since 2021.
- Momentum: Over the last 12 to 24 months, the trend is downward with lower highs and lows, stabilizing near the lower end of the historical range.
- Bottom line: Based on Google Search data alone, Porter’s Five Forces is roughly 50% less popular than it was 20 years ago.
- My take: It is still taught religiously in business schools. Practitioners are less convinced it's worth the effort when industry boundaries blur every six months.
Related: Porter’s Five Forces
5. Blue Ocean Strategy
Blue Ocean Strategy is an approach that encourages organizations to create uncontested market space by differentiating and lowering cost simultaneously, rather than competing head-to-head in crowded “red oceans.” It originated as a widely read article in the early 2000s and was expanded into a bestselling book by W. Chan Kim and Renée Mauborgne in 2005.
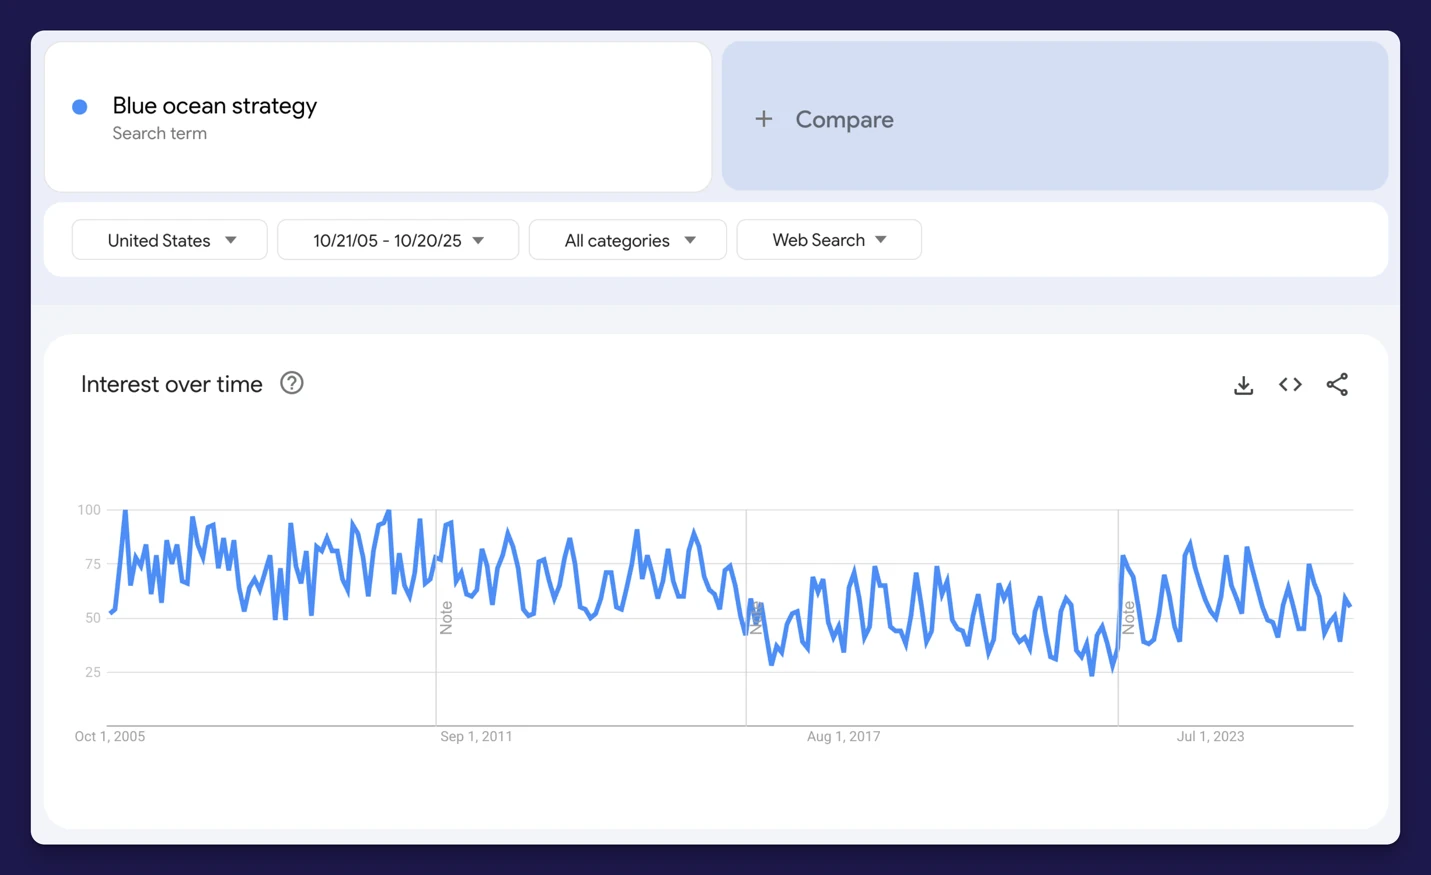
- Trend line: In the United States, search interest peaks around 2005 — the year the book was published — and remains elevated through the early 2010s. It then declines, with a pronounced dip around 2020 followed by a partial recovery.
- Momentum: Over the last 12 to 24 months, interest is stable to slightly down from the post-2021 rebound, with persistent academic seasonality.
- Bottom line: Based on Google Search data alone, Blue Ocean Strategy is about 30% less popular than it was 20 years ago.
- My take: "Create a blue ocean" is easier said than done. Organizations got tired of being told to just innovate harder.
Related: Blue Ocean Strategy
6. Hoshin Kanri (Hoshin Planning)
Hoshin Planning is a strategy deployment method that translates a handful of breakthrough objectives into aligned department and team goals, projects, and measures, using catchball and cascading to keep daily work tied to long-term direction.
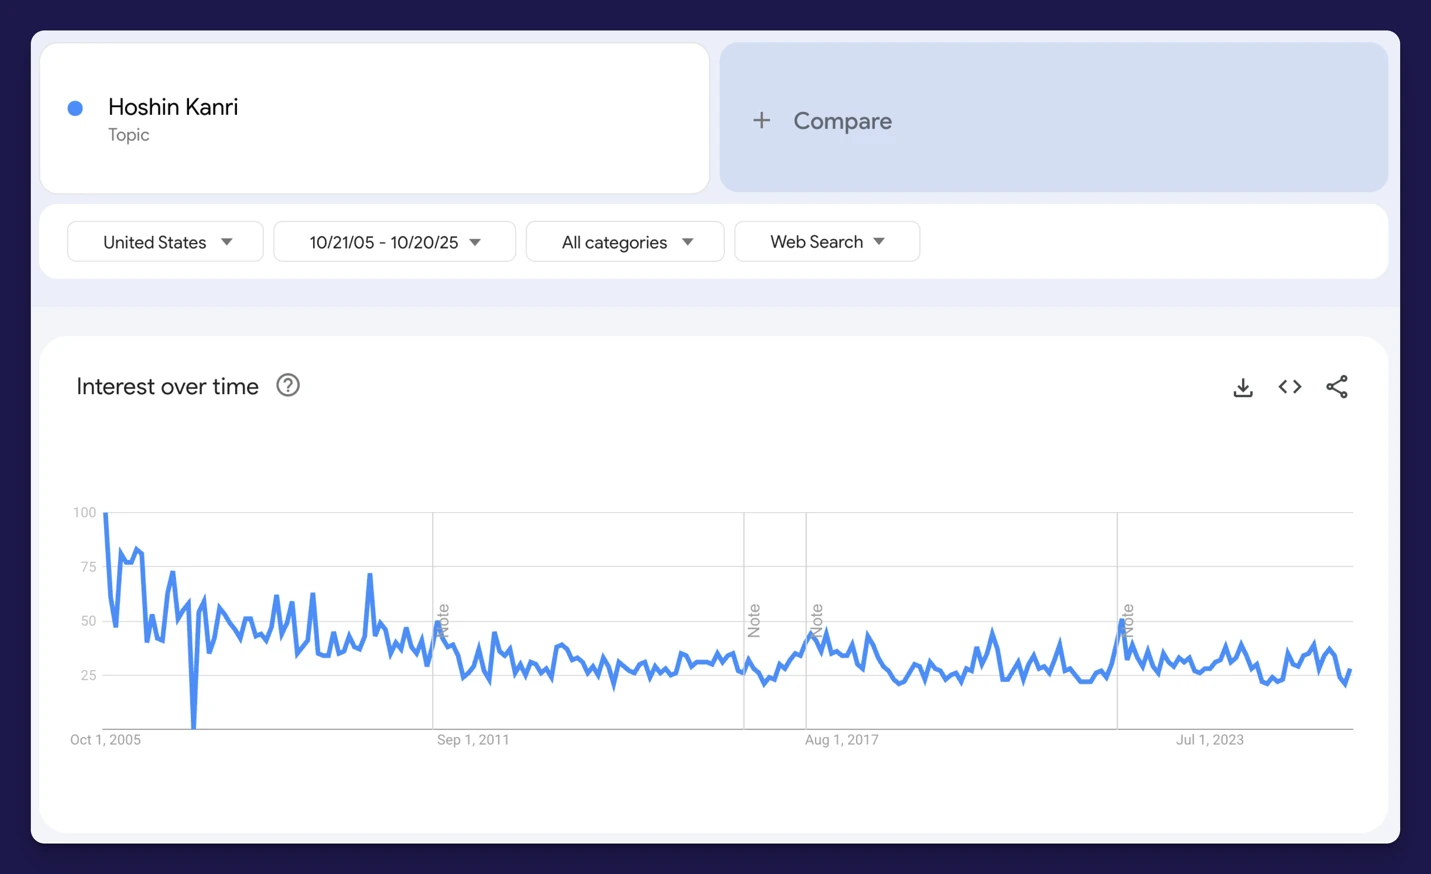
- Trend line: In the United States, interest declines steadily from the mid 2000s (its high point) through the mid 2010s, then stabilizes at a lower baseline with modest, periodic upticks.
- Momentum: Over the last 12 to 24 months, interest is flat to slightly down within that lower range.
- Bottom line: Based on Google Search data alone, Hoshin Planning is roughly 60% less popular than it was 20 years ago.
- My take: Hoshin is powerful but process-heavy. In an era of quarterly OKRs, annual cascading feels like strategy molasses.
Related: Hoshin Planning
7. Theory of Constraints (Constraints Analysis)
The Theory of Constraints focuses improvement on the single most critical bottleneck in a process or system, elevating that constraint to increase overall throughput and performance.
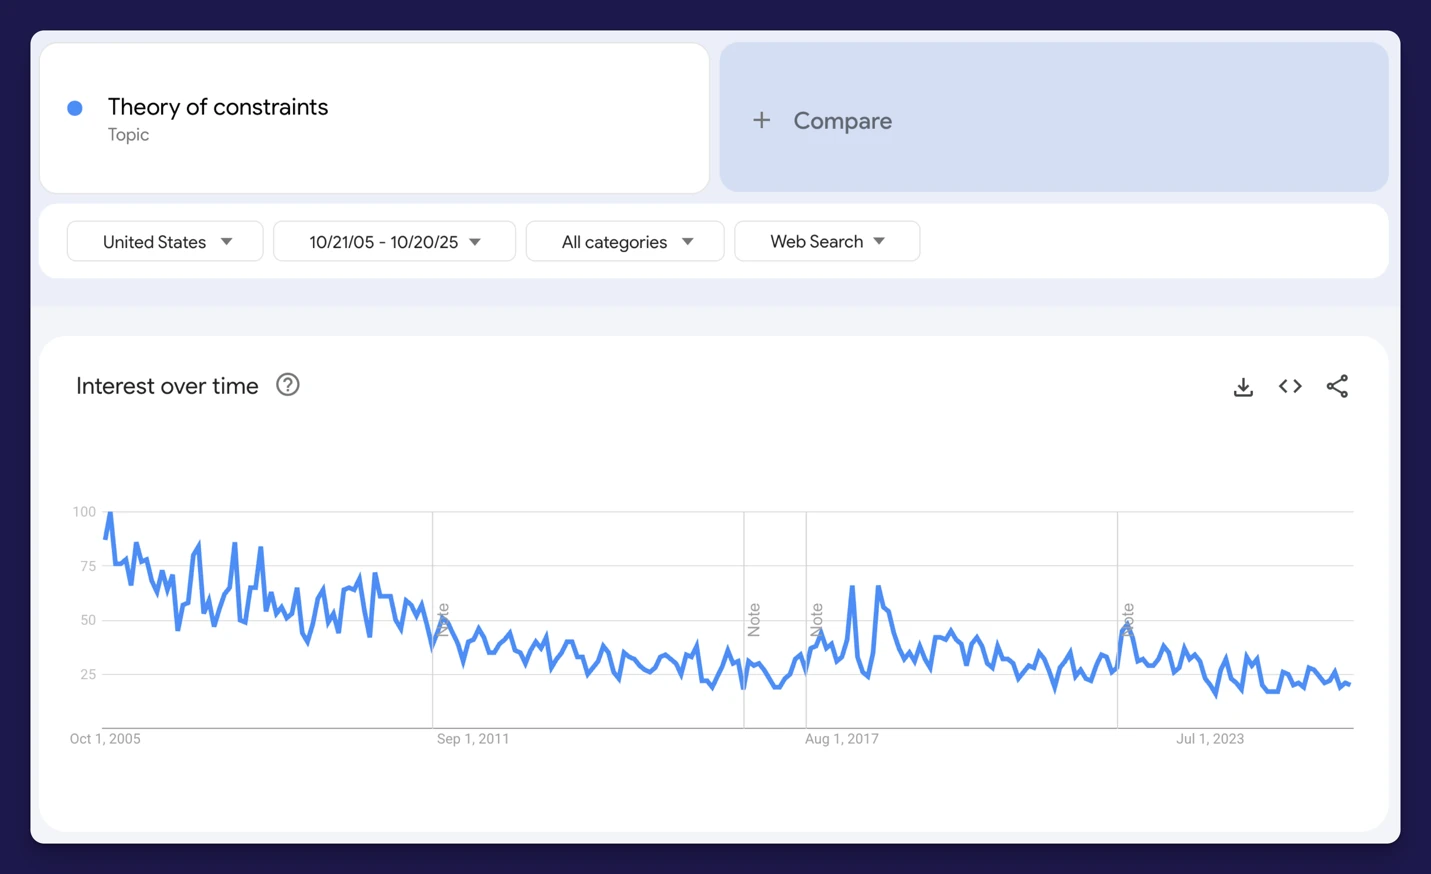
- Trend line: In the United States, interest declined steadily from mid-2000 highs and has continued trending downward with intermittent spikes.
- Momentum: Over the last 12 to 24 months, interest is slightly down and moving within the lower end of its historical range.
- Bottom line: Based on Google Search data alone, the Theory of Constraints is roughly 70% less popular than it was 20 years ago.
- My take: It’s brilliant for manufacturing and ops, but never quite made the leap to mainstream strategy.
Related: Theory of Constraints
3 Strategic Planning Models Growing In Popularity
These three models are more popular than they were two decades ago.
1. VRIO
The VRIO framework evaluates whether a resource or capability is valuable, rare, and costly to imitate; it also evaluates whether the organization is set up to capture its value, helping determine if it can maintain a sustained competitive advantage.
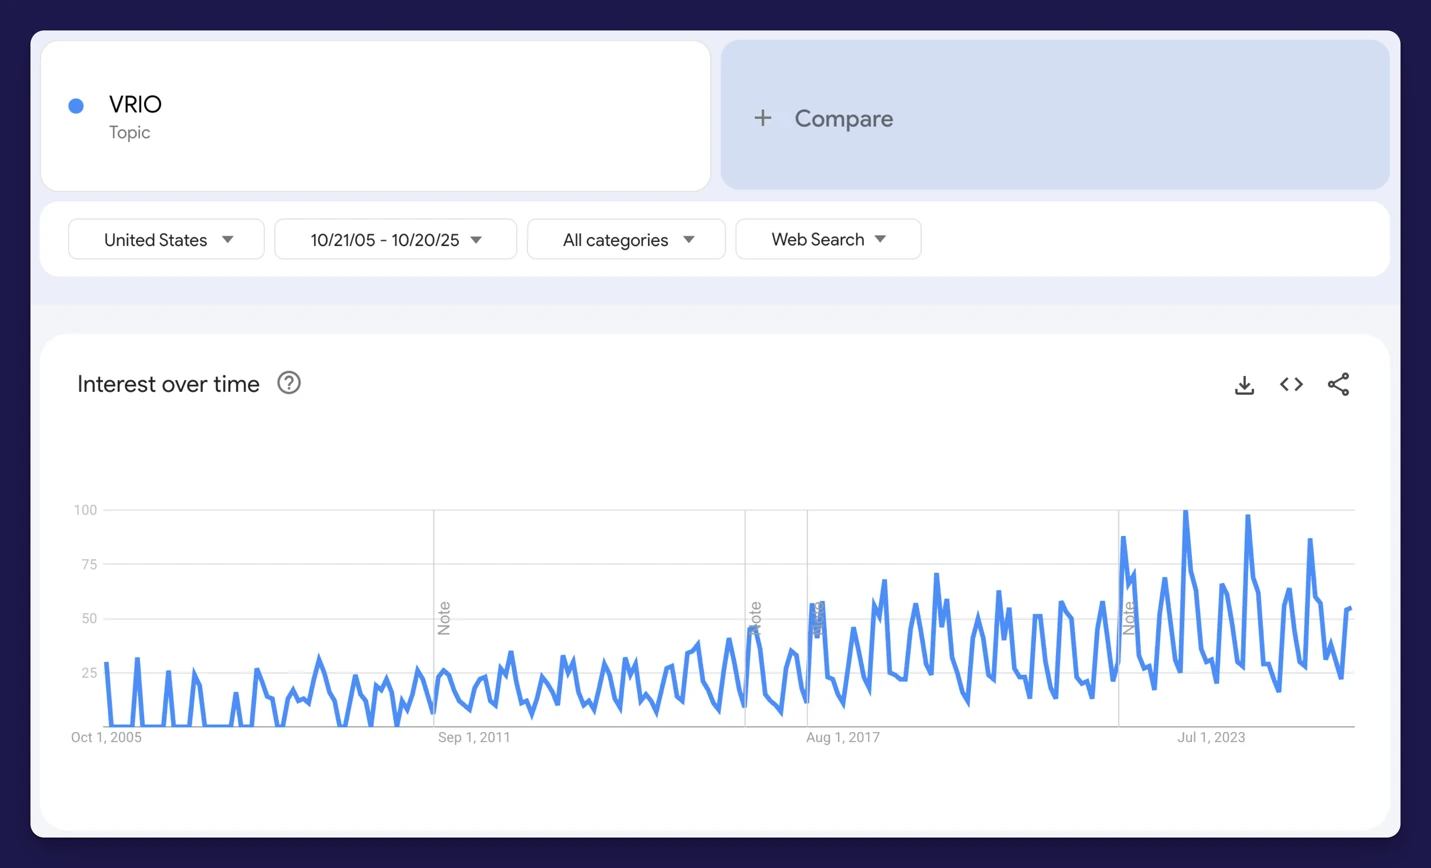
- Trend line: In the United States, interest in “VRIO” has climbed steadily over the last two decades, with the highest peaks occurring in the last few years.
- Momentum: Over the past 12 to 24 months, interest remains elevated with recurring December spikes — likely tied to end-of-year planning cycles and academic calendars.
- Bottom line: Based on Google Search data alone, VRIO is about three times more popular than it was 20 years ago.
- My take: It’s concise, teachable, and actually useful for competitive positioning. VRIO is having a moment.
Related: VRIO Framework
2. PEST Analysis
PEST analysis is an environmental scanning framework that evaluates the political, economic, social, and technological factors that shape an organization’s external context and inform strategy.
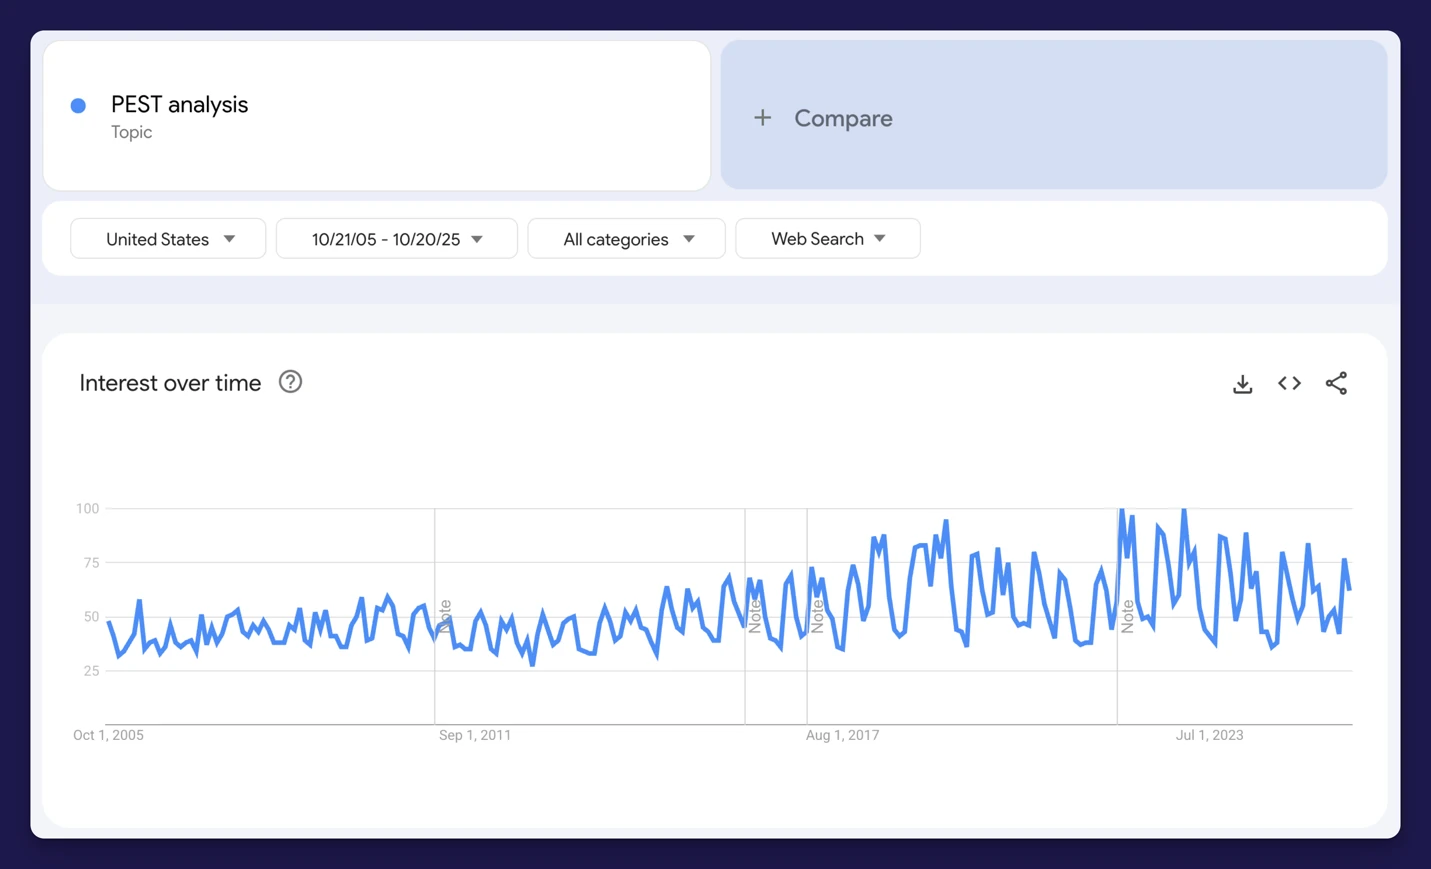
- Trend line: In the United States, interest in “PEST analysis” rose steadily from 2005 through 2019, declined sharply from 2019 to 2021, then reached a new peak in 2022 before easing slightly.
- Momentum: Over the last 12 to 24 months, interest is gently down from its 2022 high but remains elevated versus its long-term average. The 2019–2021 dip likely reflects COVID-era academic and training disruptions (PEST is heavily used in coursework), followed by a 2022 surge as organizations reassessed macro risks, supply chains, and geopolitical shifts.
- Bottom line: Based on Google Search data alone, PEST analysis is about 50% more popular than it was 20 years ago.
- My take: That 2022 surge? Organizations suddenly remembered that geopolitics, supply chains, and macro risks actually matter. Who knew?
Related: PEST Analysis
3. OKRs (Objectives and Key Results)
OKRs is a goal setting framework that aligns organizations around clear, qualitative objectives and a small set of quantitative key results to measure progress.
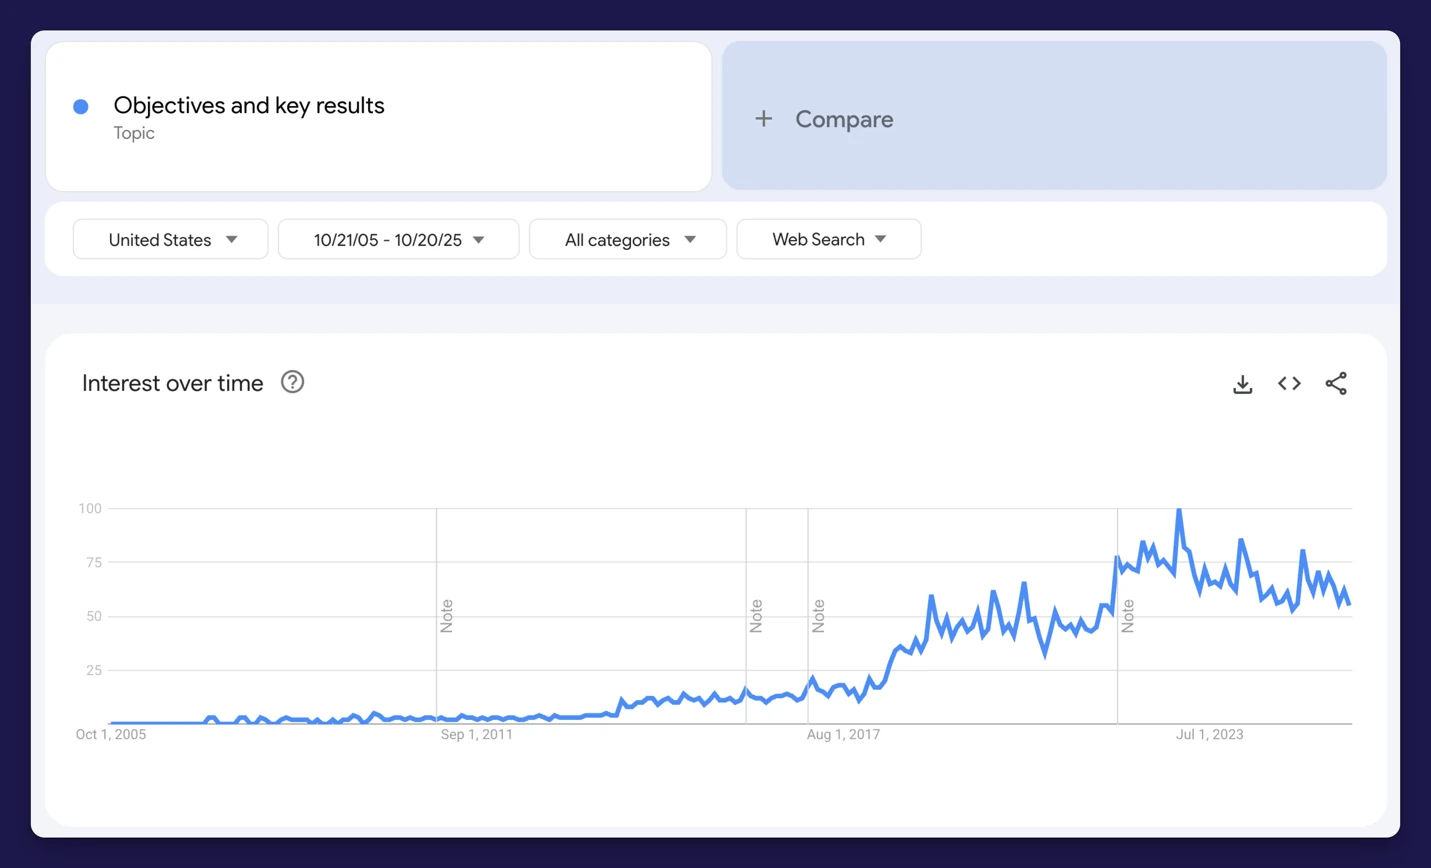
- Trend line: In the United States, there’s essentially no search activity until 2007. Interest then grew modestly followed by a decade of strong, consistent growth from about 2014 to 2023, peaking around 2022 before easing slightly.
- Momentum: Over the last 12 to 24 months, interest shows a slight downtrend from the 2022–2023 highs while holding a clearly elevated baseline.
- Bottom line: Based on Google Search data alone, OKRs is the fastest-growing model in this analysis — about 50× more popular than it was 20 years ago.
- My take: The runaway winner. Lightweight, quarterly, outcome-focused, Silicon Valley-approved. Love them or hate them, they're the dominant framework right now.
Related: OKRs
What Everyone Misses About Strategic Planning Models…
In 25+ years helping organizations execute strategy, here’s what I learned: Every single framework is just a different way of tracking the same three things:
- Objectives (goals, outcomes, priorities)
- Measures (KPIs, key results, metrics)
- Initiatives (projects, actions)
That's it. That's the whole game.
- Balanced Scorecard? Objectives, measures, initiatives
- OKRs? Objectives, key results (measures), initiatives
- Hoshin Planning? Breakthrough objectives, measures, projects
- VRIO? Identifies strategic objectives measured by competitive advantage
- Gap Analysis? Current vs. desired state (objective), with initiatives to close the gap
The terminology changes. The cadence varies. But the underlying structure is identical.
The Balanced Scorecard's Real Legacy
Yes, the Balanced Scorecard has declined in search popularity. But it started a revolution that’s had a lasting effect.
Before Kaplan and Norton's 1992 HBR article, most organizations only tracked financial metrics. The Scorecard said: What if we measured customer satisfaction, internal processes, and learning & growth too? What if strategy was more than just financials?
That idea — that you can and should track more than just the bottom line — changed everything.
The evidence:
- It was the top-selling series in Harvard Business School Publishing history.
- Every framework developed since then assumes you're tracking multiple dimensions of performance.
- OKRs, Hoshin, and modern performance management are all derivatives of this core insight.
The bottom line: The Balanced Scorecard may no longer be the dominant framework but it created the category. OKRs didn't replace it — they simplified it, sped it up, and made it friendlier for tech companies. The DNA is the same.
The AI Shift Nobody's Talking About
Here's what's changing right now: AI is collapsing the cost of testing multiple frameworks simultaneously.
It used to take weeks to:
- Map your current objectives to a different framework
- Rewrite measures to match new terminology
- Rebuild reports and dashboards
- Train teams on the new structure
Now, all that takes minutes.
This is significant because it allows you to:
- Run OKRs and Balanced Scorecard views of the same strategy.
- Test what resonates with different stakeholders.
- Switch cadences (annual to quarterly) without rebuilding everything.
- (Finally) stop arguing about frameworks and start executing.
The catch is that you still need clarity on your actual objectives, measures, and initiatives. AI can't fix fuzzy thinking, it just makes fuzzy thinking faster.
My prediction: Within two to three years, the framework debate will become irrelevant. Teams will fluidly translate between frameworks based on audience and context, the same way you'd switch between a slide deck and a one-pager. The framework matters even less than you think.
What does all this mean for strategy leaders?
The data shows a clear shift: Lightweight, outcome-driven tools (OKRs, VRIO) are rising while legacy frameworks are declining or stabilizing. It’s smart to know why certain frameworks are rising in popularity, but popularity isn’t everything. To make any strategic planning model work for you, follow these guidelines:
- Align training with where you're headed. If your team debates Hoshin nuances while competitors run quarterly OKRs, you've got a problem.
- Match frameworks to your execution cadence. If you do annual planning, Balanced Scorecard or Hoshin will still work. If you do quarterly sprints, OKRs or lightweight scorecards are better.
- Refresh your vocabulary. If your software calls everything "strategic themes" but your CEO just learned about OKRs, you're creating friction.
- Use AI to quickly test frameworks. Don't get stuck in analysis paralysis. Pick one, track consistently, and adjust based on what works.
- Remember what actually matters. Objectives. Measures. Initiatives. Execute. Adjust. Repeat.
Ultimately, Google Trends is only one lens. The best framework fits your organization’s context, cadence, and culture. But don't overthink it — they're all the same thing anyway.
Frequently Asked Questions
Which strategic planning models are declining in popularity?
Search interest has fallen over two decades for seven established models: the Balanced Scorecard, SWOT Analysis, Gap Analysis, Porter's Five Forces, Blue Ocean Strategy, Hoshin Kanri, and the Theory of Constraints. Declining searches reflect shifting attention, not that any model stopped working.
Which strategic planning models are growing?
Three frameworks have gained search interest over the same period: VRIO, PEST Analysis, and OKRs. OKRs in particular went from almost no search activity to broad adoption, driven largely by technology companies popularizing the goal-setting approach.
Is the Balanced Scorecard still relevant?
Yes. Although its search popularity has declined, the Balanced Scorecard remains foundational. Before Kaplan and Norton's 1992 work, most organizations tracked only financial metrics. The Scorecard introduced measuring strategy across multiple perspectives, an idea now built into nearly every modern framework.
What do all strategic planning models have in common?
Every framework is a different way of tracking the same three things: objectives (goals and priorities), measures (KPIs and key results), and initiatives (projects). Once you see that shared structure, choosing a model becomes a question of fit and execution rather than fashion.
How should I choose a strategic planning model?
Pick the model that best fits how your organization works and how you intend to execute, not the one trending in search data. The right framework clarifies objectives, measures, and initiatives for your team and keeps strategy visible and updated.