.svg)
Google AI answers
Better answers, right in Google.
Google lets you choose the sites its answers come from. Choose ClearPoint, and you’ll see ours first.
One click. Only changes what you see — undo it anytime.

The 7 features that decide whether a city's strategy software gets used - ranked from 21,000+ plans across 158 cities and counties, with a 5-vendor matrix.
- Report automation earns the top spot. Government organizations track roughly 2.3× more measures per organization than private-sector teams (983 vs. 429). Reporting is where that weight lands.
- 75.2% of assigned owners in city and county plans have never logged a single update. Accountability workflows — named owners, automated reminders, visible update history — are the feature built to fight that number.
- 84% of local governments maintain zero dependency links between their plans. Separately, cities without a strategy map score zero objectives five times as often as cities with one.
- Lean scorecards get scored 6.5× more often than crowded ones. Under three measures per objective: 57.1% actively scored. Twelve or more: 8.8%.
- No major strategy vendor currently publishes a GovRAMP verification, and FedRAMP does not govern city purchases. Security review is where procurement stalls; know what to ask for before the RFP.
The council packet is due Thursday. On Tuesday, a performance analyst opens nine spreadsheets, four department PDFs, and an email thread titled “FINAL final numbers.” The strategic plan this packet reports on took the city eighteen months and a citizen task force. The packet itself will take three days.
That Tuesday is what cities actually buy strategy software for.
We pulled the data from 21,000+ strategic plans across 562 organizations — 158 of them cities and counties — and ranked the seven features that decide whether the software gets used or quietly abandoned. Here they are.
What features matter most in government strategy software for cities?
The seven features that matter most in government strategy software are council report automation, ADA-compliant public dashboards, accountability workflows, cross-plan alignment, project and milestone tracking, automated data collection, and procurement-ready security. Here they are in order, with the evidence behind each.
- Council and board report automation — the packet builds itself
- Public dashboards residents can actually use — ADA-ready, phone-first
- Accountability workflows — owners, reminders, update history
- Cross-plan alignment and linking — one system, not twenty silos
- Project and milestone tracking at municipal scale
- Automated data collection and integrations
- Procurement-ready security and records compliance
How we ranked these. The order comes from our platform data: 21,000+ strategic plans across 562 organizations, including 158 U.S. cities and counties, cross-read against the criteria cities put in real RFPs. Local-government figures were re-queried on August 13, 2026, with demo, training, and test accounts excluded. Behavioral rates (scoring, updating) are computed on the 153 cities and counties holding at least 20 measures and 3 objectives. We report two distinct measures of plan connection and keep them separate: dependency links between plan elements, and the presence of a strategy map. Longer-horizon completion figures come from our separate eight-year research set of local-government plans (2017–2024). Third-party claims are linked to their sources.
1. Council and board report automation
Report automation is the feature that pays for the software. A city that reports to council monthly builds twelve packets a year, and the software should build them.
The math explains why this ranks first. Government organizations track about 2.3× more measures per organization than private-sector companies — 983 versus 429 in our platform data. Every one of those measures eventually appears in front of a council member, a board, or a resident. GFOA recommends treating performance measures as an integral part of the budget process, which means the reporting burden compounds every fiscal cycle. And GASB Statement No. 103 is now in effect for fiscal years beginning after June 15, 2025. Its MD&A requirements push finance teams to discuss trends in economic and demographic data — and that discussion needs numbers someone can pull.
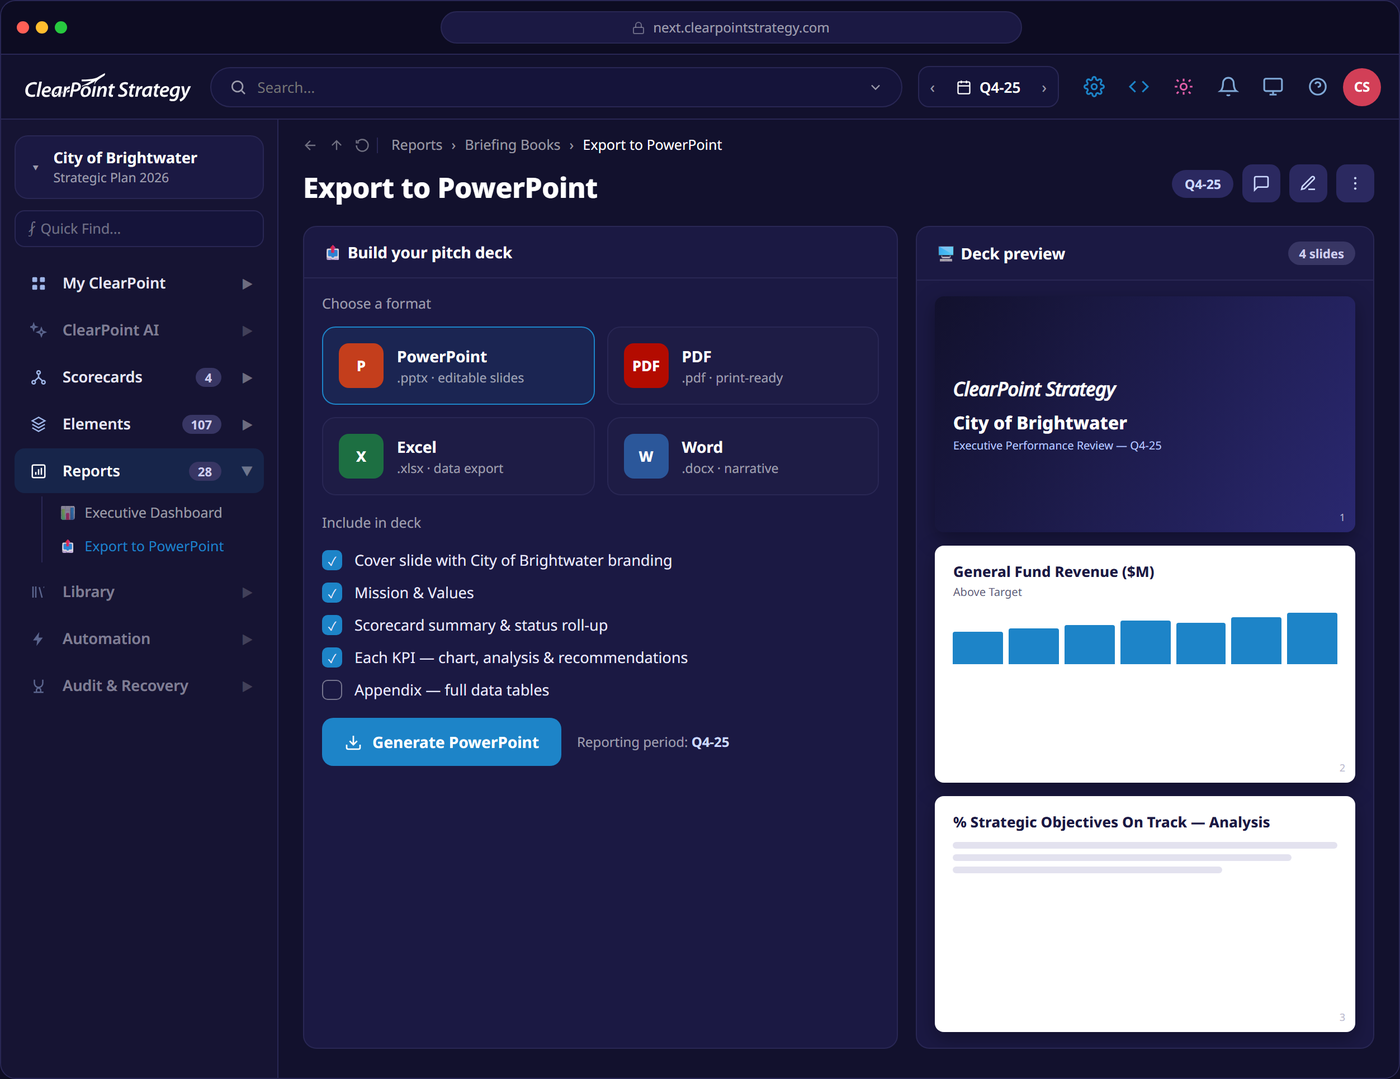
What the feature looks like when it’s real: reports that assemble themselves on a schedule, update when a department revises a figure, and export in the format your clerk needs the night before an agenda deadline.
In the demo, ask for:
- A report that assembles itself on a schedule you set — the monthly council packet, the quarterly board book
- A department revising a figure and the packet updating without anyone reopening it
- Export in the exact format your clerk needs: agenda-ready PDF, branded PowerPoint, printable packet
If assembling the packet still requires a human and a weekend, the feature is a brochure.
2. Public dashboards residents can actually use
A public dashboard is the one feature your residents will ever see. It has to load on a phone, read in plain language, and meet accessibility law.
Cities hold a trust advantage worth protecting: 65% of Americans trust their local government to handle local problems (Gallup, November 2025), while trust in Washington sits at 17% (Pew, December 2025). Published performance data is how that advantage compounds. The What Works Cities certification — 43 criteria, more than 100 certified cities, Philadelphia’s Gold award in February 2026 — treats public performance data as a certification-grade capability that a city has to demonstrate, in public, on the record.
The legal clock is running too. The Department of Justice set the standard for government web content at WCAG 2.1 Level AA. After the April 2026 extension, cities of 50,000 or more must comply by April 26, 2027; smaller cities and special districts by April 26, 2028. Your dashboard is government web content. It’s covered.
This feature works in the wild. The City of Bartlett, Tennessee runs its Vision 2030 plan on a public dashboard any resident can open, built alongside a strategic plan the city stood up in 13 months. The City of Germantown, Tennessee — a Baldrige Award winner — publishes its performance the same way. For the full playbook, see our guide to public dashboard best practices.
In the demo, ask for:
- The dashboard opened on a phone — not just on the demo laptop
- Written WCAG 2.1 AA conformance evidence (an ACR/VPAT), not a verbal “we’re accessible”
- A resident-facing view in plain language — no license, no login, no training required
3. Accountability workflows: owners, reminders, update history
Every element in the plan needs a named owner, an automated nudge, and an update trail anyone can audit. This is the feature that decides whether your data stays alive.
Here is the number that should shape your RFP. Across the 158 cities and counties on our platform, 3,834 people own at least one metric, objective, or project. Of those, 75.2% have never logged a single update. They exist in the system as accountable parties. They have never once behaved as one.
ClearPoint platform data
Three in four assigned owners never log an update
an update
75.2% have never logged a single update
24.8% have logged at least one update
Source: ClearPoint platform · 3,834 element owners across 158 U.S. cities and counties · August 2026
Assigning owners in a kickoff meeting accomplishes nothing by itself. The software has to close the loop: reminders tied to reporting cycles, and an update history that shows who touched what, and when. The downstream effect sits in the same data. Of the 153 cities and counties running an established scorecard, only four score more than half of their objectives. Four. The gap between intention and follow-through is the industry’s defining problem, and this feature set is the tooling built against it.
Update history earns its keep twice. It keeps owners honest week to week, and it answers records requests and council inquiries without an archaeology project.
In the demo, ask for:
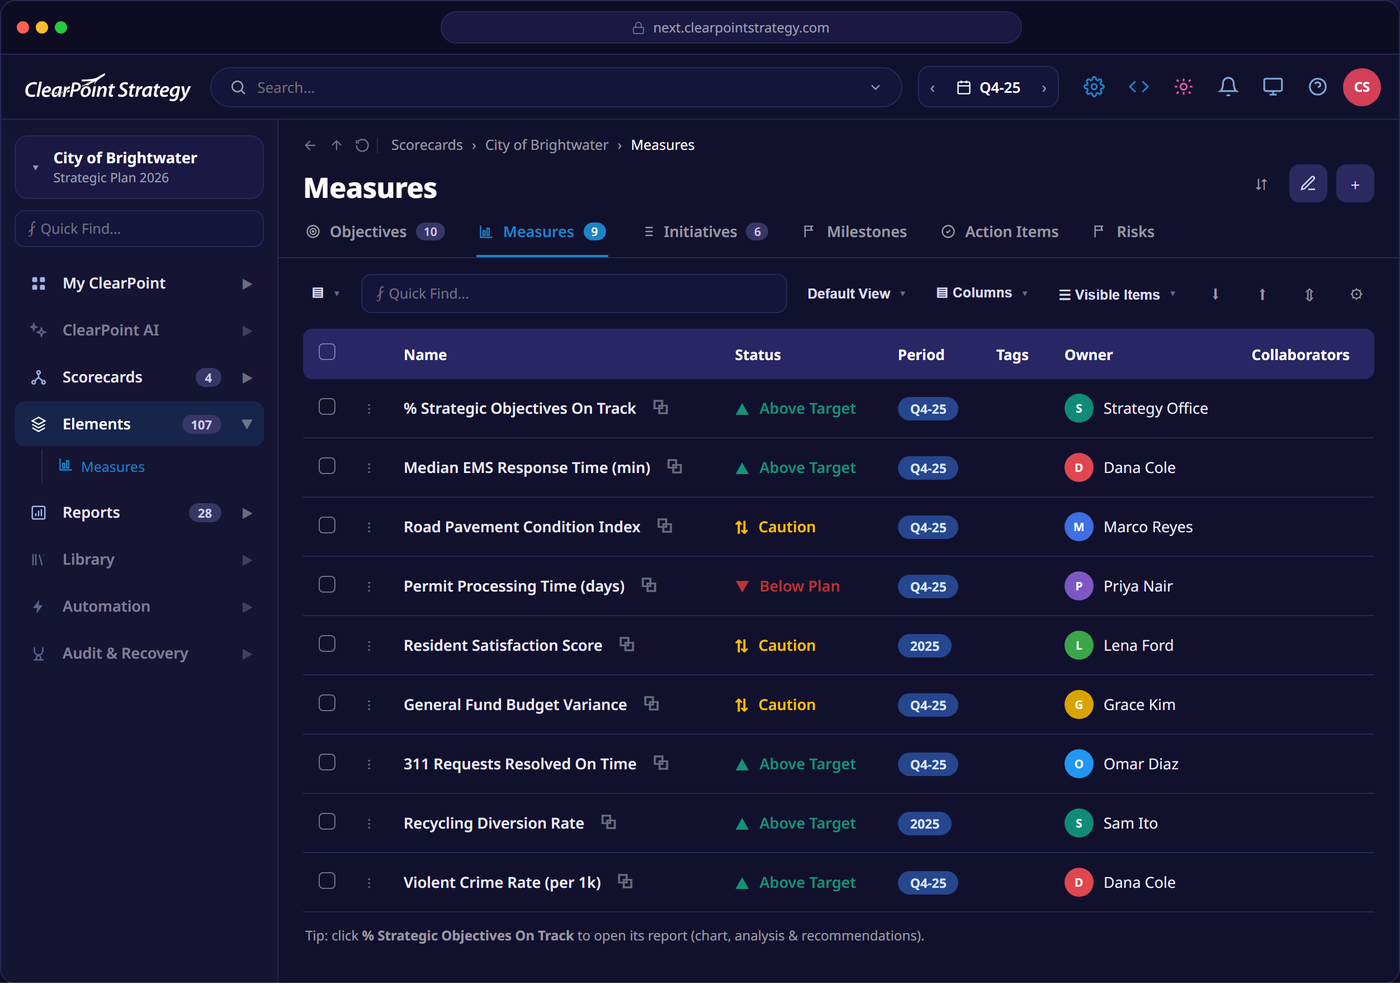
- Assigning an owner and watching the reminder fire on the reporting cycle — automated, not a manual nudge
- The update history on a single measure: who changed what, and when
- A report listing every owner who has never logged an update — the 75.2% view, on your own plan
We wrote separately about why cities abandon strategic planning software; ownerless data is the recurring villain.
4. Cross-plan alignment and linking
Cities run many plans at once, and the software has to connect them. The citywide strategic plan, the comprehensive plan, the CIP, and a dozen department plans should read as one system.
Fragmentation is the norm: the median local government on our platform runs about 20 separate plans. Whether those plans are wired to each other is a different question, and the answer is usually no. 84% of local governments — 133 of the 158 we analyzed — maintain zero dependency links between plan elements. Nothing cascades. Nothing rolls up. A department can miss its target all quarter without the citywide plan registering a flicker.
The other half of alignment is the strategy map, and there the split is stark. Among the 153 cities and counties with an established scorecard, those without a strategy map score zero objectives 64.7% of the time. Those with one: 12.6%. Roughly a five-fold difference in whether the plan gets evaluated at all. We frame that as correlation and mean it — the cities that build strategy maps are plausibly the cities that were already serious — but it is the sharpest split anywhere in our local-government data, and it is worth putting to a vendor directly.
Bartlett structures it exactly this way: 11 departments own objectives and measures linked to five citywide focus areas. “Previously, you had everybody doing all these great things, but in their own separate entities,” Steve Sones, Bartlett’s Chief Administration Officer, told us. “What ClearPoint and the strategic plan helped us do is bring all that together.”
In the demo, ask for:
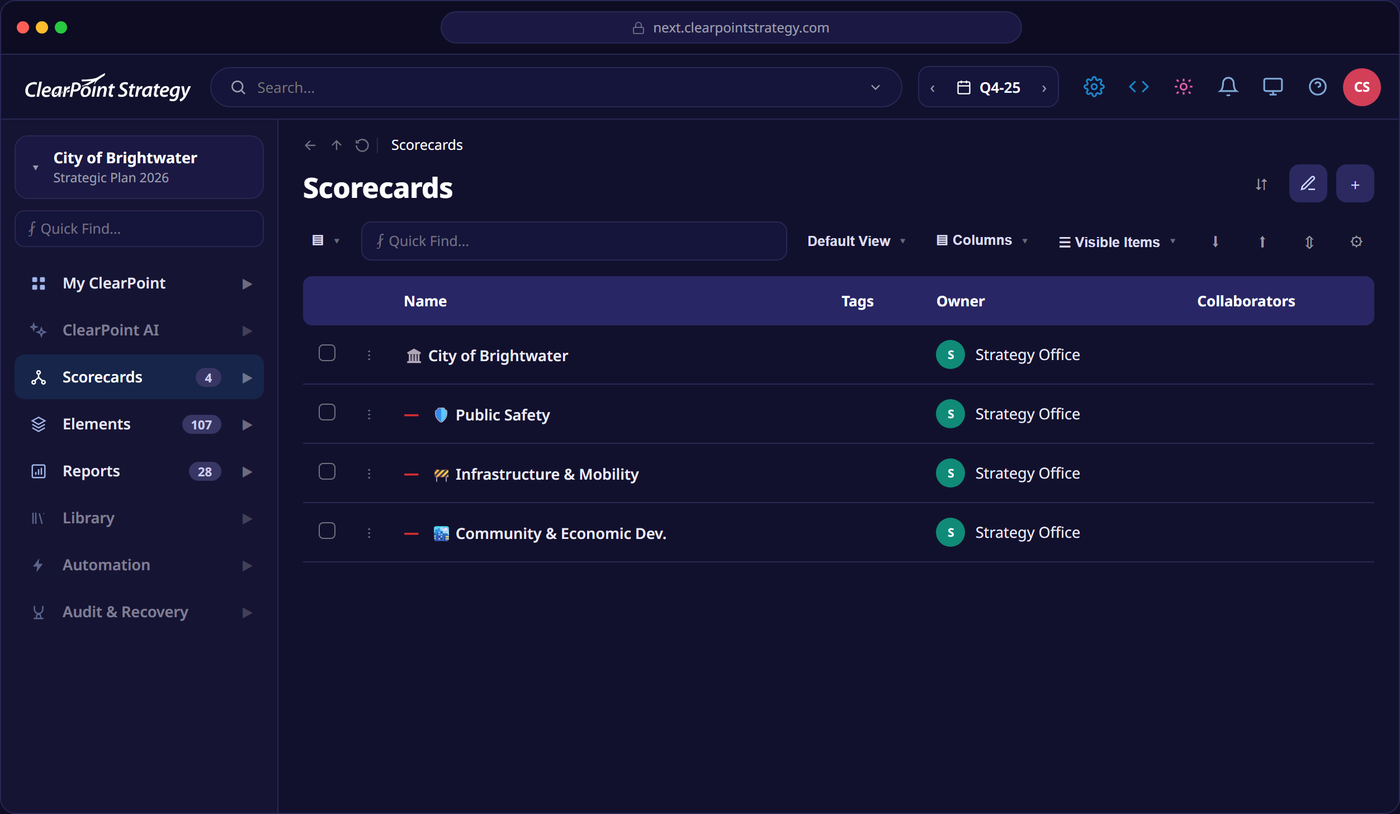
- A department measure linked to a citywide objective, with the rollup recalculating live
- A strategy map built from your actual plan, not a sample
- A change in one plan cascading to the plans that depend on it
5. Project and milestone tracking at municipal scale
City strategy runs on projects, and the tracking has to hold at volume. The median city or county on our platform tracks 148 active projects across those 20 plans — more than 57,000 live municipal projects sit on our platform today.
Scale is where follow-through breaks. In our eight-year research set of local-government plans, 17.9% of projects were ever marked complete, and 67.5% sat past due without being closed. A list of projects in a spreadsheet cannot surface that drift. The feature that can: milestone-level statuses, past-due flags that escalate on their own, and views that work for both a project manager and a council presentation — Gantt for the manager, rollup for the dais.
In the demo, ask for:
- Past-due projects flagging and escalating on their own — nobody running a filter by hand
- The same project data as a Gantt for the manager and a one-page rollup for the dais
- Milestone statuses holding up at your real volume — the median city tracks 148 active projects
For the project-level deep dive, see our guide to project tracking software for local government.
6. Automated data collection and integrations
Manual data entry is the quiet killer of adoption. Numbers should flow from the systems that produce them — ERP, permitting, 311, GIS — into the plan on a schedule, with a human reviewing rather than retyping.
Read the critical reviews of any vendor in this category on G2 or Capterra and integration gaps top the complaint list. Our data shows why the stakes run past convenience. Across the 153 cities and counties running an established scorecard, the ones holding fewer than three measures per objective actively score 57.1% of those measures. The ones carrying twelve or more score 8.8%. Same software, same reporting obligations, a 6.5× difference in whether anyone evaluates the numbers at all.
ClearPoint platform data
Leaner scorecards get scored 6.5× more often
Median share of measures actively scored, by scorecard density
Under 3 measures per objective
12 or more measures per objective
Source: ClearPoint platform · 153 U.S. cities and counties with at least 20 measures and 3 objectives · August 2026
Automation and restraint work together. The integration keeps the data fresh; the lean scorecard keeps the humans willing. A platform that makes it effortless to add a thousand measures, and equally effortless to ignore them, has sold you the wrong kind of easy.
GFOA’s guidance on government software selection makes the same point from the procurement side: define the functional requirements — which systems must feed the platform, on what schedule — before the RFP goes out, and evaluate vendors against those requirements rather than demo charisma. If you’re writing that document now, start with our RFP guide for strategic planning software.
In the demo, ask for:
- A live scheduled feed from your ERP, permitting, 311, or GIS system — not a CSV upload
- What happens when the source system revises a number after the report already went out
- A human reviewing the data on arrival, not retyping it
7. Procurement-ready security and records compliance
The security review is where city software purchases stall, so treat security posture as a feature and evaluate it like one.
Start by clearing up the acronym that derails procurement conversations: FedRAMP authorizes cloud services for federal agencies — it does not govern city purchases. The program built for state and local procurement is GovRAMP (StateRAMP until its February 2025 rebrand): a nonprofit, NIST 800-53-based verification ladder running from a 40-control Security Snapshot to a 300+-control Authorized status, with more than 1,200 member organizations.
In July 2026 we read the published security documentation of all five major vendors in this category, ours included. None currently publishes a GovRAMP verification. That makes your practical baseline a SOC 2 Type II attestation — and it matters whether the vendor holds that attestation itself or inherits it from its hosting provider. The five security pages differ far more than the five marketing pages do. Ask directly.
Records compliance belongs in the same review. Public records laws reach your strategy data, so the update trails from feature #3 double as your records-request answer.
In the demo, ask for:
- The vendor’s own SOC 2 Type II report — held by the vendor, not inherited from its hosting provider
- A straight answer on GovRAMP: current status, and the roadmap if there isn’t one
- An update-history export that would answer a public records request as-is
Which government strategy software has these features?
Five platforms dominate city evaluations: ClearPoint Strategy, Envisio, AchieveIt, OpenGov, and Cascade. The matrix below reflects vendor-published documentation as of July 2026 — capabilities change, so verify in the demo. This is a capability-presence read rather than a scored ranking; for the scored ranking, see our top strategic planning software for cities comparison.
| Feature | ClearPoint | Envisio | AchieveIt | OpenGov | Cascade |
|---|---|---|---|---|---|
| Council report automation | Yes — scheduled reports plus a managed-reporting service | Yes — tailored council reports, automated delivery | Yes — scheduled dashboards, update history for council inquiries | Yes — Budget Book and no-code Publications | Partial — leadership reports, nothing council-specific |
| Public dashboards (ADA-ready) | Yes — live city dashboards (Bartlett, Germantown) | Yes — community dashboards with a WCAG 2.1 AA claim | Yes — embeddable widgets, public showcase | Yes — open data portal and transparency suite | Not published |
| Accountability workflows | Yes — owners, reminders, full update history | Yes — owners and timelines | Yes — automated update collection | Partial — within budgeting and planning | Yes — automated update requests |
| Cross-plan alignment | Yes — strategy maps, linked elements | Yes — multi-plan management | Yes — connected plans, multi-plan views | Partial — budget-to-goal mapping | Yes — cascading plans, corporate focus |
| Project & milestone tracking | Yes — milestones, statuses, rollups | Yes — tasks, projects, Gantt | Yes — timeline views, capital-project use case | Partial — through budgeting and CIP | Yes |
| Automated data collection | Yes — API and scheduled data loads | Yes — Open API; Tyler, Questica, Polco | API-based (CSV/JSON) | Suite-native within the OpenGov cloud | Broad, via Zapier |
| Security & records compliance | SOC 2 Type II (vendor-held), ISO 27001-aligned, TLS 1.3 | Hosting-inherited certifications | SOC 2 Type II plus FedRAMP ATO (Low) | SOC 2 Type II, NIST-aligned, FedRAMP-authorized infrastructure | SOC 2 and ISO 27001 via partners |
Scroll the table horizontally to see all five vendors.
An honest read of the field. Envisio is a local-government specialist, and it shows: community dashboards with the only published WCAG 2.1 AA claim of the five, and integrations that name the government stack. AchieveIt pairs connected multi-plan tracking with support its Capterra reviewers score at 4.7 out of 5, and it is the only pure-play strategy vendor here with a FedRAMP Authority to Operate. OpenGov approaches strategy from the budget; a city that wants budgeting, performance, and transparency in one suite should shortlist it, knowing strategy features live inside the budgeting product. Cascade brings a broad AI feature set and a corporate center of gravity; it does not currently publish local-government-specific capabilities. ClearPoint was built around the reporting problem — scheduled council reports, accountability workflows, and a managed-reporting service where our team builds the packet with you. What the seven-feature checklist above can’t show: ClearPoint runs on whatever framework your city actually uses — Balanced Scorecard, OKRs, GASB reporting, or a custom hybrid — and lets you switch or mix without rebuilding the plan. Its AI reads your own portfolio data (trained across 31.2 million rows of real strategic-planning history) to flag goals headed off-track and recommend where to act, not just clean up your status-update prose. And it connects natively into the systems a city already runs — Power BI, Tableau, Snowflake, Tyler Munis, ArcGIS — instead of leaving that integration work to your IT team. Every account gets dedicated onboarding and ongoing strategic coaching from our team, not a support ticket queue. We’re a guided, premium platform; a city that wants the fastest self-serve setup may prefer a lighter tool, and a city that wants a partner in the room, not just software, is who we built this for. For the detailed side-by-side, see our comparison of ClearPoint vs. Envisio.
How should a city evaluate these features before buying?
Run demos as scenarios, and score against your own plan. Bring last month’s council packet, your project list, and one department’s measures, and make every vendor rebuild them live. A feature checklist tells you what exists; a scenario tells you what Tuesday looks like. We’ve published the deeper evaluation guides: how to choose a government strategy platform for the criteria, and how to justify the software to your council for the budget conversation that follows.
Frequently asked questions
What is government strategy software?
Government strategy software is a platform where a city manages its strategic plan: goals, measures, projects, owners, statuses, and the reports that flow to council and residents. It is a different category from urban-planning and GIS design tools (which model the physical city) and from employee-performance HR software (which manages staff reviews) — a distinction worth knowing, because search results mix all three.
Do small cities need all seven features?
A city under 50,000 should weight features 1, 3, and 6 — report automation, accountability workflows, and automated data collection — because they replace staff time the city doesn’t have. Public dashboards follow when capacity allows, and the ADA deadline for smaller entities (April 26, 2028) leaves room to sequence it deliberately.
Does a city need FedRAMP-authorized strategy software?
No. FedRAMP governs cloud purchases by federal agencies. For cities, the relevant frameworks are a vendor-held SOC 2 Type II attestation and, increasingly, GovRAMP (formerly StateRAMP), the NIST-based program built for state and local procurement. If a vendor cites FedRAMP, ask whether the authorization is its own or inherited from its hosting infrastructure — the two are different claims.
What are the accessibility requirements for public dashboards?
The DOJ’s ADA Title II web rule requires WCAG 2.1 Level AA for state and local government web content — public dashboards included. Following the April 2026 extension, cities of 50,000 or more must comply by April 26, 2027; smaller cities and special districts by April 26, 2028.
How many measures should a city track per objective?
Fewer than most cities start with. In our August 2026 platform data, the 153 cities and counties running an established scorecard show a median of 3.6 measures per objective — and the ones staying under three actively score 57.1% of their measures, against 8.8% for those carrying twelve or more. Density is the enemy of follow-through, and it is far easier to fix during implementation than after.
Where does AI fit in government strategy software?
Treat AI as an accelerator for feature #1: drafting report narratives, summarizing status updates, flagging anomalies. Adopt it with governance in front — an ICMA survey found only 9% of local governments have an organization-wide AI policy — and ask every vendor whether your data trains external models. The honest ones answer in one sentence.
The feature list is a promise about Tuesday
A city’s strategic plan makes promises in public. The software either keeps them or it doesn’t. The packet builds itself. The dashboard answers a resident before the phone rings. The owner gets the nudge before the meeting, and the council sees the same numbers the departments do. Choose these seven features and the plan stops being a PDF on a shared drive. It becomes the way the city runs.
See it on your plan
We’ll rebuild your council packet, live, in the demo
Bring last month’s packet. Watch these seven features handle it — not a canned example.
Book a Free DemoOr start with our guide to the features you need in a reporting tool.