Operational metrics measure how well your business runs day to day. This guide gives examples by type and explains how to choose, measure and maintain the right ones.
- Tie each operational metric to a business goal before you track it: churn and customer lifetime value for retention, average order value for revenue.
- Confirm you can collect reliable data for a metric before adopting it, because inaccurate data leads to bad decisions.
- Give each metric a SMART target so the data has a benchmark to read against.
- Revisit the list as the business changes and drop metrics that no longer lead to action.
- Pick candidates from the 70 KPI examples by department.
Operational metrics are quantifiable measurements of how well your business performs its core functions day to day: how efficiently teams work, how quickly orders reach customers, how satisfied those customers are. Unlike vanity metrics, which look impressive but lack substance, they show specific strengths and weaknesses you can act on. This guide covers the main types, how to choose the ones worth tracking, and how to keep them accurate and current.
Types of operational metrics
Operational metrics fall into a few broad groups, and each industry weights them differently. A manufacturer might track production output and defect rates, a hospital patient wait times and readmission rates, and a retailer inventory turnover and sales per square foot. The table lists common examples by group.
| Group | Example metrics | What they show |
|---|---|---|
| Financial | Net profit margin, gross profit margin, operating cash flow, return on investment (ROI) | How well you manage resources and generate profit, and which projects return the most |
| Customer | Customer satisfaction (CSAT), retention rate, churn rate, customer acquisition cost, monthly recurring revenue (MRR) for subscription businesses | How customers see your products or services and whether they stay |
| Process | Order fulfillment time, inventory turnover rate, production cycle time, defect rate | How smoothly internal processes run and where waste builds up |
| Employee | Productivity (output per hour or units produced), employee turnover rate | Where training would help; high turnover can signal morale or management problems |
| Marketing and sales | Website conversion rate, sales conversion rate, average order value | Whether demand turns into revenue |
Why operational metrics matter
Metrics tell you where to focus. They can show that slow customer service response times are dragging down satisfaction, or that one product line is underperforming, and that points to a specific decision such as new training or a change in marketing. In a manufacturing plant, production cycle time and defect rate reveal which steps to improve to raise output and reduce waste.
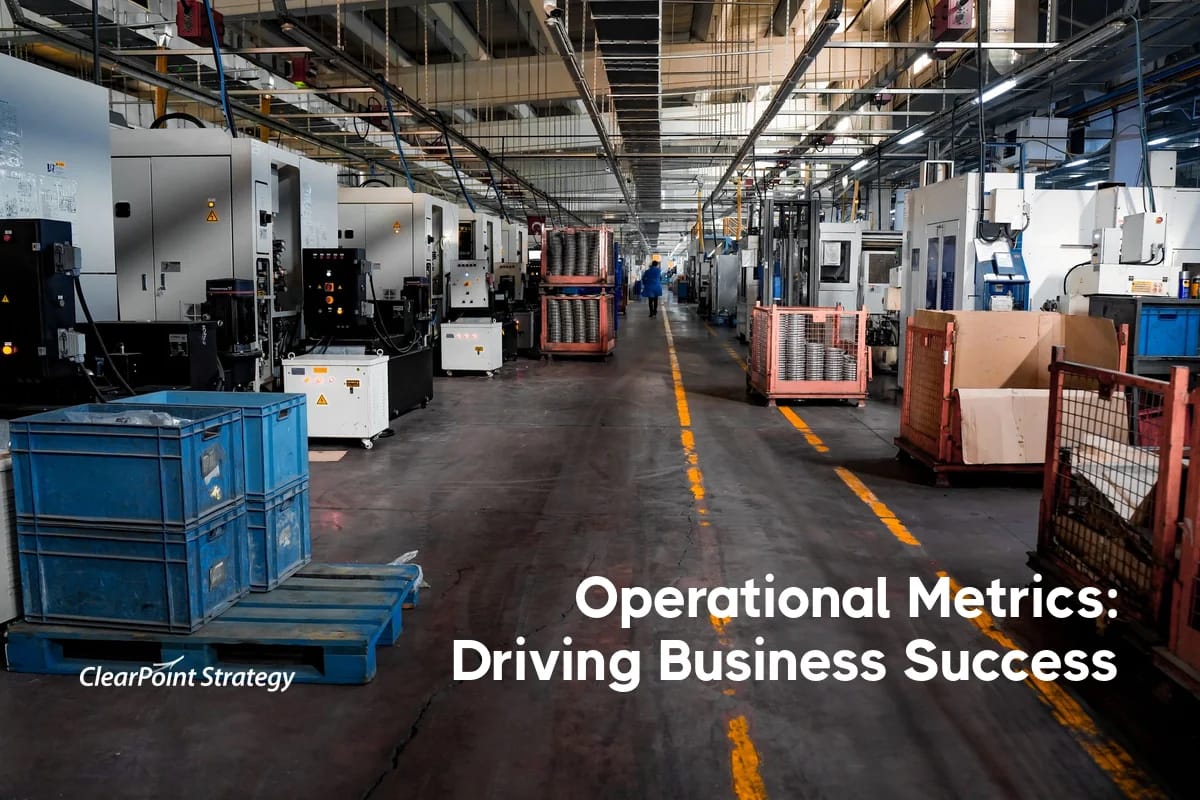
ELDOR Automotive Powertrain, which makes ignition coils, showed how this worked on a plant floor. Its Assembly and Plastics departments tracked quality, production efficiency, logistics, EHS, labor time and overtime, and scrap rate. Operational departments reported weekly and overall strategy reports monthly. Jacob King, Organization and Development Supervisor, explained why speed mattered: in the automotive industry, a company can lose “a million dollars a day of downtime.”
Collecting those numbers used to be its own cost. ELDOR built reports from a mix of PowerPoint and Excel, and a time study found it was spending $120,000 per year in labor time on reporting. With ClearPoint automation, ELDOR spent only $15,000 - $20,000 per year, and it could put the savings back into the line.
They also connect strategy to daily work. If your goal is to increase market share, tracking customer acquisition cost and conversion rate shows whether day-to-day activity is moving you toward it. For the goal-setting side of this, see our guide to operational goals.
How to choose the right operational metrics
A short list of metrics tied to your goals, suited to your industry, and fed by reliable data will tell you more than a long one.
Tie each metric to a business goal
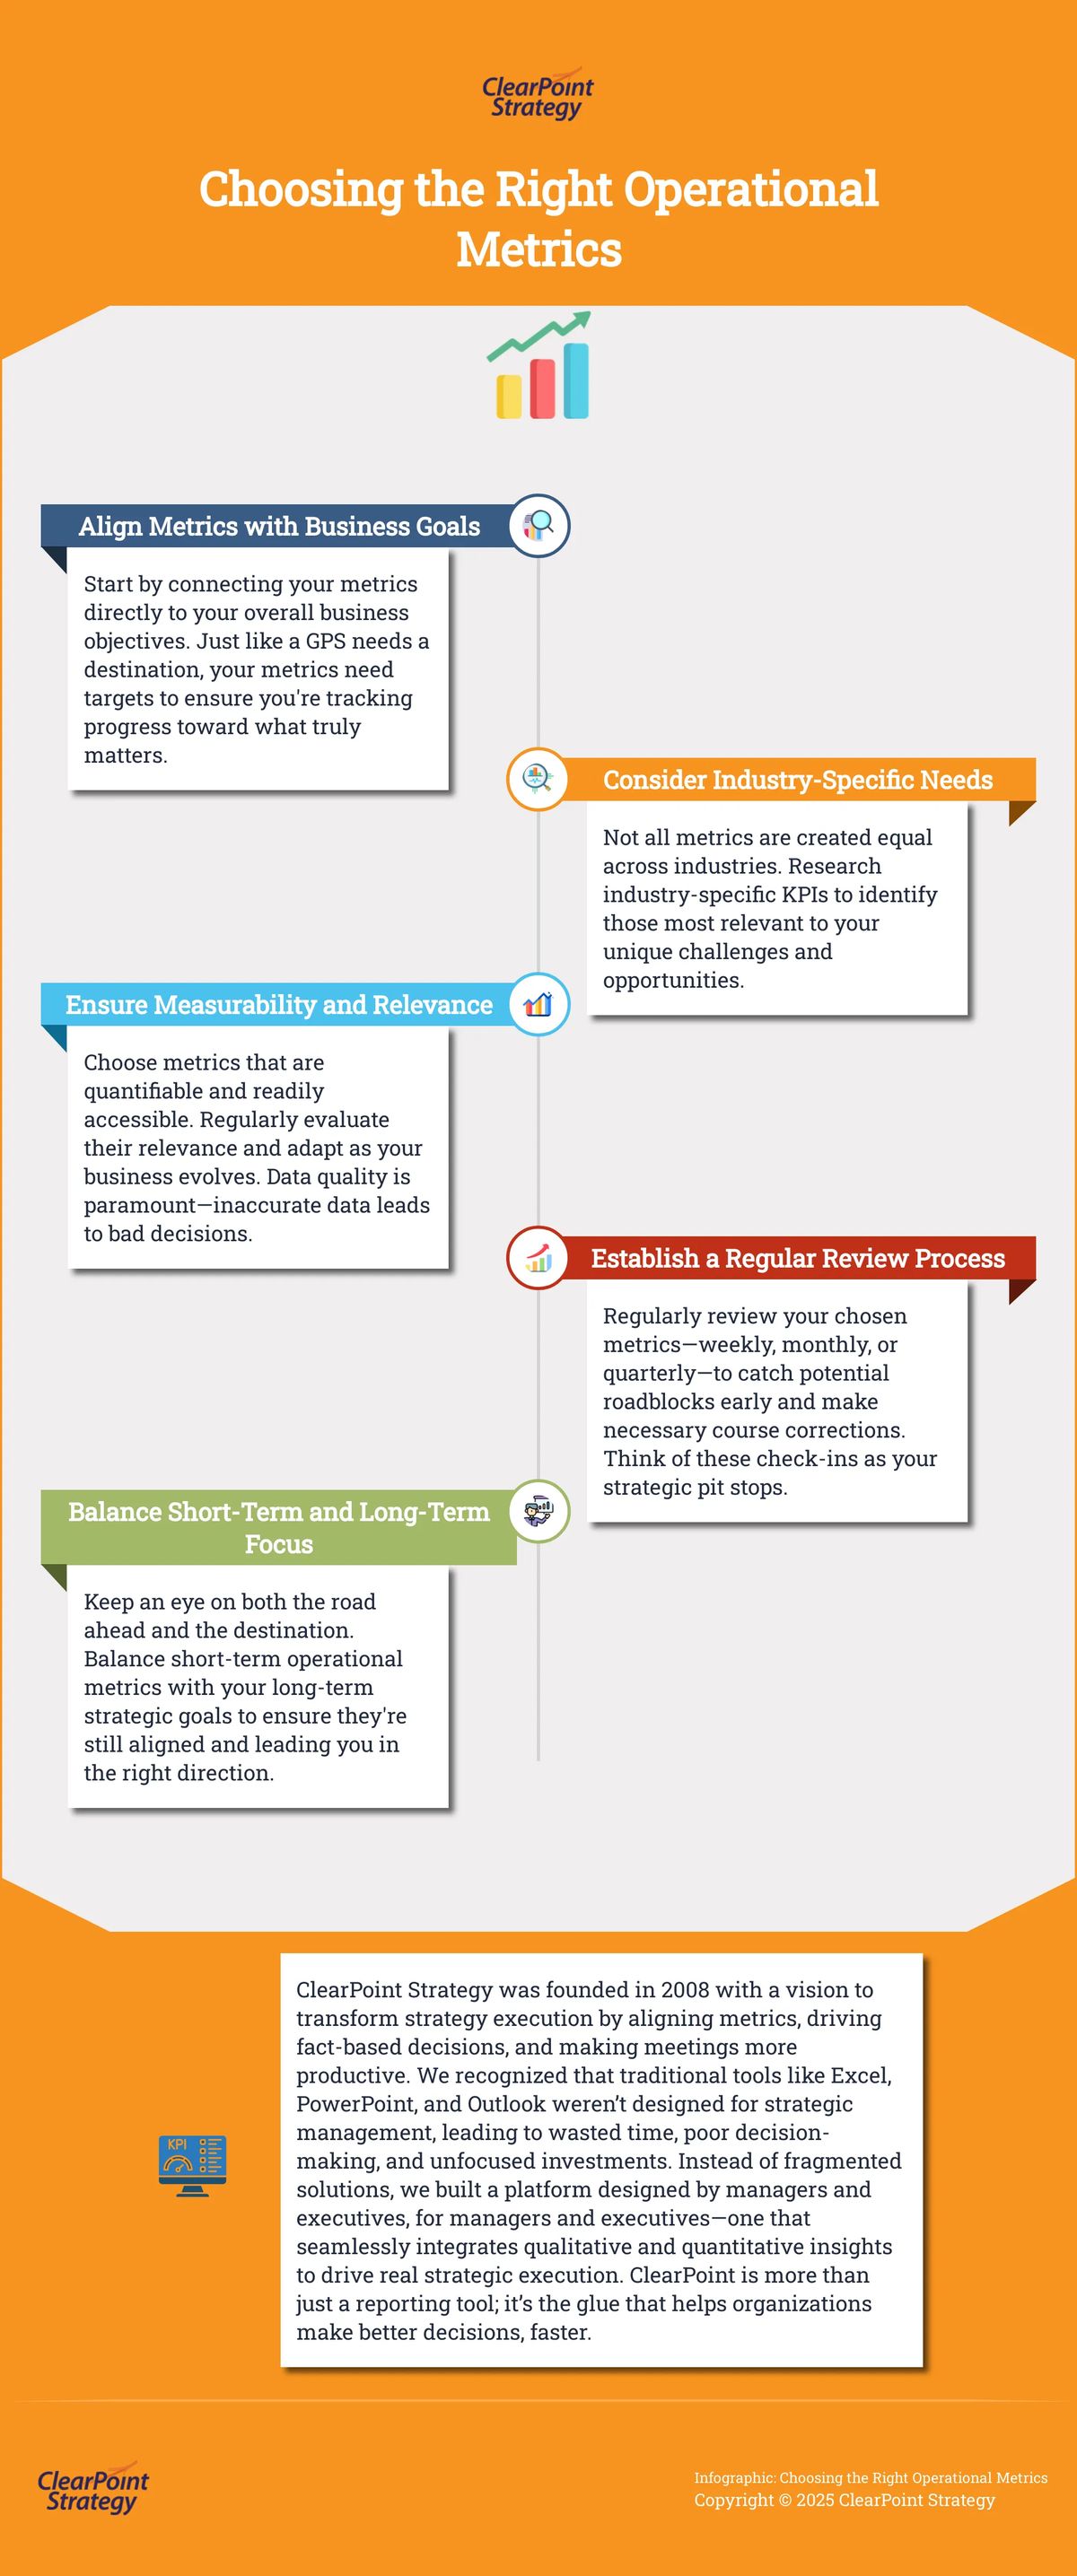
Start from the goal, then pick the measure. If the goal is customer retention, track churn rate and customer lifetime value. If it is revenue growth, track average order value and sales conversion rate. A metric that does not connect to a goal is a candidate to drop.
Connecting operational data to the objectives it supports in a strategy execution platform such as ClearPoint lets you see how operational performance affects strategic objectives, and keeps everyone working from the same information. For candidates to start from, see these 70 KPI examples by department.
ELDOR organized its metrics this way. Its plant scorecard held finance and culture data and then branched into individual departments, each with its own scorecard. That structure kept each department’s operational plan aligned with the overall strategy, and monthly plant-wide reports went out to everyone so the plant could, in King’s words, “move together as one.”
Fit the metrics to your industry
What matters to a software company may be irrelevant to a manufacturer. Industry-specific KPIs are a useful starting point, but the final list should reflect your own challenges and opportunities rather than a generic template.
Confirm you can measure it reliably
Before adopting a metric, check that the data exists, that you can collect it without excessive effort, and that it is accurate. Inaccurate or incomplete data skews a metric and leads to bad decisions. Set clear data collection processes, validate your sources, and run regular quality checks for completeness, consistency, and accuracy.
Austin Resource Recovery (ARR), a City of Austin department serving more than 190,000 residential properties each week, fixed a different weak spot. Its old database made users export data, do calculations by hand and load the results back in, which took staff time and invited errors. It also had no way to lock previous reporting periods. In ClearPoint, staff entered raw data and the calculations ran automatically. Users could view everything but could only edit the measures they were required to update.
Set targets
A number means little without something to compare it against. Give each metric a SMART target (specific, measurable, achievable, relevant, and time-bound) so you can judge performance, see where you are ahead, and see where you need to change your approach.
Keep your metrics current
Metrics need revisiting as the business changes. What mattered last year may not matter today, so review the list against your current goals and drop or replace measures that no longer lead to action. Balance short-term operational metrics with long-term strategic goals, and keep the list short enough that people act on it instead of stalling under too much data. iSixSigma has more advice on avoiding common metrics problems.
Customers and investors increasingly look at sustainability and environmental, social, and governance (ESG) performance, and some of those measures belong in an operational set. Examples include carbon emissions, employee satisfaction, and ethical sourcing. The specific measure depends on the business: a clothing retailer might track the percentage of recycled materials in its products, while a tech company might measure energy consumption per server.
Common questions
What's the difference between operational metrics and strategic metrics?
Operational metrics focus on the day-to-day performance of your business, like how quickly you fulfill orders or how many calls your customer service team handles. Strategic metrics, on the other hand, track your progress toward larger, long-term goals, such as market share or revenue growth. Think of operational metrics as measuring the efficiency of your engine, while strategic metrics track the direction and speed of your entire vehicle.
How often should I review my operational metrics?
The ideal review frequency depends on your specific business and industry. Some metrics, like website traffic, might be checked daily, while others, like employee turnover, might be reviewed monthly or quarterly. The key is to establish a regular cadence that allows you to identify trends, spot potential problems, and make timely adjustments. It's about finding a rhythm that keeps you informed without overwhelming you with data.
What are some common mistakes to avoid when tracking operational metrics?
One common pitfall is tracking too many metrics without a clear purpose. This can lead to data overload and make it difficult to extract meaningful insights. Another mistake is failing to connect operational metrics to your overall business strategy. Your metrics should be aligned with your goals, providing a clear picture of how your day-to-day operations are contributing to your long-term success. Finally, neglecting data quality can undermine your entire metrics program. Inaccurate data leads to flawed conclusions and poor decisions.
What's the best way to get my team on board with using operational metrics?
People are more likely to embrace change when they understand the "why" behind it. Clearly communicate how tracking and analyzing operational metrics will benefit the team and the organization. Involve your team in the process of selecting metrics and setting targets. This fosters a sense of ownership and encourages active participation. Make the data accessible and easy to understand through dashboards and reports. When people see the value of the metrics, they're more likely to use them effectively.
How can technology help me manage operational metrics more effectively?
Technology can automate data collection, freeing up your team to focus on analysis and action. Real-time dashboards provide immediate insights into performance, allowing you to identify and address issues quickly. Strategy execution platforms, like ClearPoint, can integrate your operational data with your strategic goals, creating a powerful feedback loop that drives continuous improvement. AI and predictive analytics can even help you anticipate future trends and make proactive decisions.