ClearPoint helps local governments align departments, visualize connections and manage performance, with a case study from Arapahoe County, Colorado.
- Map how each department's work drives other departments' outcomes. Public safety can depend on police, fire, transportation and parks; without the map, departments drift into silos.
- Automate department data collection instead of chasing updates. Officials then spend their time analyzing data, and fewer entry errors reach the report.
- Link every project to a specific goal and indicator. That link makes each department accountable for results and shows which projects are stalling.
- Collect data for a purpose rather than in bulk. Arapahoe County first gathered as much data as possible; employees couldn't find it or see its relevance.
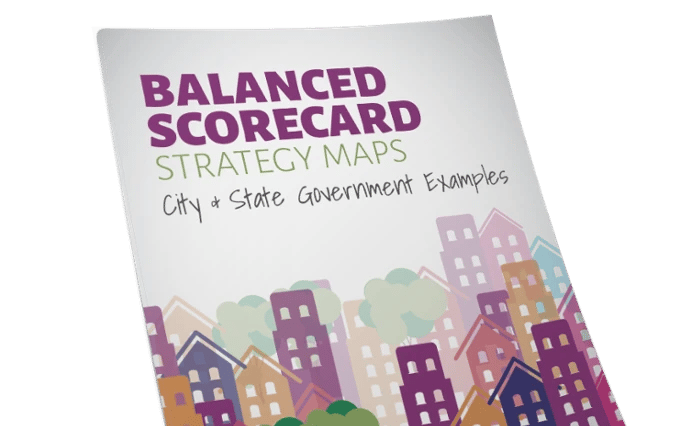
- Borrow a structure from the local government strategy map examples. Start your cause-and-effect map from a working city or state model.
The Importance of a Balanced Scorecard in Local Government
In local government, many departments must work together to reach community-wide goals. From public safety and transportation to parks and recreation, each department shapes the community’s future. The balanced scorecard aligns those departmental goals and turns high-level strategy into measurable outcomes. It shows how each department’s work fits the bigger picture, which builds the transparency and accountability that public trust depends on.
The Challenge: Connecting the Dots Across Departments
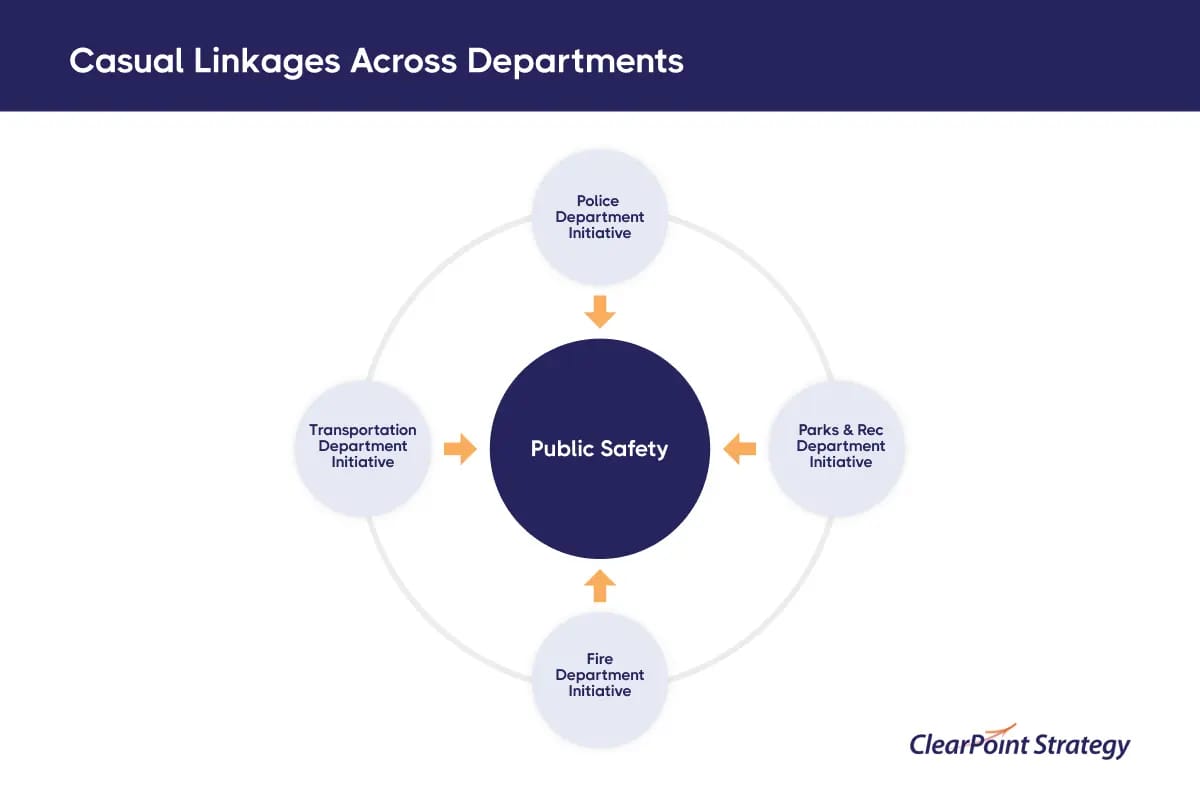
A common challenge in local governments is demonstrating how efforts in one department impact another. For instance, improving public safety might require initiatives from police and fire departments, transportation, parks, and recreation. Without a tool to map and visualize these causal linkages, departments work in silos and miss chances to collaborate and save effort.
How ClearPoint Strategy Helps Overcome These Challenges

ClearPoint Strategy was designed for these challenges. Its alignment and collaboration features, including strategy maps, automated data collection, and project management dashboards, make these invisible connections visible.
1. Strategy Maps and Alignment Matrices
Strategy maps and alignment matrices show local governments how departmental goals connect and influence one another. In a balanced scorecard, this matters for:
- Demonstrating Cause-and-Effect Relationships: These tools show how actions in one department (e.g., improving public infrastructure) contribute to broader objectives (e.g., reducing crime rates or improving public safety).
- Ensuring Cross-Departmental Alignment: Strategy maps show how each department's efforts line up with government goals, so every department works toward the same strategic outcomes.
- Avoiding Silos: When these linkages are mapped, departments see how their work fits the bigger picture. That encourages collaboration and prevents isolated efforts.
Seeing it laid out makes complex strategy easier to explain to stakeholders and keeps departments on the shared goals.
2. Automated Data Collection
Automated data collection is a necessity for effective local government performance management. No one has to chase updates and performance metrics from each department, and decision-makers always have current information. Key benefits include:
- Saving Time: ClearPoint pulls performance metrics and updates dashboards in real time, so government officials spend their time analyzing data instead of gathering it.
- Ensuring Data Accuracy: Automation reduces the risk of human error in data entry, leading to more accurate reporting.
- Enhances visibility & collaboration: ClearPoint updates data across departments automatically, so everyone sees the same real-time information. That transparency improves communication between departments and keeps everyone on the same page.
ClearPoint also helps local governments adjust strategy as things change. As new data comes in, you can update strategy maps in real time, so governments can pivot quickly. Local governments need that to manage complex, interconnected challenges.
3. Project Management Dashboards: Keeping Track of Progress and Accountability
ClearPoint brings data from multiple departments into a single dashboard. Project management dashboards give a full view of ongoing initiatives and help local governments manage complex projects across departments. Here’s how they help:
- Centralizing Information: Dashboards bring together project updates, timelines, milestones, and outcomes in a single source of truth for government officials.
- Tracking Performance: Governments can monitor key projects, see which are on track, and spot bottlenecks or delays that could affect strategic goals.
- Enhancing Accountability: The dashboard links projects to specific goals and performance indicators, so every department is accountable for results that serve the strategic objectives.
These dashboards help with day-to-day operations. They also keep projects on time and tied to strategic priorities, which a balanced scorecard framework requires.
Case Study: Arapahoe County, Colorado
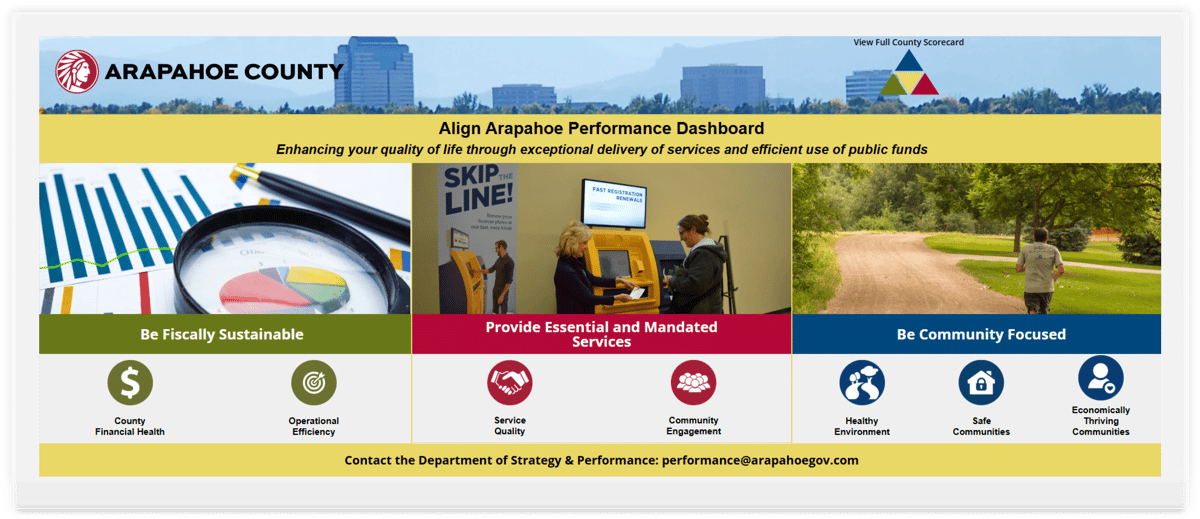
When Arapahoe County launched its Performance Management Program in 2016, the initial focus was on gathering as much data as possible. At the time, data was not being tracked on a large scale, and what little data was collected remained siloed and disconnected. Employees struggled to locate data and understand its relevance.
With ClearPoint, the county transformed its performance management by linking strategic objectives across multiple departments. It could see how work in areas like transportation and community services influenced public safety outcomes. As a result, Arapahoe County coordinated department efforts more effectively.
You can read more about Arapahoe County's success story with ClearPoint Strategy, which shows how the software helped the county achieve greater strategic alignment and accountability.
The Expertise Behind ClearPoint Strategy
ClearPoint stands apart because of the expertise behind it, particularly from its founders, Dylan Miyake and Ted Jackson. Both have extensive experience with the Balanced Scorecard methodology, which they have used to guide numerous organizations toward strategic success. Their journey began long before ClearPoint was founded, during their time working at Balanced Scorecard Collaborative, Inc. (BSC) with Drs. Robert Kaplan and David Norton, the creators of the Balanced Scorecard concept.
Dylan and Ted’s hands-on experience in developing and implementing balanced scorecards for various organizations has directly informed the design and functionality of ClearPoint Strategy. They understood that local governments needed more than a tracking tool. They needed a complete solution that connects strategy formulation to execution. That insight led to ClearPoint Strategy, software built for the needs of local governments.
Their work at BSC taught them how hard it is to align strategy across departments, and they applied that to ClearPoint’s features. These include mapping causal linkages, tracking performance metrics, and adjusting strategies on the fly. Local governments need these capabilities to reach community-wide goals.
Why Choose ClearPoint Strategy?
ClearPoint Strategy is built on decades of expertise in the Balanced Scorecard methodology. Local governments need to show how actions in one department affect the broader community. ClearPoint gives you the tools to manage balanced scorecards and to visualize and track causal linkages across departments. Your whole organization stays aligned on shared goals, and the community gets better outcomes.
Enhance strategic alignment and performance management, demo ClearPoint Strategy today.
Common questions