Simplify data sharing and amplify impact using public-facing dashboards within ClearPoint.
- Assign an owner to every measure before publishing. Initiatives with a named owner complete at 2.5× the rate (21.5% vs. 8.7%), and a public dashboard is only as credible as its measures.
- Build the dashboard inside ClearPoint, not a separate tool. Data already in your account publishes in one click, with a setup wizard and live previews.
- Schedule daily, weekly or monthly automatic refreshes. Republish manually for one-off changes so residents never see stale numbers.
- Brand the dashboard with your logos, colors and typefaces. HTML welcome text sets the tone on the first screen residents see.
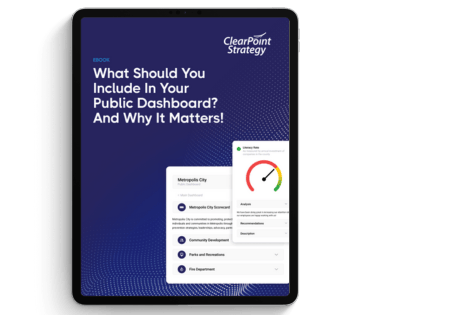
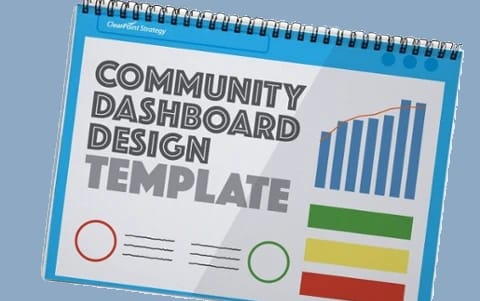
- Decide what to include with the free public dashboard eBook. Settle the contents before you design the layout.
Most public dashboards don’t lose trust because of how they look. They lose it because of what sits behind them. In ClearPoint platform data spanning 52,247 objectives across 324 organizations, the platform shows which strategic objectives still need an owner or a first assessment. Owned objectives are more likely to be on track (23.6% vs 10.6%). A public dashboard is only as credible as the measures feeding it. The first job is making sure someone owns each number and keeps it current.
That reframes the popular line that "most strategies fail." The data shows strategies succeed where ownership and follow-through are in place. A self-serve public dashboard covers the visible half. It puts current, owned performance data in front of residents and stakeholders, and that is what ClearPoint’s Public-Facing Dashboards are built to do.
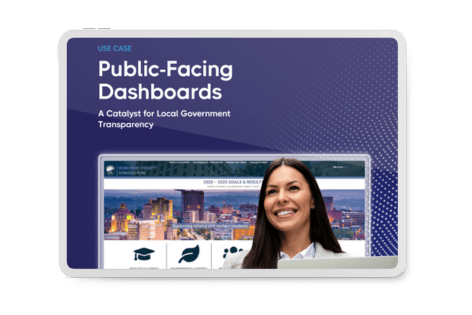
At ClearPoint Strategy, we want strategic data to reach public stakeholders as well as internal teams. So we built in-platform Public-Facing Dashboards. Organizations use them to create, publish, and share dashboards that match their strategic goals. A setup wizard and live previews are built into ClearPoint.
Why Public Dashboards Matter
Transparency is a cornerstone of effective governance and stakeholder trust. A city may share performance metrics with residents. A nonprofit may report progress to donors. ClearPoint’s dashboards let you present that information in a form people can read and use.
The City of West Palm Beach, Florida, shows what residents look for. When it introduced its Community Dashboard, West Palm Beach Working, in early 2018, residents could find up-to-date key city performance measures pulled in from ClearPoint. For each measure, citizens could see a description, an explanation of its performance, charts and the measure’s overall status. The data gave the public a snapshot of how the city measured up against the seven categories of its strategic plan.
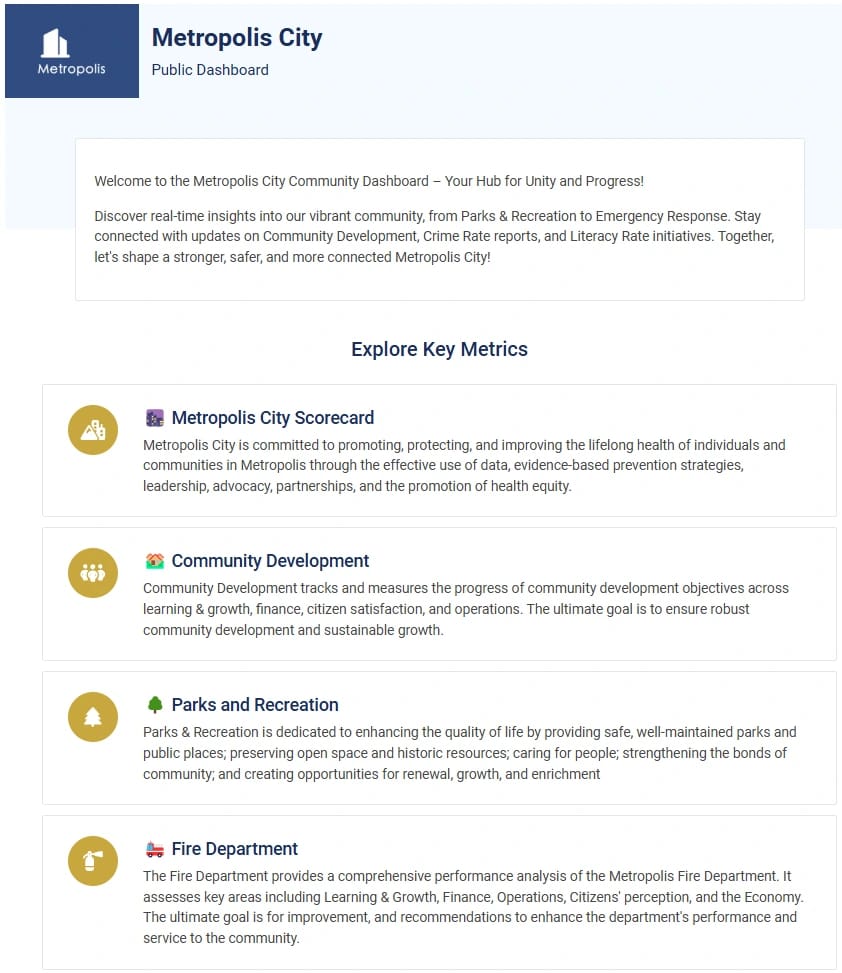
The City of St. Albert shows the same logic from the staff side. ClearPoint enabled the development of a public dashboard, which automatically updates data from the ClearPoint system. The transition to ClearPoint resulted in a dramatic decrease in the time taken for report creation – from an estimated 100 hours to just 25. Anita Johnson, Strategic Business Advisor, said: “ClearPoint has been a great tool to show where we are and where we are headed.”
ClearPoint Strategy’s Self-Serve Public Dashboards
Built Into Your ClearPoint Account
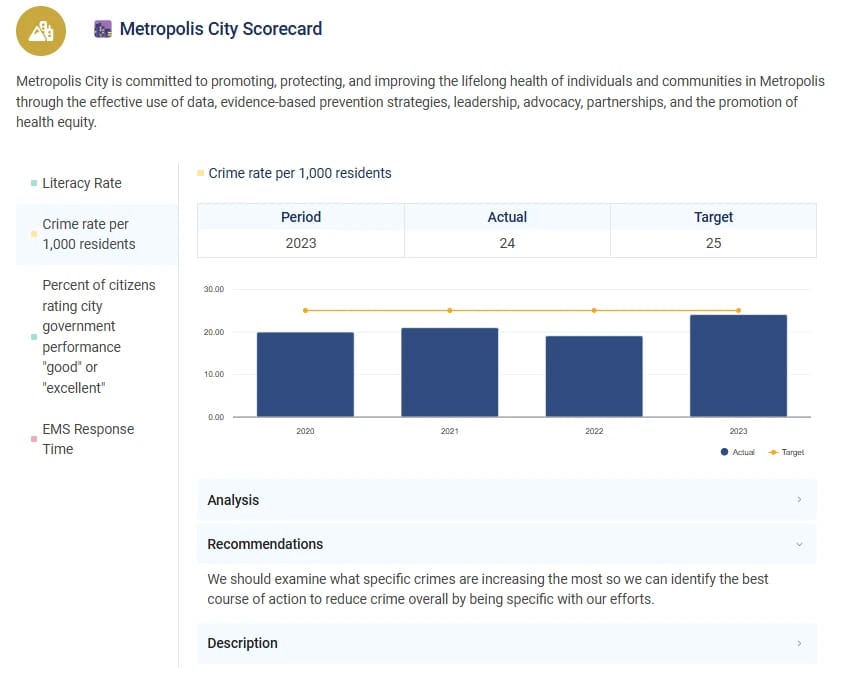
ClearPoint’s Public Dashboards are built into your ClearPoint Strategy account, alongside your strategic management tools. You can publish and share metrics directly and build charts that make complex data easy to understand. You publish it all with a single click.
Get the ebook on what to include in a public dashboard
Intuitive Setup and Maintenance
ClearPoint Dashboards come with simple tools for setup, design, and customization, for beginners and experienced users alike. Whether you start from scratch or refine an existing template, these features guide the process:
- Onboarding Wizard: First-time users get a guided setup.
- Real-Time Previews: See changes as you make them.
- Customization Options: Adjust logos, colors, typefaces, and more to fit your audience.
Comprehensive Management Tools
You can view publishing history and duplicate templates. Automated scheduling keeps dashboards current with daily, weekly, or monthly updates. For one-off changes, admins can publish or republish a dashboard by hand. Admins can also unpublish outdated dashboards or retrieve deleted templates.
Because the dashboard reads from the same account your team updates, there is no second copy to maintain. When Arapahoe County, Colorado, launched its public dashboard in 2018, the website pulled data directly from the county’s ClearPoint account. That kept updates quick for the county team and let the public easily view the measures behind Align Arapahoe, the county’s program for its goals of Service First, Fiscal Responsibility and Quality of Life.
Dashboard with Confidence
You can design ClearPoint's dashboards to match your organization’s mission and brand.
- Slick Design: HTML formatting options let you style the welcome text, so the first thing visitors see looks right.
- Optimized Branding: Tailor every element of your dashboard, from logos to color palettes, to match your organization’s identity.
- Streamlined Updates: Automated scheduling removes manual work, so your stakeholders always have the latest data.
Design gets people to look. Three habits from our public dashboard best practices keep them trusting what they see. Put a named owner on every measure, so the question “why did this move?” has somewhere to go. Set status by a rule calculated from the target and the actual, and publish the rule next to the color. And show a visible “Last updated” date on every measure, so residents can judge freshness for themselves.
ClearPoint: The Clear Choice for Public Dashboards
Public-Facing Dashboards tell the story of your data and simplify strategic reporting at the same time, whether you manage a city’s performance measures or report nonprofit achievements. With ClearPoint, public dashboards extend your strategic planning process. Custom designs, scheduled updates, and one platform for strategy and performance management make transparency easy for local governments to manage.
See what your city’s dashboard could look like.
See how ClearPoint automates your strategy reporting — book a demo
Common questions