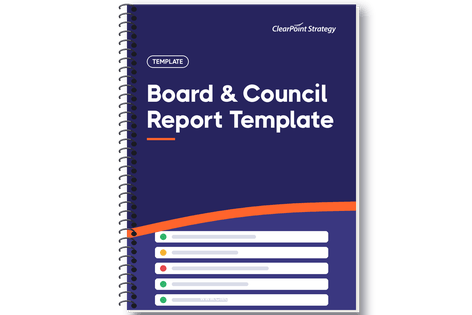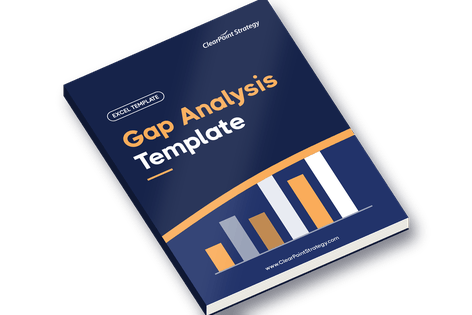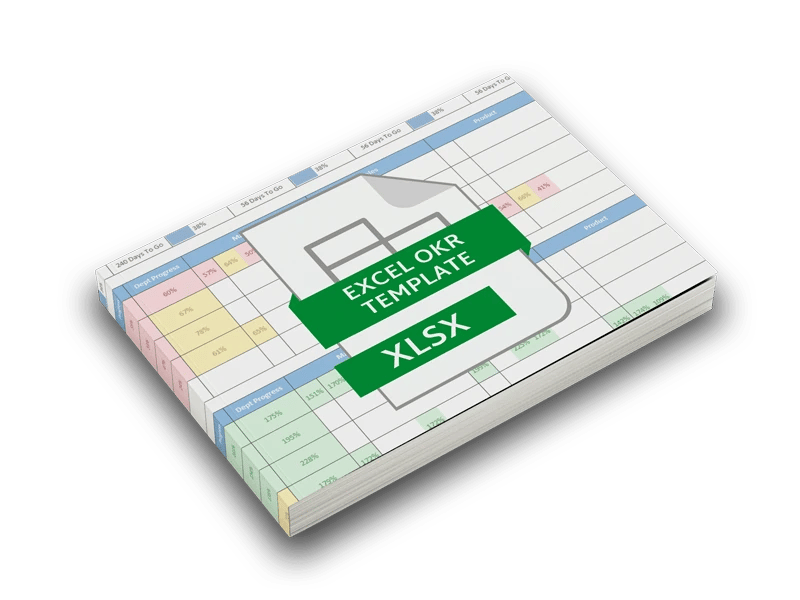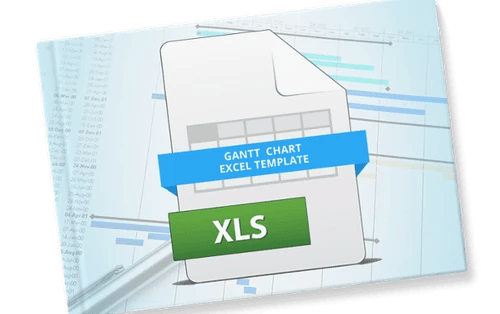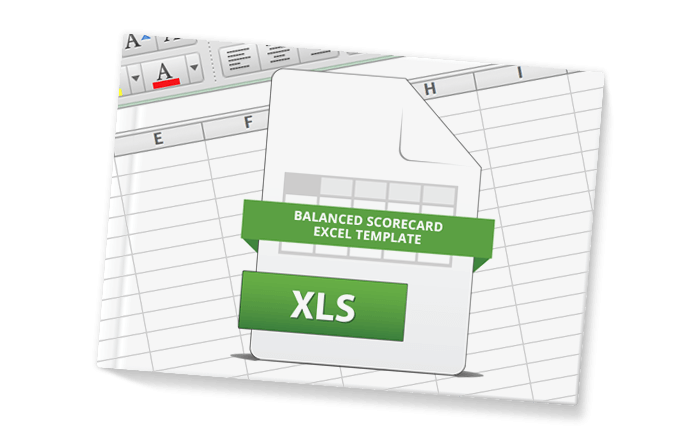
Use this template to create your Balanced Scorecard in Excel.
- Use a spreadsheet only for a small firm, a pilot or a transition. Excel scorecards break once many people edit them or the scorecard grows complex.
- Give the Excel scorecard a single author. Several people editing at once splits the team across different versions.
- Pick Excel for formula-heavy models and Google Sheets for simple shared lists. Excel has deeper functions and charts; Sheets autosaves and keeps every editor's version history.
- Scrap measures that have no data source when you move off Excel. Velosio replaced them with better choices and built its ClearPoint scorecards in three days.
- Start with the free balanced scorecard builder. It runs in the browser with no account; email is needed only to export.
Creating a Balanced Scorecard (BSC) is one of the best strategic moves an organization of any size can make. If you’re beginning to look into scorecarding for your organization, you’re likely toying around with building a balanced scorecard in Excel. Many companies take that approach when they are just getting started with a BSC.
That said, Excel isn’t always the best choice. Below, we’ll identify the scenarios in which spreadsheet management works well enough, and point out some other options for when it’s time to upgrade.
Prefer to build it instead of downloading a file? Use the free balanced scorecard builder. It works in the browser with no account, and asks for an email only if you want to export.
Building A Balanced Scorecard In Excel Or Google Sheets
There are three types of companies that can benefit from using a spreadsheet to create and manage their Balanced Scorecard:
- Very small firms. While this definition varies, we’re talking specifically about organizations who net less than a million dollars a year. If this is true of your organization, Excel is a good place to be.
- Pilot projects. If you are looking to show a “proof of concept,” or demonstrate that the Balanced Scorecard is still relevant and can benefit your organization, Excel is the best place to start.
- Companies that are transitioning. If your business is transitioning from one system to the next, or if you’re just getting your scorecard up and running and have a lot of changes to make, an Excel Balanced Scorecard may be the ticket.
Excel is often praised as a cost-saving option. But there are a few hidden costs associated with Excel reporting to keep in mind before creating your scorecard.
Excel scorecards can work in those three situations, but creating a Balanced Scorecard in Excel can go wrong when a lot of people get involved or the scorecard becomes complex. Keep a single author so your team stays on the same version of the scorecard. If many people make changes at the same time, you can end up with a costly nightmare.

Excel vs. Google Sheets
Excel is the most popular spreadsheet tool, but many organizations also use Google Sheets to manage their spreadsheets and information. If you've decided a spreadsheet and presentation tool is the best route for you, here's some background to help you choose between Excel and Google Sheets.
Excel
The following benefits are unique to Excel:
- Established 21 years before Google Sheets, Excel has had years to perfect its software and build in powerful tools.
- Excel offers advanced functionality for complex model-building and data manipulation.
- Excel has more keyboard shortcuts than Google Sheets, which helps users save time when they create, inspect, and debug formulas.
- Excel is powerful and can process tens of thousands of lines of data.
- Excel processes data quickly, which leads many users to choose it.
- There are more data visualization options offered by Excel than Google Sheets. Newer versions of Excel can create and format a wide range of charts, which is useful for reporting presentations.
The primary downfall of Excel is the lack of version control. You have to save all new versions, and when you send out the document for collaboration or editing, you have to cross your fingers and hope you have the most updated XLS scorecard file. You’ve probably been in a situation where you rush to send out, say, “Revenue-By-City-V4.xlsx” right before a meeting. An hour later it dawns on you that the most current version, also named “Revenue-By-City-V4.xlsx,” is sitting on your desktop.
Other issues you’ll likely encounter with using Excel:
- It’s difficult to maintain historical data. Using multiple sheets or rows that coordinate with different time frames will quickly become a challenge to manage, not to mention the difficulties you’ll have comparing all that data for analysis.
- You have to manually create a system for evaluating and tracking your objectives, measures, and initiatives. That requires writing formulas to evaluate certain data cells.
- It’s complex to create a reporting workflow across multiple levels of the organization. Excel is ideal for single-person use, but collecting and consolidating data from across a large organization into a spreadsheet is anything but a smooth process.
For more on the time-sucking or dangerous repercussions of using Excel, check out this infographic.

Before you decide on Excel...
Ask yourself this: Am I using this spreadsheet for a complicated, formula-heavy model that would benefit from a great deal of advanced functionality? If so, Excel is probably a better option than Google Sheets.
Google Sheets
The following benefits are unique to Google Sheets:
- Simple sharing is a huge benefit to Google Sheets. If you are sending out your spreadsheet to anyone within your organization, Google Sheets’ “Share” feature is easy to find and automatically sends a notice to the email you’ve shared it with.
- Collaboration is simple in Google Sheets. As the author of a spreadsheet, you can decide how much access everyone has (i.e. whether they can just view or edit), and collaborate in real-time with your team.
- Cloud storage is nice. You can access your sheets from anywhere without downloading a program.
- Google Sheets autosaves every change you make, so you never have to worry about losing new data if your computer crashes.
- Version control isn’t an issue for Google Sheets. Every change from every editor is saved, and if need be, you can revert to a previous version of the document.
The primary downfall of Google Sheets is that it has less advanced functionality than Excel. Google Sheets also can’t handle near the amount of data that Excel can (and will slow to a crawl if you try). Its charting and graphing options are more limited than Excel’s, which can make visual presenting harder.
Before you decide on Google Sheets...
Ask yourself this: Am I going to use my spreadsheets to organize and maintain a simple data list, which will be edited and shared with many people? If the answer is yes, Google Sheets is likely a better choice than Excel.
Alternatives To Excel For Balanced Scorecard Creation & Management
You have two options besides Excel for creating a Balanced Scorecard: build your own software or scorecarding solution, or purchase it. Each has benefits and drawbacks.
Build Your Own Scorecarding Software
If you’re considering building a scorecarding solution, you need to examine:
- Whether you have the adequate support to maintain the software.
- If you have the time and resources to build out the necessary features.
- If you’re accounting for all the expenses that building your own solution can incur.
- If your team can handle the implementation and upkeep process.
- What your “exit strategy” is if things don’t work out as planned.
(This in-depth article answers each of these questions: Should You Build Or Buy Management Reporting Software?)
Before you decide to build your own scorecarding solution... Ask yourself this: “Will I spend more time creating the software than I save using the software?” If the answer is yes, your best bet is to purchase scorecarding software.
Purchase Scorecard Software
Purchasing software that can provide a positive ROI is a must, and a great return on investment is attainable. There are also certain things you should demand from your reporting software vendor, like excellent support and great customer service. Software helps organizations that are more mature in their management processes.
There’s no shortage of software platforms available that can help you manage your scorecard. Many products are quite good, but check the reviews on G2, Capterra, and other software review sites to get a sense of each software product’s strengths and weaknesses. Here are some issues to be aware of as you shop around:
- Reporting functionality is essential. The way you organize your KPIs, objectives, and initiatives is unique to your organization, and different audiences need different reports. The solution you choose should have flexible, customizable reporting options.
- Report visuals matter. Visually appealing reports stand out as being distinctive and professional. Make sure the software has a range of dashboards and charts to choose from and allows you to add branding and colors.
- The more integrations the better. To make data-gathering as simple as possible, the software you choose should integrate directly with the other business-critical tools you use every day.
- Ease of use is key. A tool with a steep learning curve deters new users. They won’t want to learn it and will be even less willing to use it often.

A Case Study: Graduating From Excel To ClearPoint Strategy Reporting Software
Many of our customers came to us after having used Excel as a starting point for their Balanced Scorecard management. As their organizations grew in size, spreadsheets became a less viable option for all the reasons we’ve listed above.
ClearPoint supports the Balanced Scorecard’s structure while staying flexible and simple, so larger organizations can focus on strategy without all the complications of Excel. One such organization was Velosio (formerly known as SBS Group), a longtime BSC user and ClearPoint customer that began its strategic planning efforts with spreadsheets.

A leading technology and software solutions provider, Velosio saw steady growth in the early 2000s. That prompted an expansion, transforming it from a single business unit into a multiple-unit company. It also had a unique three-tiered business model: a direct-to-end user business, a master reseller business, and a wholesale division. While the spreadsheets had worked passably with just one business unit and a handful of users, they were no longer a feasible solution for aligning four business units, four scorecards, and multiple users in a quarterly management process.
Before ClearPoint, Velosio tested several software solutions, none of which delivered everything the company wanted: a system through which it could construct a strategic plan, manage initiatives and measures, cascade them to the field level, and integrate with the existing accounting system. Cross-scorecard collaboration and transparency also mattered. Velosio wanted everyone to see where the company was headed and understand the reasoning behind big decisions.
ClearPoint could support all their needs. Once Velosio decided to switch, it built and populated its scorecards in ClearPoint in just three days.
The Result: A New Way Of Thinking
Implementing ClearPoint eliminated all the data-gathering and reporting snafus associated with managing a Balanced Scorecard in Excel. It also made it easy to link initiatives and their component activities at the employee level. Some teams even began exploring the use of ClearPoint to manage smaller projects or construct team-specific scorecards.
ClearPoint also gave leaders a chance to reevaluate how they approach their strategy. Being able to see the links between initiatives and individual activities allowed them to more easily assess and prioritize their portfolio of projects. Setting up their scorecards in ClearPoint also prompted leaders to rethink their measures. Those with no data sources were scrapped and replaced with more appropriate choices.
Velosio continued to use ClearPoint to manage its Balanced Scorecard and follow through on its ambitious plans for continued growth.
Getting Started With The Balanced Scorecard
Before you decide where to manage your scorecard, understand the processes you’ll need to go through as an organization to create one.
If you want to learn more about what a good Balanced Scorecard should look like, take a look at this exhaustive Balanced Scorecard example. It’ll walk you through definitions for scorecarding shop talk and explain exactly how you can read a completed scorecard.
Common questions
How do we stop several people from overwriting the Excel scorecard?
Name one author who owns the master file and makes every edit. Owners send their updates to that person through a form, a shared input sheet or email, and the author enters them on a fixed date. If many people must edit directly, Google Sheets with version history is safer than emailing Excel files.
How should we lay out a balanced scorecard workbook?
Keep data and reporting apart. Use one data tab with a row per measure per period, holding actual, target, owner and objective. Build the scorecard tab from it with lookups and a status formula that compares actual to target. Add a period selector instead of copying sheets, so history stays in one place.
When should we move the scorecard out of a spreadsheet?
When several business units, linked scorecards or a regular cascade depend on it. Spreadsheets work for small firms, pilots and transitions, but break down once many contributors, version control and historical comparisons are involved. Velosio made the switch when it grew from one business unit to several running a quarterly management process.
What should we test when comparing scorecard software?
Test it with your own scorecard, not the vendor’s demo data. Check that reports can be tailored to different audiences, dashboards and charts look professional, data can flow in from your existing systems, and occasional users can update a measure without training. Read reviews on G2 and Capterra before shortlisting.