Disconnected tools make every reporting cycle a scramble. Here is how ClearPoint customers link strategy, projects, data and reporting in one platform.
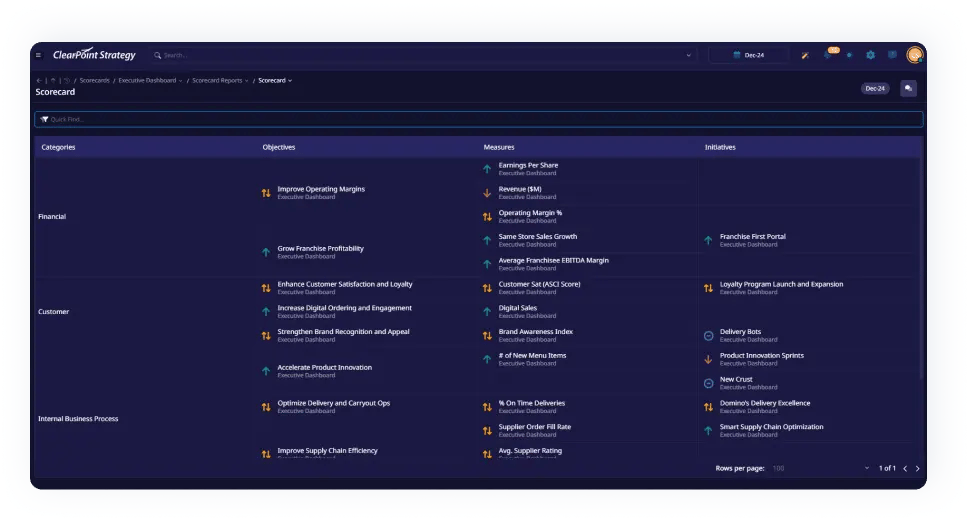
- Link objectives, measures, projects and risks in one scorecard structure so goals connect to the tasks beneath them and status evaluates automatically.
- Pull data in from where it already lives with Data Loader, the API, Zapier and Microsoft Teams.
- Let dashboards and briefing books update themselves instead of rebuilding reports each cycle.
- Use workspaces, @mentions, alerts and approval workflows so updates stay visible and who changed what, and why, is on record.
- See more time-saving automation tools.
Organizations that deliver on their strategy tend to connect it to day-to-day execution instead of treating it as a side project. When KPIs live in one tool, projects in another and status updates in email, every reporting cycle turns into a scramble to reconcile them. ClearPoint keeps strategy, projects, data and reporting in one integrated platform, so teams work from the same picture.

Link scorecards, measures, projects and risks
Scorecards organize the whole strategy, from big-picture goals down to individual tasks. Objectives, measures, projects and risks link to one another, and custom calculations and status indicators evaluate performance automatically instead of by gut feel. Milestones, action items and dependencies show who is doing what, and when. For a full worked example, see the complete guide to balanced scorecards.
The City of Dublin, Ohio, shows why the links matter. Before ClearPoint, departments used their own PowerPoint presentations for data analysis, which led to unclear reporting and varying interpretations of the data. ClearPoint gave Dublin a consistent reporting structure, so everyone had the same frame of reference and leadership could trust the data as a source of truth. Its charts also let the team drill down to specific measures and explore connections between goals, initiatives and performance measures.
Bring data in from other systems
With data automation, customers pull updates from where the data already lives, such as Excel, Asana or Google Analytics, rather than retyping it. The main options are:
- Data Loader watches folders and imports updates on a schedule.
- The API and webhooks support custom integrations with BI tools or in-house systems.
- Zapier connects ClearPoint to thousands of apps, including Slack and Salesforce.
- Microsoft Teams lets people get notifications and update items without leaving the chat.
Carilion Clinic, a not-for-profit healthcare organization in Roanoke, Virginia, moved to ClearPoint from a clunky system that made data loading and interpretation difficult, with frequent errors that limited confidence in its measurements. ClearPoint now uses API integration to pull data automatically from Carilion’s internal applications. Advanced calculations roll up to different measures, and reports are generated and distributed automatically to 1,000 providers.
More ideas are in this list of time-saving automation tools.
Report without rebuilding every cycle
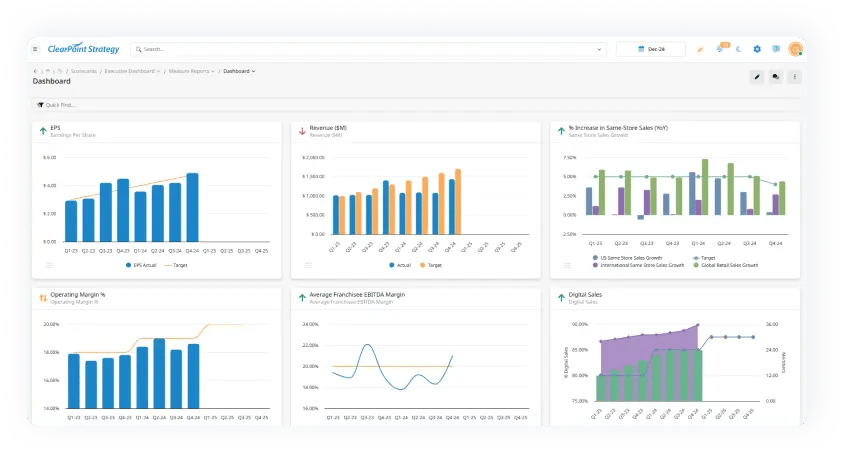
Dashboards and reports update themselves, so nobody spends hours rebuilding them each cycle. Customers build summary reports and dashboard reports with drag and drop, and assemble briefing books. Bar, line, pie and Gantt charts can be embedded in reports, websites or presentations, and reports export to PDF, Excel or PowerPoint.
For the American Association of Critical-Care Nurses (AACN), the Board Report used to be pieced together in Excel from each department’s contributions. That was extremely time consuming and limited AACN’s ability to think and act strategically. With ClearPoint, Tracey Birosak, Business Strategy Specialist, no longer needed to work with individual departments to consolidate the information by hand. ClearPoint allowed her to trim a week-long process down to a 10-minute report click, and enterprise-wide reports then went directly to the Board.
Collaborate where the work happens
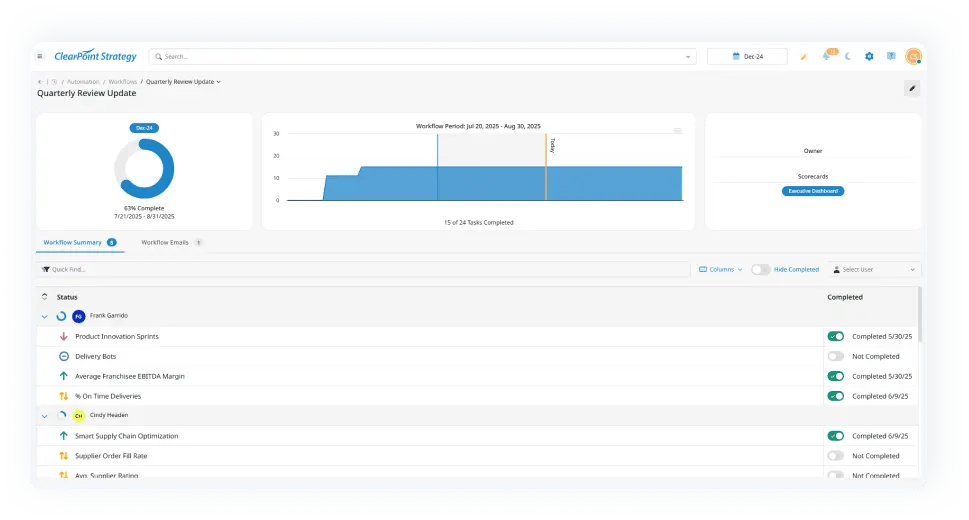
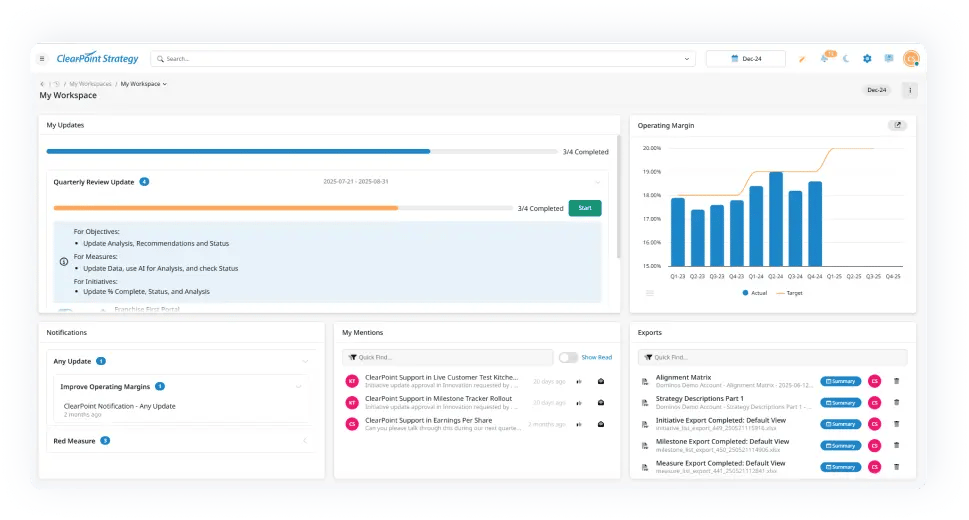
ClearPoint keeps people informed and ready to collaborate without filling their inboxes. Each user gets a personal workspace as their own dashboard. Comments, discussions and @mentions sit next to the items they concern, and the alerts inbox and My Notifications collect what needs attention. Approval workflows record who updated an item and why.
Use AI for analysis and summaries
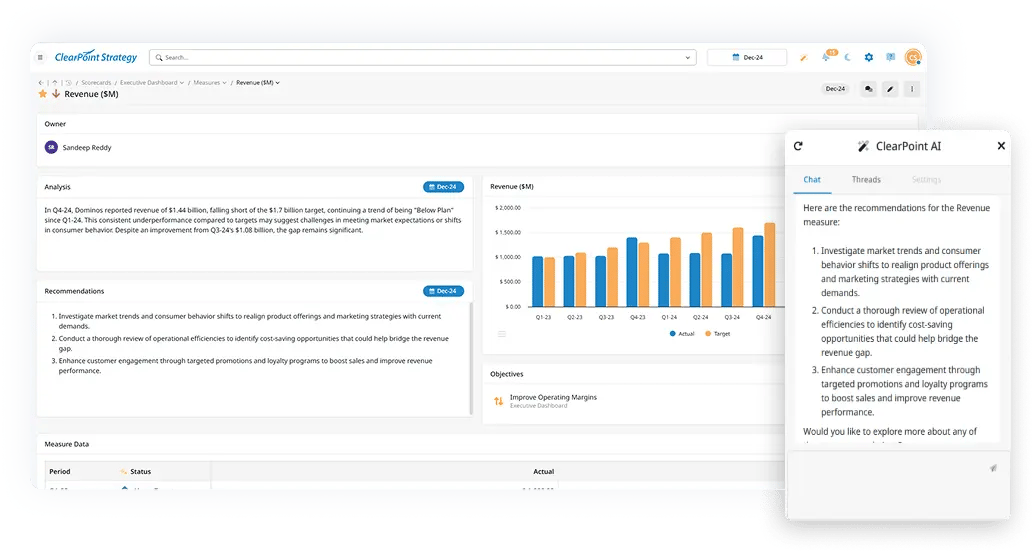
ClearPoint's AI features help customers connect strategy to day-to-day work with analysis, recommendations and executive summaries. The linked post describes what is currently available.
Administer it at scale
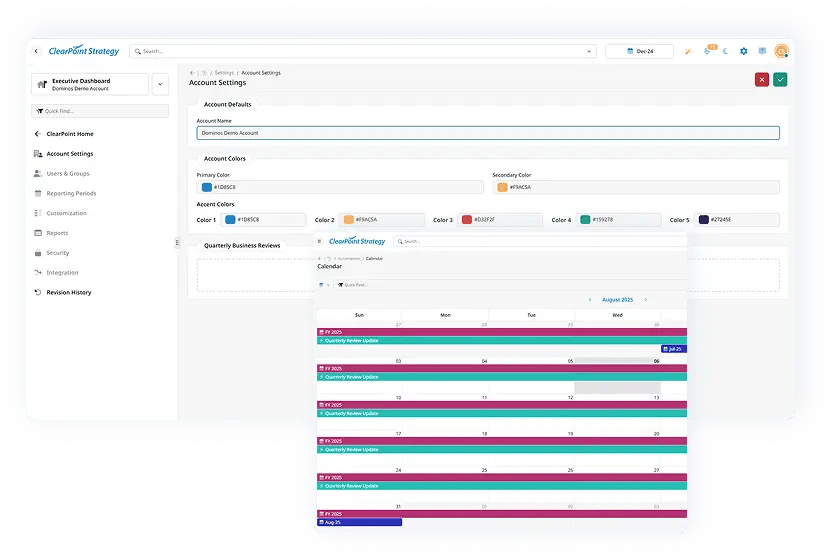
Administrators control the setup and the accountability around it. They tailor menus, fields, layouts and branding to the organization, and manage users with SSO and two-factor authentication. Bulk changes and calculated fields handle large edits and advanced logic, while usage reports and tags track activity and keep items organized.
Scale is where this pays off. Carilion manages approximately 300 scorecards in four categories: a clinic scorecard for the whole system, department scorecards, section scorecards for teams such as Internal Medicine or Dermatology, and individual provider scorecards. Each year, a seven-month process with department Chairs and Section Chiefs defines the measures and cascades them from system-wide goals down to individual providers.
Common questions