Four data visualization features—modern charts, Kanban boards, Explorer View, and version history—that bring strategy to life.
- Chart targets against actuals in Dashboard View. It puts every KPI's trendline and target on one page, so leadership meetings spot patterns quickly.
- Move projects and KPIs across a Kanban board. Columns show what is on track, blocked or due this week, and update in real time.
- Map your strategy in Explorer View to find unlinked initiatives. Tree and network views expose silos and any initiative not connected to a larger goal.
- Check Version History before questioning a number. It shows previous values, who changed them and when, down to the reporting period.
- Browse the full list of 12 favorite features. Pick the next view to adopt once these four are part of your reviews.
When you manage strategy software, you think a lot about clarity. That covers design, and also how teams see their goals, track performance, and make decisions. Good data visualization makes reports look nicer, and it also makes strategy execution faster, smarter, and more collaborative.
Here are four features I return to again and again, because they help our users do exactly that.
1. Modernized Charts That Actually Tell a Story
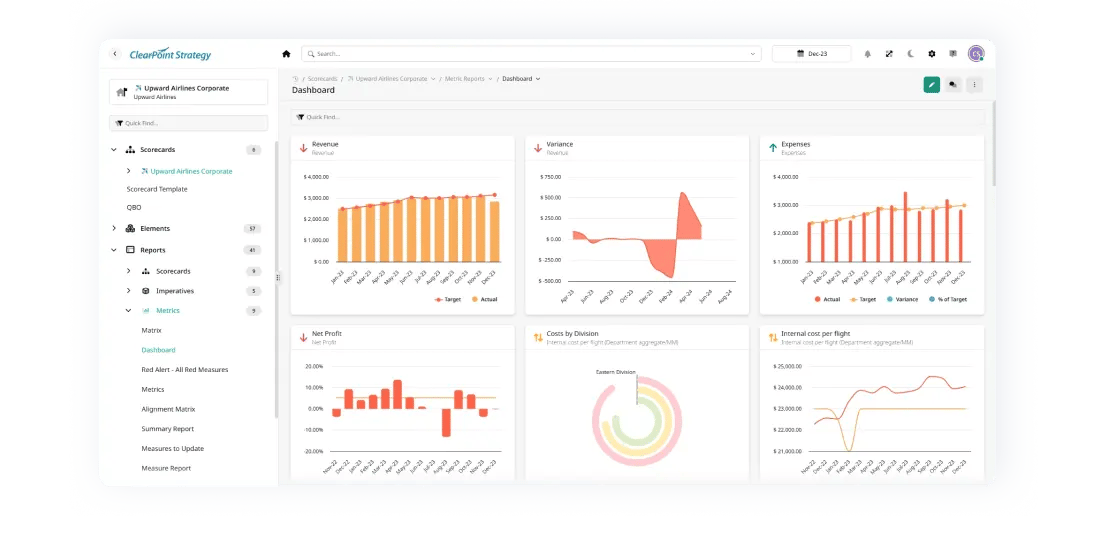
Data should do more than sit on a page as numbers. It should communicate. That’s why we gave our chart suite a serious upgrade. The latest ClearPoint charts are built to stand out in executive reports and boardroom decks: sharp visuals, clean labels, and improved contrast that makes trends easy to spot at a glance.
From bar and column charts to radial gauges and combo views, we’ve made it easier to show targets versus actuals, track performance over time, and present a clear picture without needing a data analyst on standby. It’s professional, polished, and presentation-ready by default.
Building charts by hand is expensive. ELDOR Automotive Powertrain, a maker of ignition coils, used to collect its data and make it presentable with a cumbersome mix of PowerPoint and Excel. A time study that interviewed people in each department found the company was spending $120,000 per year in labor time on reporting. With automated reporting in ClearPoint, ELDOR saved over 80% of that cost and then spent only $15,000 - $20,000 per year, money it could reinvest on the production line.
Our Dashboard View shows all the charts tied to a specific element type in one layout: all your KPIs in one place, with trendlines, targets, and insights. It’s good for spotting patterns and starting conversations in leadership meetings.
2. Kanban View: Turning Strategy into Action
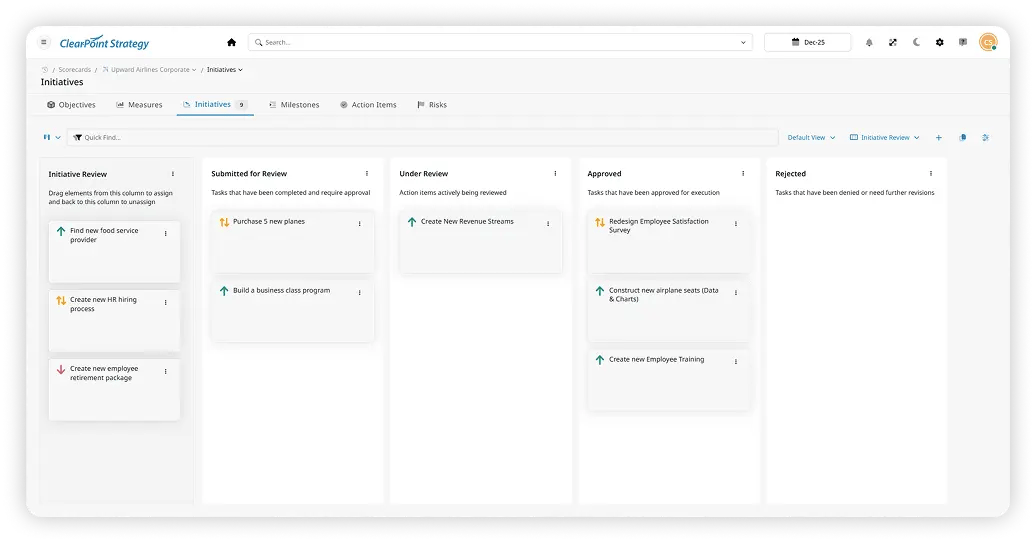
There’s a big difference between tracking a project and moving it forward. The Kanban Board view bridges that gap by turning strategic elements into an interactive workflow.
In ClearPoint, your projects, KPIs, or tasks now live in customizable columns you can drag and drop. You can see what’s on track, what’s blocked, and what needs attention this week. The board updates in real time and connects to the rest of your reports and detail pages. It’s the kind of visual format that gets teams out of spreadsheets and into action.
A board works best as the focal point of the meeting itself. Our guide to running strategy meetings with Kanban boards suggests giving each card a detailed description, an assigned team member and a deadline. In the meeting, discuss the cards in critical stages or at risk of delay, and adjust the board as decisions are made. Update it during or after each meeting, so it stays a reliable source of information on project status.
3. Explorer View: Making Strategy Visual (and Clickable)
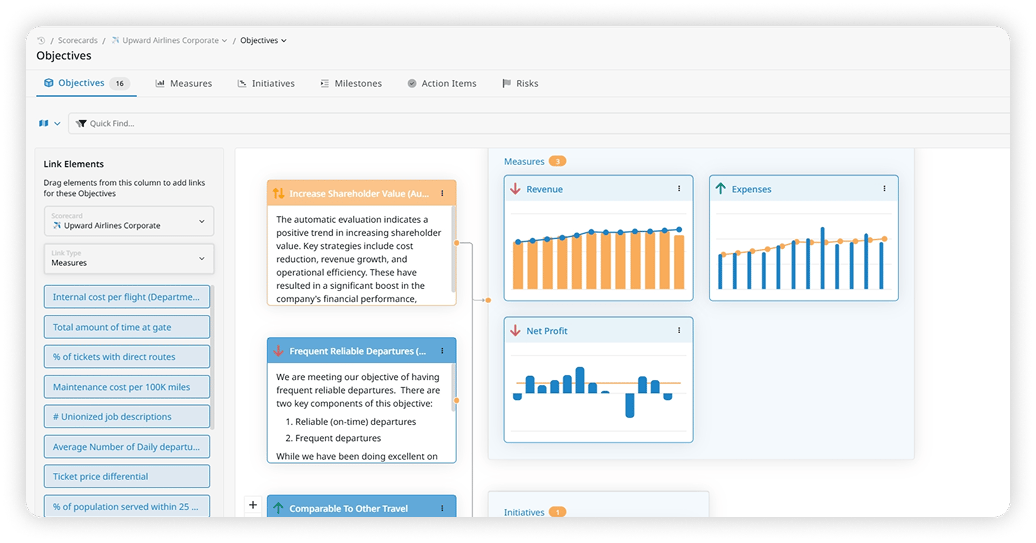
Strategic plans get complex quickly: goals link to measures, projects tie to initiatives, and dependencies cross departments. Explorer View helps you make sense of it all.
It’s a visual map of your strategy. You can toggle between a tree structure and a network-style link map that shows how your elements connect across your scorecard. To change how things are linked, drag and drop. To dig deeper into performance, click any item and see its full detail.
This view helps leaders understand alignment, find silos, and check that every initiative connects to a larger goal.
The City of Dublin, Ohio, used ClearPoint’s charts and visualizations this way. They let Dublin’s team dive deeper into data, drill down to specific measures and explore connections between goals, initiatives and performance measures. The city says that led to more meaningful conversations and better, data-driven decisions. Dublin also aims to connect ClearPoint with systems such as GIS mapping software for a fuller view of the city’s performance.
4. Version History: Because Context Is Everything
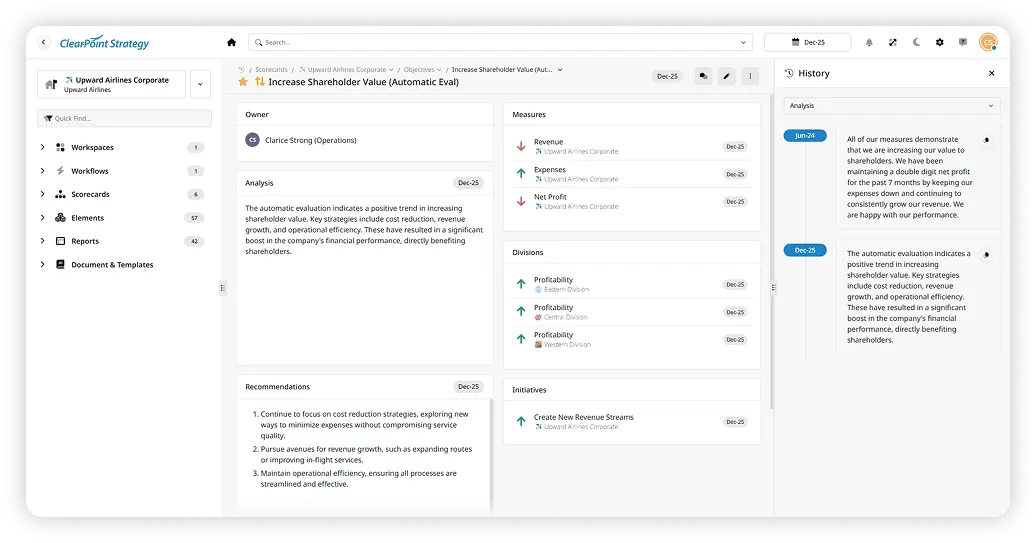
Strategic data changes often, and knowing how and why it changed matters just as much. Version History covers that.
Now, any update field in ClearPoint includes a detailed timeline of changes. You can see previous values, who made the change, and when it happened, down to the reporting period. It’s essential for teams that care about auditability, transparency, and consistency.
Auditability is one of the data quality metrics worth tracking. The test is simple: can you drill down into your data and see a history of updates? You can measure it as the percentage of fields where you cannot tell what was edited, when, and by whom. Version History answers that question for every update field.
The Power of Seeing Clearly
If you live and breathe strategy at your organization, you want it to be a good place to live. ClearPoint’s visualization features do more than improve the look of things. They make strategic work clearer, more connected, and easier to act on. When you report to a city council, manage cross-departmental projects, or try to spot performance issues early, these views make it easier to do your job well.
Common questions