Elevate your healthcare management with these 30 KPIs. Start tracking today to improve patient care, operational efficiency, and financial health!
The healthcare industry in the U.S. and abroad has undergone major policy and business model changes over the past decade. These changes have spurred healthcare companies to look into new healthcare metrics—or key performance indicators (KPIs)—to decide if they are meeting these new standards.
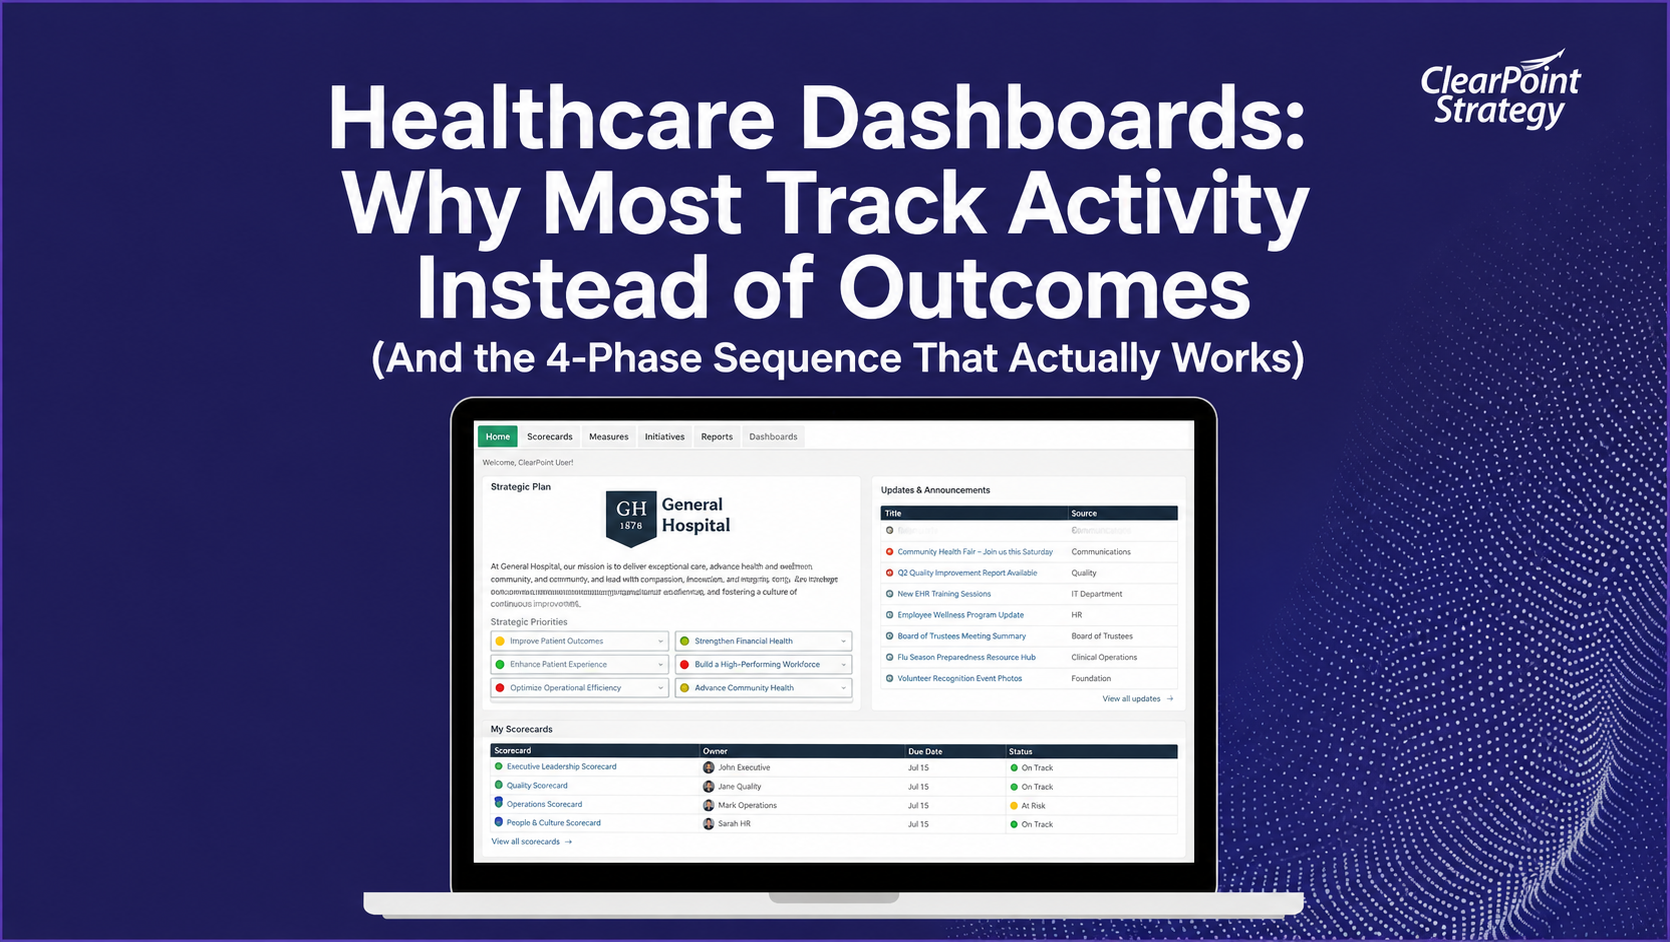
Introducing ClearPoint Strategy, a powerful tool designed to help healthcare organizations navigate this complex landscape. With ClearPoint Strategy, you can seamlessly define, measure, and achieve your strategic goals using the right KPIs.
See ClearPoint Strategy in action! Click here to watch a quick DEMO on the software
As a quick refresher, a KPI is a type of performance measurement that helps you understand how your organization or department is performing. A good healthcare KPI should be well defined, quantifiable, thoroughly communicated, and crucial to achieving your strategic goals.
If your organization is looking to track progress on these changes, or looking for ways to improve as an organization, you need to use the right key performance indicators (KPIs). Below, we’ve outlined 30 KPIs you may be interested in trying. They're separated into several categories. Make sure you pick a few from each so you have a well balanced list of KPIs.
30 Healthcare Metrics & KPIs
To help determine which of the below KPIs might be most relevant for you, consider the strategic goals of your organization. While healthcare facilities benefit from tracking information around patient stays and experiences, each organization should also have specific goals it is trying to reach, perhaps related to solving a particular problem, achieving a special distinction, serving a certain demographic, etc.
Having the right KPIs in place will ensure you stay on track to achieve those objectives over the long term.
Operations
- Patient Wait Time: Calculates the average amount of time a patient must wait between checking in and seeing a provider. This can help with staffing and scheduling and provide insight into patient satisfaction.
- Average Number Of Patient Rooms In Use At One Time: Shows how well space is used to treat patients and helps determine if more or less space is needed in the facility. Think about this as an occupancy rate, like at a hotel.
- Staff-To-Patient Ratio: Indicates the use and capacity of staff resources, which can affect the quality of patient care.
- Bed Or Room Turnover: Demonstrates how fast patients are moving in and out of the facility. This affects the efficiency of the facility and should be considered when looking at patient satisfaction. You might want to consider tying this one closely with readmittance rates to make sure that you are not letting people leave the facility who are not well.
- Communication Between Primary Care Physician, Proceduralist, & Patient: Determines how frequently various parties are in communication with one another, increasing the quality of care for the patient. This is sometimes measured by satisfaction, and sometimes measured by the number of documented communication activities.
Here are a few ideas for improving your competitive advantage for your healthcare organization by making changes to your operations (and then of course selecting the right KPIs to track your progress).
KPI Focus: Improving Efficiency
Seemingly “invisible” processes sometimes fall victim to inefficiencies. Facilities looking to make improvements in this area benefit from monetary savings, as well as higher staff and patient satisfaction levels. Some KPIs to consider in this area are:
- Patient Appointments Per Day
- Patient Wait Time
- Cost To Collect
Finance
- Average Insurance Claim Processing Time & Cost: Averages the amount of time and money an organization spends processing insurance claims. When low, it indicates that the facility receives payment faster and there is less cost to the patient.
- Claims Denial Rate: Provides insight into the effectiveness of the organization's revenue cycle. A low claims denial rate means that the organization has more time to focus on patient care and spends less time on paperwork.
- Average Treatment Charge: Shows the average amount that a facility charges a patient for a treatment. It can be broken down by treatment or shown as an average of all treatments or treatment categories.
- Permanent Employee Wages: Records the value of wages (including bonuses) paid to all full-time employees during the reporting period. This is sometimes separated out by administration, and sometimes by direct providers of care.
KPI Focus: Profitability & Business Development
If your healthcare facility has a goal to increase profitability, track metrics like the ones listed below. In addition to signaling your ability to generate a profit, these will help determine whether your other efforts—for example, to improve operational efficiency or patient satisfaction—are working:
- Average Charge & Reimbursement Per Treatment
- Net Days In Accounts Receivable
- Insurance Processing Time
If your healthcare organization is still in its early stages of growth, you may want to focus on measuring business development with these KPIs:
- Patient Acquisition Cost
- Sales & Marketing Spend/Number Of New Patients
- Revenue Per Patient
Communications
- Number Of Media Mentions: Keeps track of how often you're mentioned in the media, which could include news outlets as well as social media. You may want to consider tracking positive and negative mentions separately.
- Overall Patient Satisfaction: Calculates satisfaction levels by combining several factors. This can be a great marketing tool for your organization if it's high, but a low number could signal a problem with other operations or services.
- Percentage of Patients Who Found Paperwork To Be "Clearly Written & Straightforward": Demonstrates whether a healthcare organization has ensured that written materials have clear instructions that patients can understand easily and respond to.
<div class="index-cards"><div class="index-card"><div class="index-card-title"><h3><strong>Mastering the Art of Strategic Measurement</strong></h3></div><div class="index-card-content"><p>The data (outlined in our <a href="https://www.clearpointstrategy.com/go/strategic-planning-report">2026 Strategic Planning Report</a>) is clear: The number of measures organizations use has changed over the years, but when they pulled back to 7–8 measures (between 2021 and 2023), completion rates peaked at 22.5%.</p><p>If you’re currently contemplating tracking more than 11 strategic measures, you might be confusing measuring progress with making progress. In fact, it’s likely that few people will actually use those extra measures for decision-making.</p><p><strong>Lean KPI frameworks — anywhere from nine to 11 measures — correlate with higher completion rates. </strong>This number isn’t a rule — it’s a pattern observed in organizations that actually execute their strategy. Leaner dashboards eliminate noise metrics and sharpen focus on what truly drives success.</p><p>While it’s good to have a number as a general guidepost, however, don’t simply strive to have nine, ten, or eleven KPIs.</p><p>Forget the number.</p><p>First ask: “What do we need to know to make strategic decisions?" The number will follow from that. When you shift your focus from metrics to outcomes, you can easily choose three to four meaningful measures per strategic outcome.</p></div><div></div>
Internal
- Number Of Trainings Per Department: Tracks the amount of training each department provides or requires of their staff.
- Number Of Mistake Events: Measures the number of mistakes made in the organization, which can be tracked by mistake category. This can indicate the effectiveness of the employees and the equipment.
- Patient Confidentiality: Measures the number of times a patient's confidential medical records were compromised or seen by an unapproved party.
- Number Of Partnerships With Advocacy Groups: Counts the number of relationships established with other organizations. A high number of partnerships can increase the impact of campaigns and policy events.
KPI Focus: Employee Experience
Healthcare workers are more prone to burnout than employees in other sectors. There are a number of KPIs related to engagement and satisfaction that can help you stay on top of employee sentiment—and ultimately tell you a great deal about how your business is faring. Some examples include:
- Job Satisfaction
- Employee Retention
- Employee Net Promoter Score (NPS)
Public Health
- Childhood Immunizations: Demonstrates the number of children who have received immunizations, which reflects your contribution to overall community health.
- Number Of Educational Programs: Indicates the time and effort put into educating the public. This can be broken down into the type of program as well as the target audience for each program.
- Number Of Preterm Births: Counts the number of preterm births (under 37 weeks) that have occurred in the region.
Emergency
- Patient Wait Times By Process Step: Shows the amount of time a patient must wait during their visit to the emergency area of the facility.
- Time Between Symptom Onset & Hospitalization: Gauges the amount of time between when a patient begins experiencing symptoms and when they were hospitalized.
- Number Of Visitors (Patients) Who Leave Without Being Seen: Indicates the number of people who were unwilling to wait to see a physician. This may help determine if more beds or staff are needed to handle the number of patients coming in.
Care
- Medication Errors: Measures the number of times there is an error in prescribing medication at the facility. This includes when a mistake is made in the medication, patient, or dosage, and it applies to both inpatient and outpatient services.
- Patient Vs. Staff Ratio: Demonstrates the number of staff available per patient. May indicate whether the facility is overstaffed or understaffed.
- Patient Follow-Up: Measures the number of patients who receive follow-up after their visit to the facility. This could be from a physician, nurse, or other staff member asking about the visit and the patient's improvements.
Pro tip
Every healthcare provider should be concerned with patient satisfaction because it can have a significant impact on your profitability and reputation. Patient satisfaction can be quantified with the help of the following KPIs:
- Patient Experience
- Online Reviews
COVID-19-Related
- Confirmed COVID-19 Cases: Measures the number of COVID cases based on laboratory confirmation.
- Hospital Length Of Stay For COVID Patients: Measures the average length of time patients remain in the hospital. Staying on top of this important hospital KPI can help you better prioritize your resources.
- Census/Occupancy %/Admissions/Discharges/Average Length of Stay: Provides an overview of COVID status in each department—inpatient and outpatient units, emergency department, critical care, and others.
- Mortality Risk: Measures the share among the entire population that have died from a particular disease. This measurement can help communities assess their relative threat from COVID, prompting high-risk areas to take more preventive action.
- Transmission Risk: Combines three metrics to determine a community’s level of risk: the number of new cases per 100,000 people in the past seven days; the percentage of positive tests in the past seven days; and the percent of staffed inpatient beds occupied.
A Final Tip: Measure Your KPIs
Keep in mind that once you’ve chosen your KPIs, the next step is to set measurable KPI targets.
The best way to do that is with benchmarking—comparing the performance of your organization with that of your competitors. If you simply set targets based on what you’ve always done, those numbers could be far off from the industry norms and may not actually help you improve. (That said, internal benchmarking, which compares the performance of similar functions within your organization, can also be a useful activity.)
Finding accurate, current data sources for KPI targets in the healthcare industry can sometimes be a challenge. Talking to peers or healthcare consulting companies about their data sources, purchasing competitive benchmarking reports, and reviewing healthcare publications are all ways to get your hands on valuable data that can help inform your efforts.
Need additional ideas of healthcare metrics to track? Take a look at this free list of metrics, organized in the eight categories above. They all include descriptions of how and why to measure that particular KPI, and they come in a simple and accessible Excel format.
Claim your FREE 108 healthcare KPI library to improve your organizational performance
Empower Your Healthcare Team with ClearPoint Strategy Software's Advanced KPI Tools
Healthcare organizations are facing unprecedented changes and challenges. Now, more than ever, the right key performance indicators (KPIs) are critical to navigating this evolving landscape. ClearPoint Strategy empowers healthcare leaders with the tools to define, measure, and achieve their strategic goals.
Ready to elevate your organization's performance? Book a personalized demo today!
Book your FREE 1-on-1 DEMO with ClearPoint Strategy
FAQ:
What are healthcare KPIs?
Healthcare Key Performance Indicators (KPIs) are specific metrics used to evaluate and monitor the performance of various aspects of healthcare services. These KPIs help measure the efficiency, effectiveness, and quality of care provided by healthcare organizations, ensuring that they meet established standards and improve patient outcomes.
Why are KPIs important in healthcare?
KPIs are important in healthcare because they:
- Monitor Performance: Help track and measure the performance of healthcare services and processes.
- Improve Quality of Care: Identify areas for improvement to enhance the quality of patient care.
- Ensure Accountability: Hold healthcare providers and organizations accountable for their performance.
- Support Decision-Making: Provide data-driven insights to inform strategic and operational decisions.
- Regulatory Compliance: Ensure that healthcare organizations comply with industry regulations and standards.
What are some common healthcare KPIs?
Some common healthcare KPIs include:
- Patient Satisfaction: Measures the level of satisfaction among patients regarding their healthcare experience.
- Readmission Rates: Tracks the rate at which patients return to the hospital after discharge.
- Average Length of Stay (ALOS): Measures the average duration of a patient's hospital stay.
- Bed Occupancy Rate: Indicates the percentage of occupied beds in a hospital or healthcare facility.
- Infection Rates: Tracks the incidence of hospital-acquired infections.
- Employee Turnover Rate: Measures the rate at which healthcare staff leave the organization.
- Cost per Patient: Calculates the average cost incurred for treating each patient.
- Emergency Room Wait Time: Measures the average waiting time for patients in the emergency room.
How can KPIs be used in performance management?
KPIs can be used in performance management by:
- Setting Benchmarks: Establishing performance benchmarks and targets for various aspects of healthcare services.
- Tracking Progress: Continuously monitoring and measuring performance against the established KPIs.
- Identifying Areas for Improvement: Highlighting areas where performance is lagging and implementing corrective actions.
- Providing Feedback: Offering regular feedback to healthcare providers and staff based on KPI data to encourage continuous improvement.
- Reporting and Communication: Sharing KPI results with stakeholders to keep them informed about performance and progress.
How can KPIs improve the performance of an organization?
KPIs can improve the performance of an organization by:
- Driving Focus: Focusing efforts on key areas that impact overall performance and quality of care.
- Enhancing Accountability: Holding individuals and teams accountable for achieving specific performance targets.
- Supporting Strategic Goals: Aligning day-to-day activities with the organization’s strategic goals and objectives.
- Encouraging Continuous Improvement: Promoting a culture of continuous improvement by regularly reviewing and acting on KPI data.
- Facilitating Better Resource Allocation: Guiding the allocation of resources to areas that need improvement or have the greatest impact on performance.