Seven free strategy map templates and examples that show how to put your strategy on one page.
- Put the perspective you serve first at the top of the map. For-profits lead with finance, cities with citizens; a for-profit hospital balances patients and finances.
- Be specific about where growth comes from. The manufacturing example names acquisitions over throughput and carries that goal through all four perspectives.
- Keep measures off the map. Show objectives and their cause-and-effect links; the Balanced Scorecard holds the initiatives and metrics.
- Share the map with an inspire, educate, reinforce, listen sequence. Leaders assume people know the strategy, but research suggests many do not.
- Start from the free strategy map builder. Adapt an example's objectives to your strategy, then work backward to how you'll achieve them.
A well-thought-out strategy map is a beautiful thing. It's an important part of your Balanced Scorecard, because it "tells the story of your strategy" on one page.
It maintains a solid structure while allowing for a great deal of flexibility, so it can represent virtually any segment you operate in and your unique strategy. And of course, if it matches your company branding and includes your logo, your team will be even more impressed.
ClearPoint Strategy software makes strategy maps easier to create, manage, and share. With ClearPoint, your strategy maps stay aligned with your Balanced Scorecard and carry your own strategy and company branding. If you’re just starting a strategy map and want templates and examples, you’re in the right spot.
This article covers 7 strategy map examples: two for-profit, two in healthcare, one nonprofit, and two local governments. Together they show how a map can represent very different strategies. We also offer tips on what to do with your strategy map once it’s complete. In our view, there’s nothing worse than an unused strategy map.
Note: If you are new to strategy mapping, or need a review of the four perspectives in a Balanced Scorecard, this article will bring you up to speed.
Strategy Map Example #1: for A Manufacturing Company
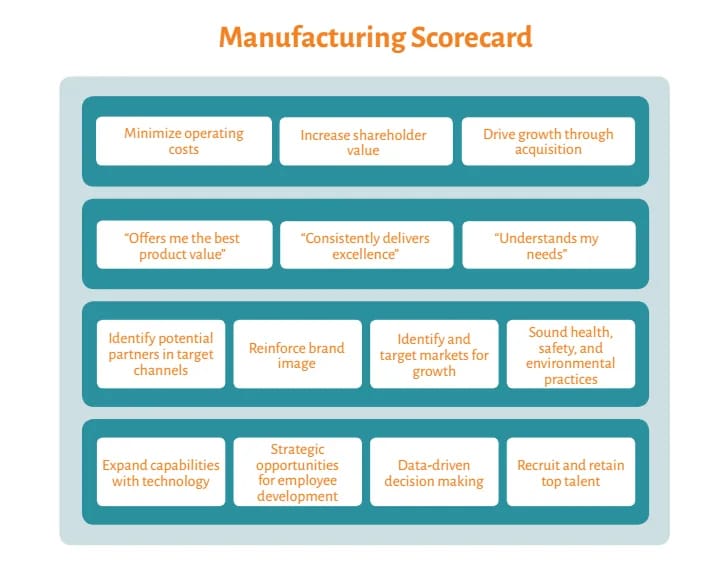
A for-profit scorecard can take many angles, depending on your strategy. This example comes from a manufacturing organization focused on acquisitions, and you can see that through all four of these perspectives.
If you’d rather build it than download a file, use the free strategy map builder. It works in the browser with no account, and asks for email only if you want to export.
Even though they are not listed, the perspectives in each of the teal boxes are, from the top: financial, customer, internal, and learning & growth. In the financial perspective (at the top of the map), this organization is specific about driving growth through acquisitions, rather than through increased throughput alone. A successful strategy map is specific about where growth comes from.
Throughout the map, you can see this organization prioritizing growth through acquisitions. For example, they list a goal of identifying and targeting markets for growth in their internal processes (shown in the third perspective). And in the bottom perspective, around learning and growth, they have a goal of making data-driven decisions.
While each of these goals helps drive growth for this manufacturing organization, your organization might have a different growth strategy.
Strategy Map Example #2: for A Publicly Traded Organization
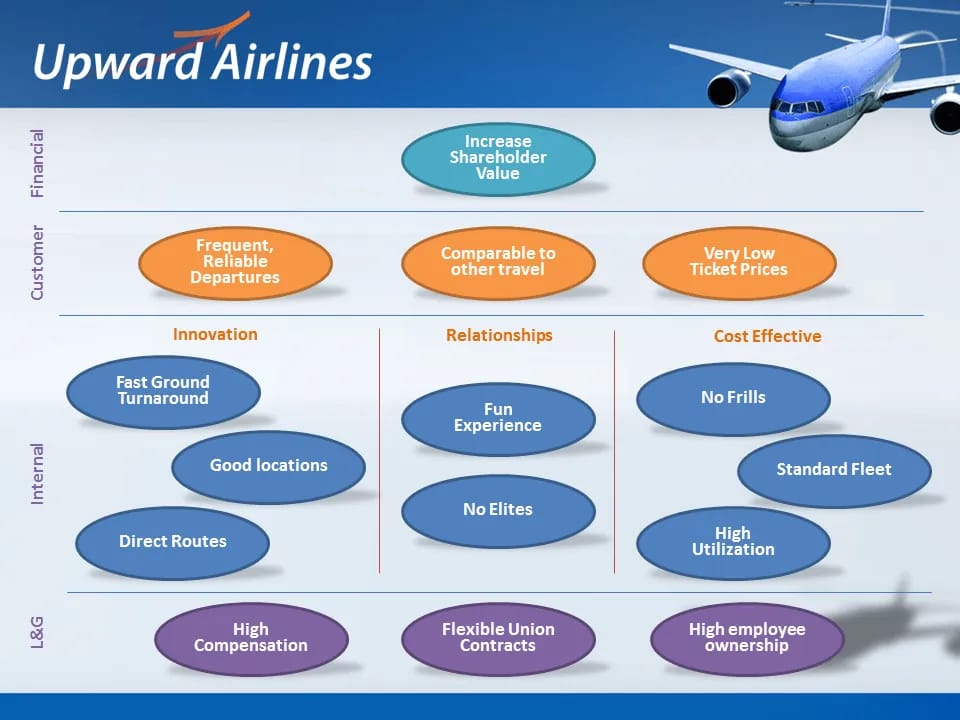
In this example, the fictitious Upward Airlines is a traditional for-profit organization, so the financial perspective is placed at the top. Because it’s publicly traded, Upward Air has a single goal of increasing shareholder value, and the layout of the strategy map reflects that.
Supporting the primary financial goal is the customer perspective. The map breaks down what this airline’s customers value most: reliable departures, comparable (to bus or train) travel, and low prices. The internal perspective shows the airline’s focus on three big-picture categories, each with narrower, more specific priorities.
For example, Upward Air plans to drive innovation by prioritizing turnaround times, locations, and routes. Next, the Learning and Growth perspective shows how an organization can incorporate a union environment into its strategy map and overall values. High employee ownership is unusual with unions, but Upward Airlines believes it keeps employees engaged and happy, and that this translates to customers being treated well and having fun. So it is on the strategy map.
As you can probably guess, this is a strategy map for a low-cost airline. The map for an international airline catering to business travelers would look very different. Balanced Scorecard strategy maps should be tailored not only by industry, but by company. Get ideas from these examples, but copying and pasting won’t work.
What You Can Learn About Strategy From An Industry Leader
Every industry thinks its strategic planning challenges are unique, and to some degree they are. But at the same time, our recent analysis of over 20,000 strategic plans shows that certain fundamentals of strategy planning and execution are the same no matter what industry you’re in.
That’s good news: It means you can learn from any high performing company and apply those principles to your own strategy to improve your performance.
Our analysis shows that the Energy & Utilities sector stands out as the Execution Exemplar. It leads all sectors with a 25.8% completion rate, the highest by a wide margin.
🏆 Energy & Utilities has cracked the code. This industry tends to have:
- Strategic ambition (the right number of goals)
- Project discipline (the right number of projects)
- Milestone rigor (an ideal number of milestones)
- Clear owners (high accountability)
All of which leads to exceptional execution.
Strategy Map Example #3: for A Growing Healthcare Company
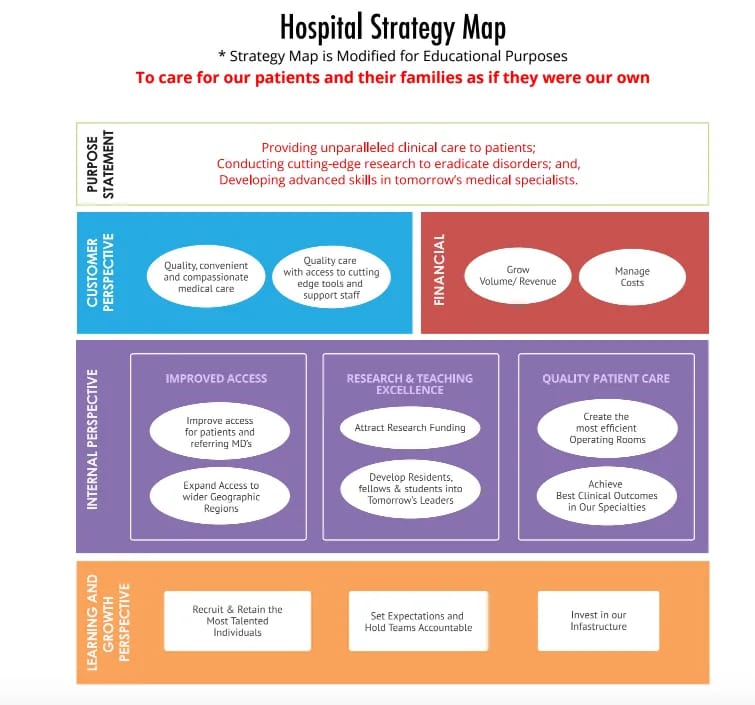
This sample strategy map is based on a healthcare system that is looking to grow outside of its current geographical boundaries. It shows how a strategy map can flex to fit your organization’s own strategy and environment.
The top two perspectives, customer and financial, highlight this health care system’s goals of providing convenient medical care and growing in volume. A growth plan needs both. These goals flow down to the “Improved Access” theme in the internal perspective, which specifically highlights expanded patient access in a wider geographic region.
In the bottom perspective of learning and growth, one of the objectives is to invest in infrastructure, which further supports the overall theme.
Keep in mind, your strategy is likely different and may have different objectives. It may even have the same objectives, but different definitions and measures. It is not hard to imagine investing in infrastructure as a way to become more modern and efficient without growing geographically.
Strategy Map Example #4: for A Hospital
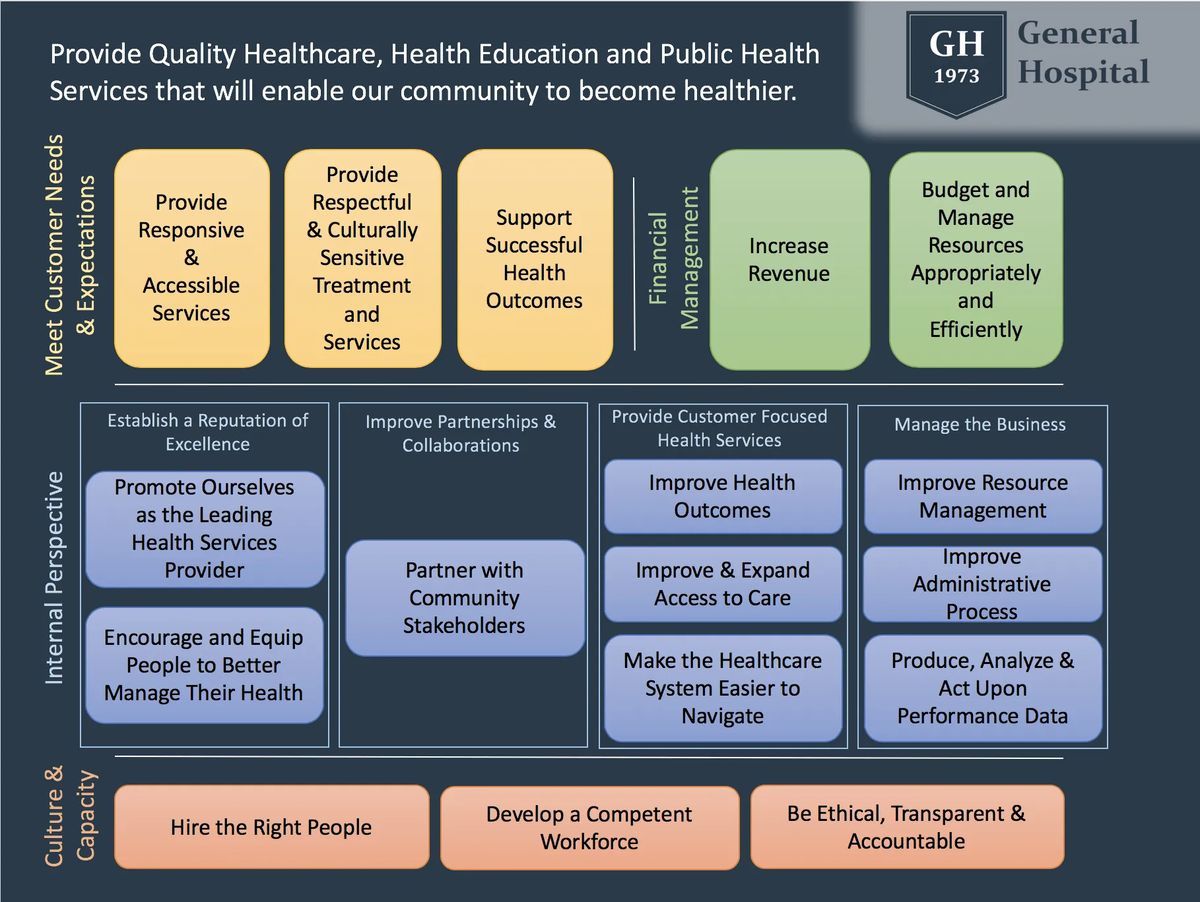
Fictitious General Hospital is a community, for-profit hospital. As a result, the customer (patient) and financial perspectives are equally balanced at the top of the strategy map. This indicates the hospital is trying to provide needed services within the scope of its fiscal limitations and resources.
The revenue and budget will determine the extent of the services and treatment General Hospital provides to the community. The focus may be on diabetes for an overweight community or orthopedics for an elderly community.
The internal perspective is divided into four areas of focus, each with a subset of priorities that support the larger category. The four areas all align with the customer and financial perspectives (and mission), even if it’s not immediately apparent.
For example, while managing the business doesn’t seem directly tied to the human health outcomes, this initiative is key to providing more healthcare with limited resources. More specifically, if General Hospital can understand how patients are moving through its systems, it can pinpoint areas of improvement.
Notice that General Hospital chose to place its mission statement in the header of its strategy map and to use the terminology “Culture and Capacity” instead of “Learning and Growth.” These are two ways to customize the framework. Aside from certain core best practices for developing a strategy map, you have a lot of flexibility when labeling and arranging sections.
Strategy Map Example #5: for A Non-Profit Social Services Organization
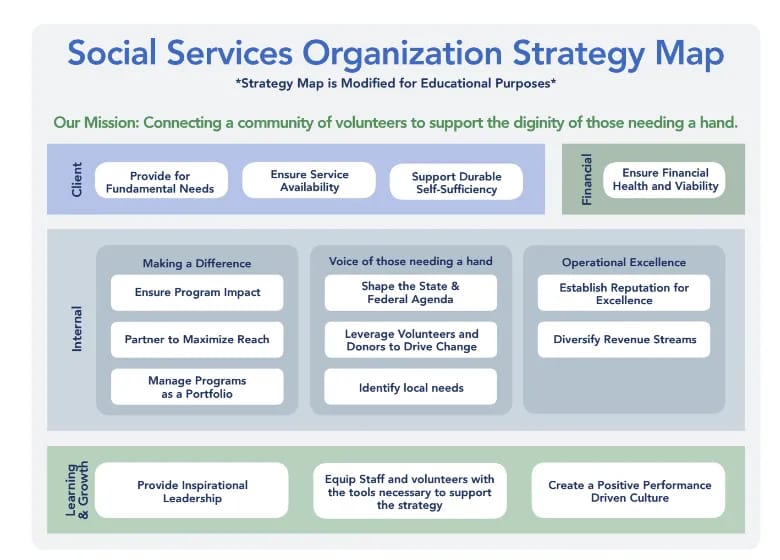
That’s right: a Balanced Scorecard strategy map is an excellent framework for a nonprofit organization. This strategy map is for a social services organization heavily involved in aiding the surrounding community. Look closer and you can see how every objective supports this mission.
One of the primary objectives in the client perspective is ensuring that this organization can provide services to those who need it in their region of operation. In some cases, this means referring individuals outside of their nonprofit.
This flows down to the middle internal theme of becoming a voice for those in need by shaping the state agenda, leveraging volunteers, and identifying local needs. Each of these objectives shows a focus on serving the local area and making local and state governments aware of the challenges their constituents face. The organization provides services and is the voice of those in need in the community.
In the final perspective, learning and growth, this nonprofit focuses on giving staff and volunteers the tools they need to meet the needs of the people they serve in order to support their strategy.
Strategy Map Example #6: for A Local Government
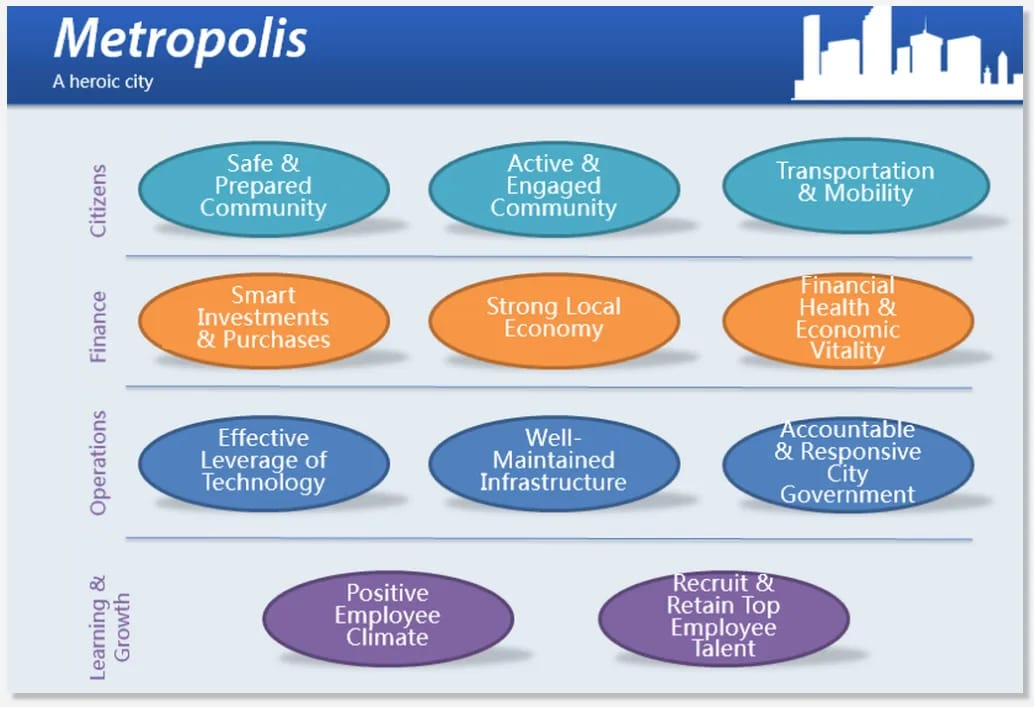
For a municipality, the goal isn’t to make money, but to serve the community. As a result, the top perspective in any local government strategy map should be focused on citizens.
Our example city of Metropolis leads with the customer (citizen) perspective, broken down into three areas: safety, activity, and mobility. These three categories are what the community values most, and Metropolis is prioritizing them accordingly. The finances support the citizen perspective. The language makes clear this is not a for-profit corporation. The city wants to prove to citizens it’s making smart financial choices and growing the economy.
The operations perspective also makes it clear that the government is serving the community by focusing on technology, infrastructure, and accountability. Each area is geared toward making citizens’ lives better and easier. Underpinning everything is the learning and growth perspective. Building a productive and positive workforce will help Metropolis improve its operations, then its finances, and in turn citizens’ quality of life.
Strategy Map Example #7: for A City Or Municipal Government
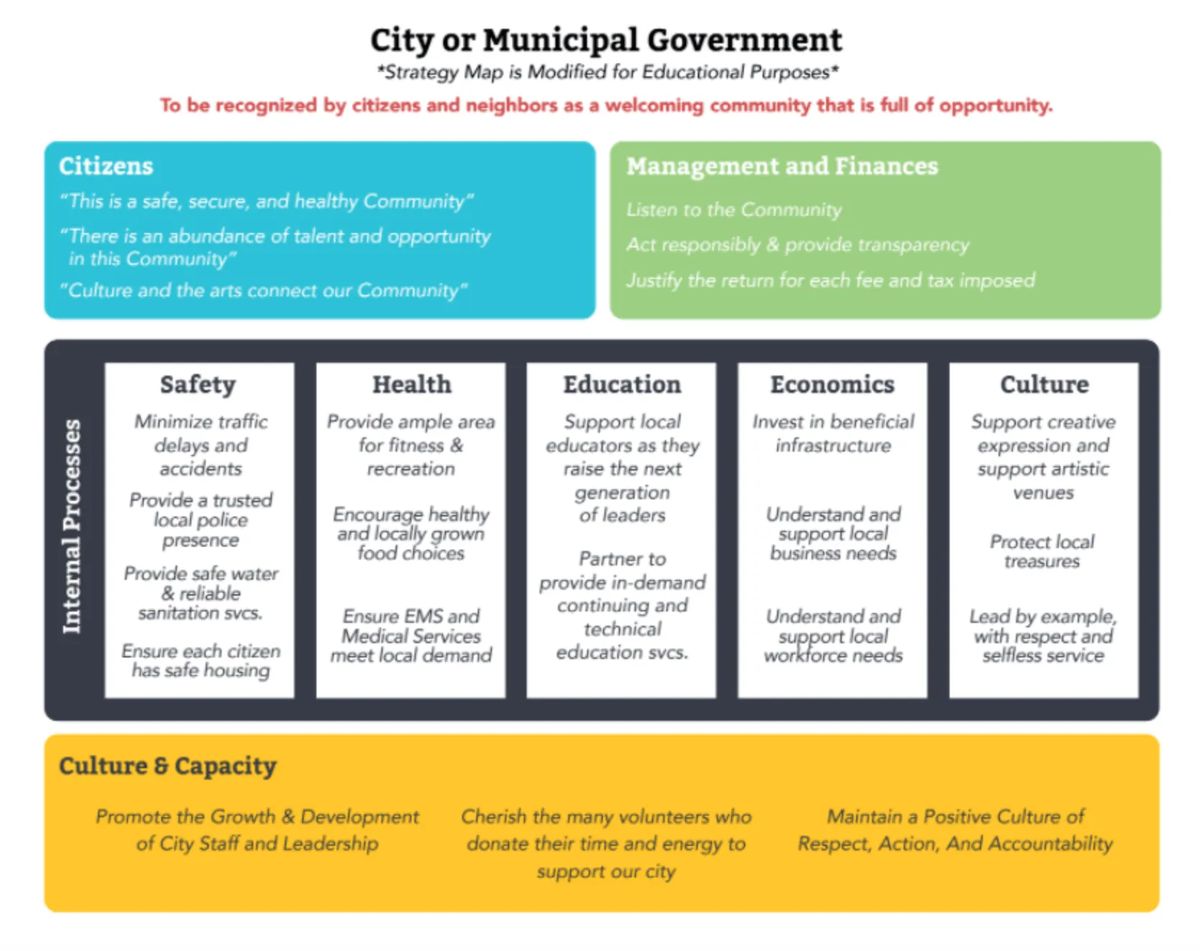
This example city has two perspectives on top: citizens and finances.
On the citizen side, the leadership is focused on safety, opportunities, and culture. Leaders weigh that alongside providing transparency and justifying fees and taxes. The municipal leaders know they can’t simply raise a bunch of money to be the safest and most secure; they need to be cognizant of costs and put funds in the places where they’ll do the most good.
The city leadership then breaks down its internal processes into five key areas: safety, health, education, economics, and culture, and identifies the key objectives in each area. Many of them are cross-functional.
This map reflects the reality that, if you want to create a safe, secure, and healthy community, many municipal groups need to work together.
Remember: It’s OK to Be Different
All of these maps are very different from one another, but that doesn’t mean any one is more effective than another. When your strategy map is focused on your unique strategy, it is more likely to succeed. Start with one of these examples and revise the objectives so they describe your organization's strategic plan. Then, work backward to consider how you’ll achieve those objectives.
Note that a strategy map usually does not contain measures; it simply shows the cause-and-effect relationships between certain improvements and desired outcomes (the objectives). The Balanced Scorecard itself includes the specific strategic initiatives and metrics that drive performance.
Get the ebook of balanced scorecard strategy map examples
After Creating Your Map… What Comes Next?
As you probably expected, it’s time to share it!
Too many leaders assume everyone understands the organization’s strategy, yet research suggests this is often not the case. People who don’t understand how their jobs contribute to organizational goals may focus their efforts in the wrong places, or worse, feel unmotivated to contribute at all. When teams know they’re having an impact, productivity and morale go up.
Even if you think you’ve communicated your goals well, plan to double your efforts to get the message across. Strategy maps help here. They are easy to understand and easy to share, and as a visual tool, they help people retain information.
To communicate clearly, consider a series of messages to employees using the inspire/educate/reinforce/listen framework:
- Inspire: Set the stage for your strategy discussion by stirring up some emotion. Talk about the significance of some of your organization’s past successes and how they have benefited your customers. Hopefully you’ll spark some energy that will carry over into the next round of messaging.
- Educate: Explain your strategic goals and decisions using the strategy map as a focal point. You may want to do this in small groups, where conversation is encouraged, in addition to presenting to the larger group as a whole.
- Reinforce: Repeat the strategy message many times and in different ways, through meetings, emails, online forums, and more. Be creative with the strategy map. You could print it on business cards, create posters, or paint it on office walls or windows, for example.
- Listen: Your employees will likely do their best to carry out the plan, but they’ll inevitably have questions and feedback. Listen to their concerns, make adjustments if necessary, and use the opportunity to further explain the rationale behind your strategy decisions.
Strategy maps give everyone in your organization a common point of reference, which is key to aligning people and departments. For more details on how to develop a strong communication plan, refer to the 4-step process listed in this article.
Discover a Smarter Way to Build Your Strategy Maps with ClearPoint Strategy
ClearPoint Strategy helps you visualize and execute your company’s goals. With custom templates, real-time data integration, and easy sharing, ClearPoint turns complex strategies into clear, actionable plans.
See it in action. Book a free demo today to find out how ClearPoint can change your strategic planning process.
Common questions
Should a strategy map include measures?
Usually not. A strategy map shows objectives and the cause-and-effect links between them on one page. Measures, targets and initiatives belong in the Balanced Scorecard behind the map. Leaving them off keeps the map readable; adding a status color to each objective is a common middle ground when leaders want to see progress.
Which perspective goes at the top for a government or nonprofit?
Put the people you serve at the top: citizens, patients or clients. Finance moves underneath as a supporting perspective that shows stewardship, or shares the top row with the customer view when services must fit fiscal limits, as in a community hospital. Internal processes and learning and growth stay below them.
How many objectives should a strategy map have?
Few enough that the map fits on one page and every objective can have a named owner, spread across the perspectives. A crowded map hides the cause-and-effect story it exists to tell. Push extra detail into department or business-unit maps that link back to the top-level objectives instead of adding more boxes.
Can we copy one of these strategy map examples?
Use one as a starting point, not a finished map. Pick the example closest to your sector, rewrite every objective so it describes your own strategy, then work backward to how you will achieve each one. A low-cost airline and an airline serving business travelers would draw very different maps from the same template.
How do you get employees to use the strategy map once it is built?
Run a communication series, not one announcement. Inspire by linking the strategy to past wins, educate in small groups with the map as the focal point, reinforce it in meetings, emails and visible places, and listen to questions so you can adjust or explain decisions. Expect to repeat the message more than seems necessary.