

Get answers like this one, first.
Google’s AI Overviews now favor the sources you choose. Add ClearPoint once, and our research shows up in your AI answers — badged and prioritized.
Add ClearPoint as a Preferred SourceFree · one click · applies only to your own Google results.

ClearPoint summary report customization has flexible variation to suit everyone.
Excel, PowerPoint, SharePoint and even more niche reporting tools are common choices when companies need to create reports, but these programs can take a “one size fits all” approach and lead you into some serious reporting issues.
Different audiences need to see different data, or need the same data positioned in different ways. We get that and listen closely to the feedback our customers give us about the reporting tools they want. In this article, you’ll learn how you can easily create and customize your summary reports in ClearPoint, in a hundred different ways.
Why Summary Reports Matter
With ClearPoint’s flexible tools, you can create customized reports for a variety of audiences. Our summary reports are particularly powerful because they dramatically cut down the time you spend building reports, while providing more insights than any other program. From setting filters and changing formats to generating ad-hoc reports and making global updates, it just takes one minute—literally.
Presenting your data in different, flexible ways while pulling from the same source information improves your organization’s reporting consistency and eliminates errors. It also gives you the option of displaying quantitative and qualitative information together, which can help stakeholders make decisions based on facts and in-depth insights, versus gut instinct.

Report Features You Won’t Be Able To Live Without
When we say that it’s so much better to create summary reports in ClearPoint, we mean it. That’s because reports in our software are:
Easy To Build & Edit
With ClearPoint, you don’t need any technical knowledge to build your dream reports. Simply build a report once and then change it on the fly, whenever you need to. With quick-click and drag-and-drop functionality, our reporting tools are user friendly for even the least tech-savvy users.
You can create an unlimited number of reports for different audiences that pull from the same data source—that means you only have to enter data once and it can be used in multiple places. When you change any information, it will automatically update in all reports, which makes everyone happy because it’s a lot less work to ensure data is accurate and up to date.
Incredibly Customizable
Make your reports look exactly the way you want and tailor the information you include to suit a specific audience. Some of the top ways you can customize your summary reports include:
- Branding: Add your company colors and logo to match the look and feel of your existing reports. Administrators can control branding options to ensure every report stays on brand!
- Formats: Create custom styles using colors and fonts and apply those styles to an entire report, or just individual columns or rows. For example, you can direct attention to a specific column by making it a different color. You can also adjust layouts however you’d like, adding or removing columns and rows. This includes adjusting details such as the column/row headers (names) and widths.
- Full-Width Rows: Break up your report by enabling this custom “wide” view, which makes the page more readable and gives the report a cleaner look. It’s similar to merging cells in Excel, but your full-width rows automatically adjust when you add columns and data to your report.
More Comprehensive
We built our reporting tools to not only allow for, but spotlight in-depth insights that are not easy to get with other solutions. Using these features helps elevate the most important data and analyses, so your audience can make better decisions:
- Alignment: Link strategic elements in a logical manner to make it clear why and how even the smallest data point or effort ties to long-term goals. Your audiences will be able to understand how everything “fits together” across the entire organization, perhaps for the first time.
- Data Calculations: Don’t get stuck in the weeds trying to understand how your data is calculated, or how the data aggregates within your accounts. With ClearPoint’s Link Explorer, you can explore links between elements and quickly see how elements are calculated. Say goodbye to time wasted in Excel formulas!
- Data From Multiple Element Types: Order or group your elements (objectives, measures, initiatives, milestones, etc.) however you’d like in a report. You can customize reports by:
• Pulling in elements from across scorecards
• Adding columns from across elements
• Creating custom filters, such as periods of data
• Showing owners and status icons alongside each element
• And more!
More Insightful and Dynamic
- Data Over Time: Choose any data series to show in each report and control how it displays. This gives you the ability to show actual and target data side by side, or create versions of reports that show data over different periods of time (such as year-to-date metrics in one version and monthly data in another).
- Report Filters: Leverage filters to create dynamic reports, so you’re always sharing only the most relevant information. For example, you can create a “red-alert view” that shows any measures that are below plan in a given time frame. Month to month, measures that are no longer flagged as red will drop off the report, while any measures that fall behind will appear.
Always Up-to-Date
When it’s time to rerun a report for a month or quarter, just Your data can be edited and updated right from the summary report itself – no navigating to other pages to update the data you need. Simply do it from one screen. Report formatting and any information that’s automated or already in your account will instantly be added to the report. In a fraction of the time, your report will be ready to circulate or add to a meeting agenda.
Ensure your reports are on time with ClearPoint’s automation features. Simply schedule when you want your reports to send – and to who. You’re all ready to discuss your strategy sooner with your team now that you’ve automated 70% of your reporting process.
Historical data is easy to access, too. If you want to see information from the previous month or reporting period, you can simply click back to it before adding your analysis for the new month. Historical data is always available for your reference and can easily be pulled into your reports to show progress over time.
[.blockquote-offer]That’s the short story. See all of our flexible report customizations with a live tour of ClearPoint.[.blockquote-offer]
3 Popular Summary Reports
Here are a few of our most commonly used summary reports. If you weren’t aware of them, check out the details below—they might become your favorites, too.
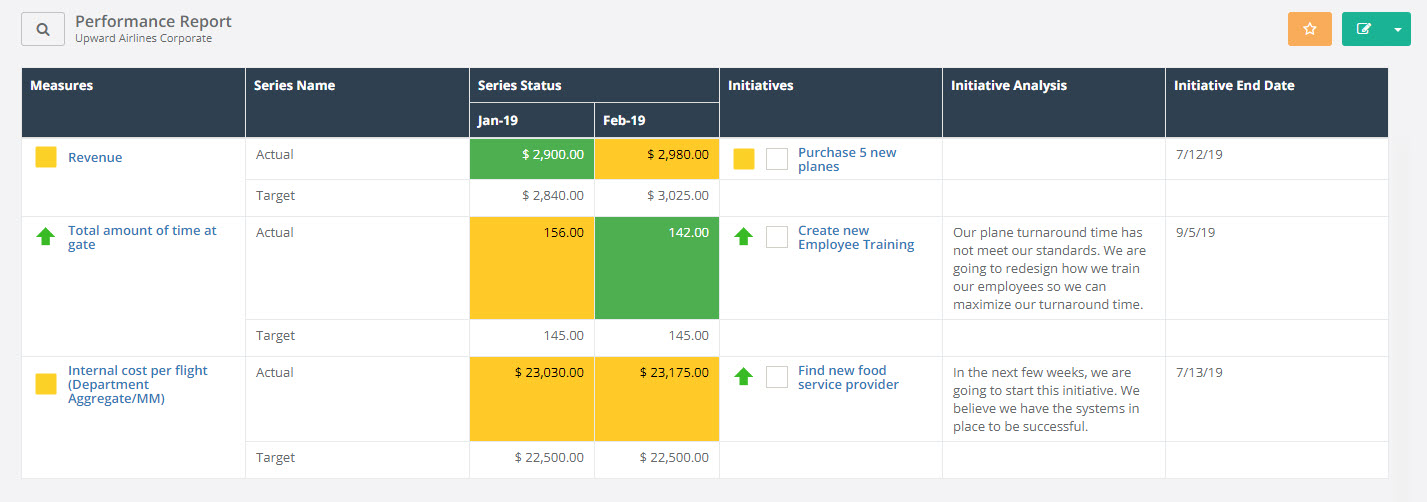
Performance (Measure Summary) Report
This report shows performance data for measures and initiatives side by side. This is helpful for tracking trends and showing how measures and initiatives are interrelated, helping leadership teams make informed decisions at monthly and quarterly meetings.
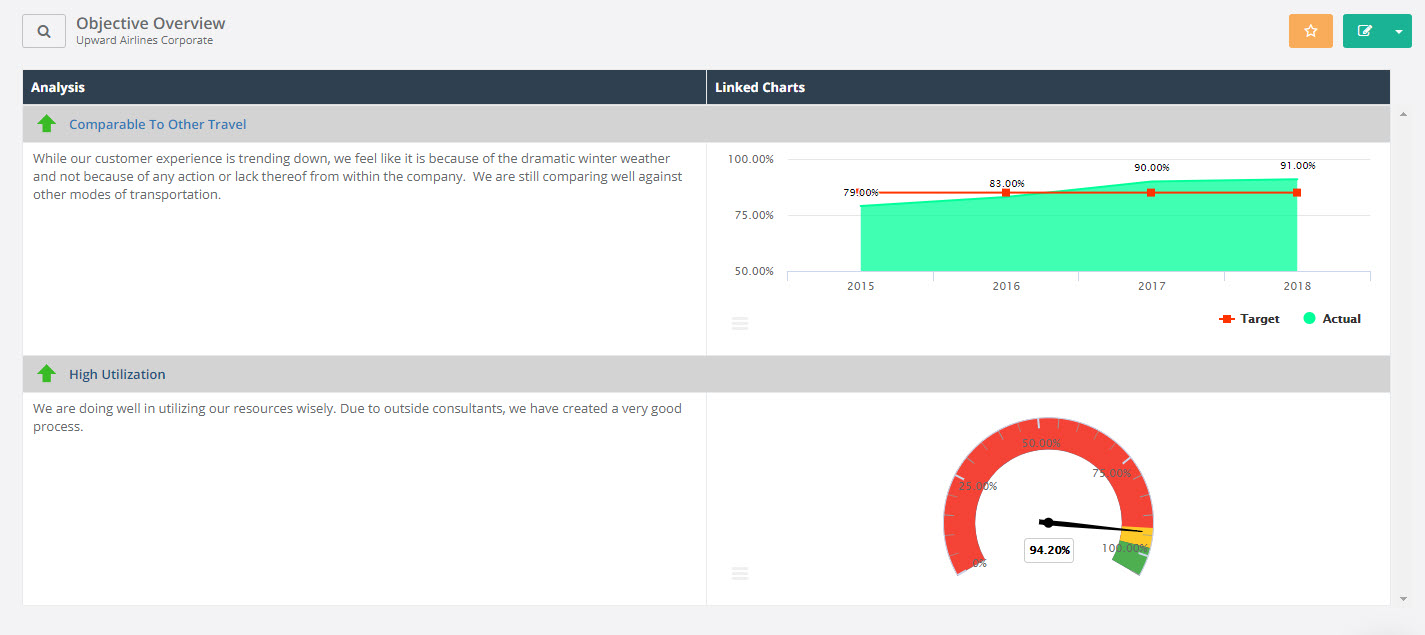
Objective Summary Report
This report contains objective analysis and linked measure charts. It’s a customer favorite because it gives managers and executives a high-level snapshot of objectives—with the ability to drill down into details—that are important to the overall business. It can answer the question, “How are we doing?” quickly and concisely.
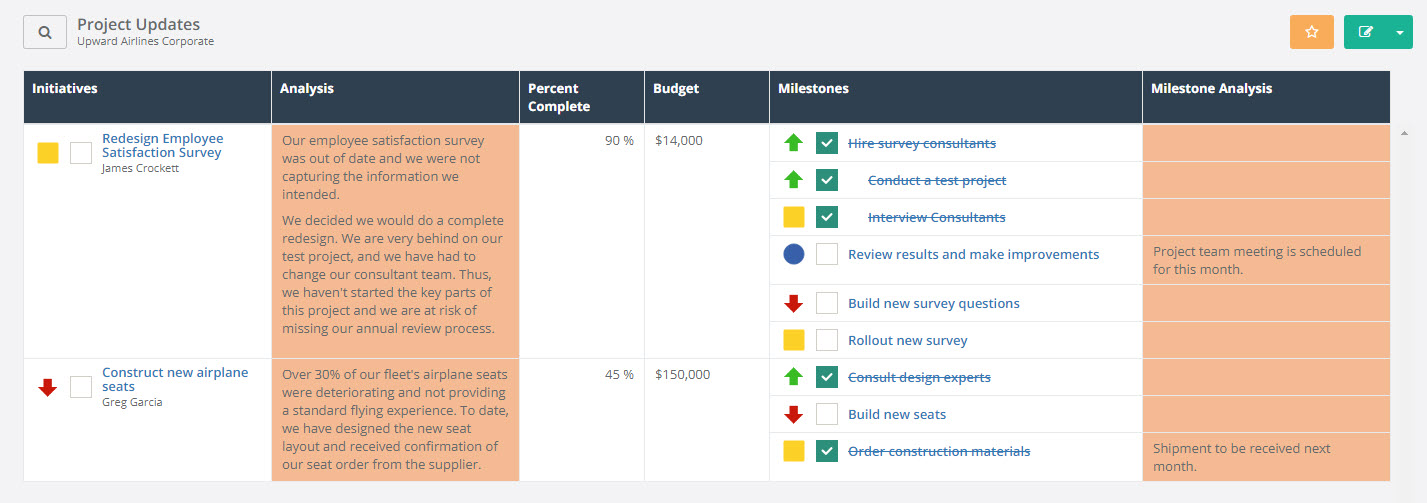
Project Updates (Initiative Summary) Report
Ideal for project managers and collaborators, this report highlights where project updates are needed and also includes analysis of individual milestones. It helps ensure projects are on track, have the appropriate resources and budget, and are completed in a timely manner.
ClearPoint offers many more powerful reports and customization tools that you need to see to believe. Schedule a demo to see what we have to offer.


