Operational efficiency rests on five components. Here is what each involves and how ClearPoint supports it.
- Prioritize the processes that need improvement first. Effort then goes where it has the most impact.
- Bring data from source systems into one place instead of re-keying it. The Data Loader and integrations cut manual effort and errors.
- Link budgets and projects to strategic objectives. Rolled-up milestones and action items show whether resources are well used, so you can pivot when they aren't.
- Give every KPI a red, amber or green status. Status highlights areas needing attention so corrective action starts promptly.
- Schedule reports for each audience and cycle; see the ROI of report automation. Current, filtered reports keep improvement cycles running on up-to-date data.
Operational efficiency means getting the best results from the least time and money. Efficient organizations do the same work with fewer wasted steps, and they can reinvest what they save in their products or services. It rests on five components: process optimization, resource management, performance monitoring, continuous improvement and clear communication. Below is what each one involves and how ClearPoint supports it.
Process optimization
Process optimization means removing waste and unnecessary steps, often by automating repetitive tasks. Start by identifying which processes need improvement first, so effort goes where it has the most impact. ClearPoint's strategic planning tools support that prioritization. Its AI Assistant can build a strategic plan for several strategy frameworks and suggest objectives and measures based on your priorities and historical data.

Manual data entry costs time and introduces errors. In ClearPoint, data comes in from source systems instead of being re-keyed. The Data Loader imports large datasets in various file formats, and integrations connect existing systems and databases, whether the data is financial, customer or operational. Workflows and Approvals then manage data updates, reporting cadences and oversight, which keeps reports accurate and consistent.
Resource management
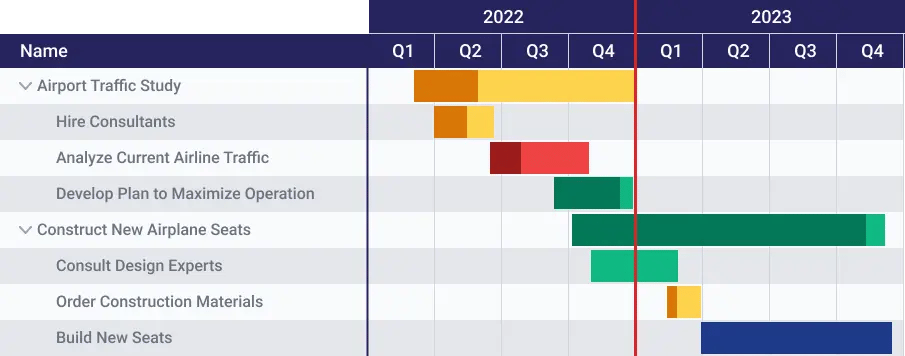
Resource management means putting staff, equipment, materials and budget where they are needed most, without overuse or underuse. In ClearPoint's project management tools, information rolls up from action items and milestones, budgets are linked to the strategy, and Gantt charts track progress against time. Linking projects and budgets to strategic objectives shows whether resources are well used and when to pivot.
Performance monitoring
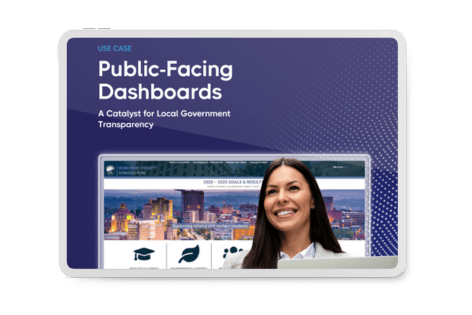
Regular tracking of performance metrics shows where operations need work. In ClearPoint, each KPI can carry a red, amber or green status, so areas needing attention stand out and corrective action starts promptly. The measure performance matrix shows trends across reporting periods, and charts can span any timeframe, such as quarters, years or several fiscal years. Internal or external dashboards display the data visually.
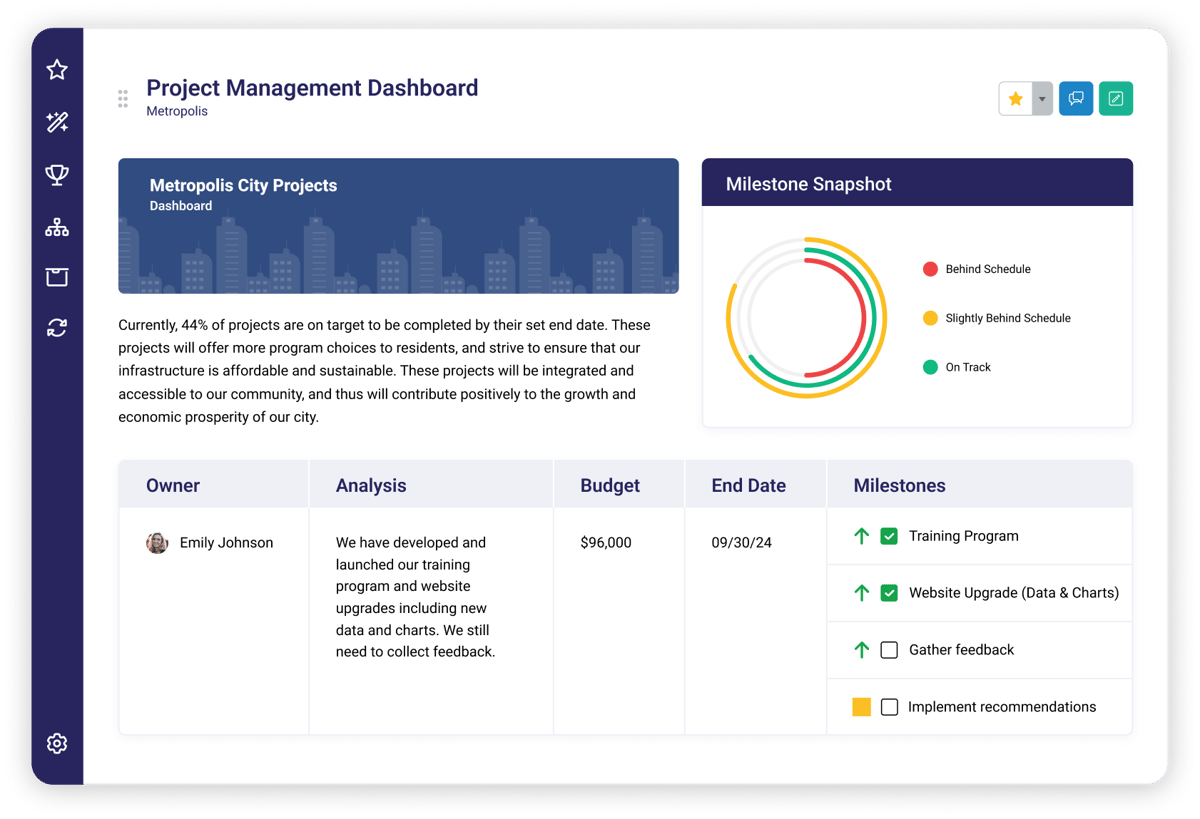
Data helps only once someone interprets it. For quantitative analysis, ClearPoint runs calculations and aggregates data from multiple sources, such as financial metrics and performance ratios. Summary reports give stakeholders a high-level view of key metrics. For qualitative analysis, ClearPoint AI can analyze text such as customer feedback and employee comments and identify trends in it.
Continuous improvement
Continuous improvement depends on a steady flow of current data, so teams can assess and refine their strategies regularly. In ClearPoint, reports can be scheduled for monthly or quarterly cycles and customized for each organization's branding and stakeholders. Filtered reports show only the data that meets set criteria, and briefing books compile data and analysis into one document for a specific audience. Drilldowns let readers start with an overview and move into detail. For the time this saves, see the ROI of report automation.
DC Thomson Media, the UK publisher of newspapers, magazines and comics, used to prepare for its monthly reviews by hand. Two team members spent 4 days per month holding 30-minute meetings with about 20 senior team members, updating Excel spreadsheets and building separate PowerPoint decks for the board. Leaders saw progress only once a month.
After moving to ClearPoint, DC Thomson cut board meeting preparation time by 75%, from 4 days to just 8 hours per month. Exporting and sending pre-reads took only 10-15 minutes per business. Red-alert summary reports flagged underperforming measures, and both departmental and Senior Operating Board meetings ran directly from ClearPoint. The strategy team spent its time helping the businesses meet their goals instead of on administrative tasks.
Clear communication
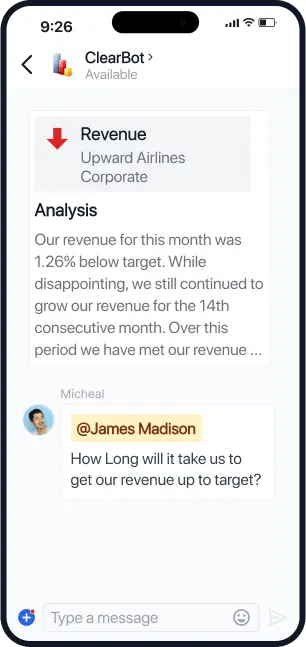
Clear communication across all levels aligns goals, reduces misunderstandings and keeps effort from going to waste. ClearPoint keeps current information and materials in one place to support collaboration across departments. Reminders, alerts, discussions and @mentions keep team members informed, and the Microsoft Teams integration brings the strategy into a tool people already use.
First National Community Bank (FNCB) uses reminders this way. Its goals used to live in Excel spreadsheets on a shared drive, with members updating their own goals and two strategic plan managers overseeing the process. Now automatic workflows send reminders on the first of each month, and members have 15 days to update their goal progress in ClearPoint. Tom Lunney, Vice President, manages the entire process alone.
How PG&E used ClearPoint
Pacific Gas and Electric Company (PG&E) used ClearPoint to align departmental initiatives with strategic goals and to simplify communication, which helped employees become more invested in their contributions. The company also relied on ClearPoint's automation and real-time reporting to support NERC compliance and avoid penalties. Tracking safety incidents, trends and the programs aimed at them supported its DART rate management.
Common questions