We analyzed 156 local-government strategic plans. The real benchmark is not how many KPIs you track, but how many are owned, fresh, and finished.
- Name an owner for every objective. Owned objectives are on track more than twice as often as unowned ones (23.6% vs. 10.6%).
- Get your own measures current before hunting for external benchmarks. ClearPoint shows which measures are out of date, and only a current figure can be compared with anyone's.
- Calculate your completion rate for the last 12 months. Initiatives with a named owner are completed 2.5× as often (21.5% vs. 8.7%).
- Publish progress on a public dashboard, even a small one. Residents watching the trendline make a stale measure hard to leave alone.
- Run the three-number self-assessment in this guide before your next council update. Compare completion, owner and freshness rates with the municipal medians, then report them quarterly.
We analyzed the live strategic plans of 156 city and county governments: 55,000+ projects, tens of thousands of measures, and the ownership and update behavior behind them. Here is what the typical city tracks, where benchmarking breaks down, and the three numbers that separate cities that execute from cities that just report.
If you run strategy or performance management for a city or county, you have probably asked some version of this question: “Are we tracking the right things? Is our plan too big? How do other cities actually do this?”
The instinct is to look for more data: more KPIs, more peer comparisons, a bigger library to benchmark against. Our analysis of how 156 local governments structure and run their plans inside ClearPoint found this: city KPI benchmarking works when the measures a city already has are current and owned.
The median city in our dataset is already tracking 136 projects across 18 separate plans. The missing ingredient is maintenance, not volume. Across these municipalities, ClearPoint shows which measures have not been updated in 12+ months, and which objectives still need an owner. You cannot benchmark a number nobody is watching against a peer who is not watching theirs either.
This article gives you the municipal benchmarks from the ClearPoint local-government dataset, the medians your city can measure itself against. It also redefines what “good” looks like. The honest benchmark for a city plan is what share of its KPIs are owned, fresh, and finished, not how many it tracks.
The Typical City Plan, By The Numbers
Here is the shape of the median local-government plan in our dataset of 156 cities and counties:
- 18 plans per organization: citywide strategy plus departmental and program plans rolling up underneath it.
- 136 projects (initiatives) at the median, the active work a city is trying to get done.
- 55,000+ projects in total across the 156 organizations.
City government is structurally broad, and that breadth is legitimate. A software company has one product line; a city runs police, fire, public works, parks, libraries, housing, economic development, and utilities, each with its own defensible metrics. The goal is never to shrink a city to a handful of KPIs. The question is whether the measures you carry are maintained, and ClearPoint shows which ones are.
The Benchmark That Actually Matters: Execution
The headline number: initiatives with a named owner are completed 2.5× as often, 21.5% vs. 8.7%.
Read that as a benchmark, not a verdict. Cities that put a name on every initiative pull away from the field.
The companion number is freshness. ClearPoint shows which municipal measures are out of date. A stale measure is a benchmarking dead end: you cannot compare your water-main response time to a peer if neither of you has updated the figure since the plan was adopted. Before you hunt for external benchmarks, get your own measures current. A fresh internal trendline beats a stale external comparison every time.
The Number Behind Everything: Ownership
The one metric that predicts whether a city plan executes is ownership. It is also the easiest one to check.
Across the broader ClearPoint dataset of 52,247 objectives from 324 organizations, the pattern is clear: objectives with an assigned owner are more likely to be on-track than those without (23.6% vs. 10.6%). Same plans, same software, same reporting cadence. The only difference is whether a name is attached. ClearPoint also shows which objectives still need an owner, and which have not yet been assessed.
For local government, ClearPoint shows which municipal objectives still need an owner. That is the most fixable gap in the dataset. You do not need a bigger KPI library to close it. You need a name next to every objective and a recurring date on which that name reports.
Most government leaders get this backwards. On ownership, municipal government is the best-governed public-sector tier in our data.
Cities and counties are governing their plans more tightly than states, school systems, and hospitals. Energy utilities show how much further cities can go by naming an owner for every objective.
How Your City Compares: A Three-Number Self-Assessment
Forget the 140-item KPI checklist for a moment. Pull your own plan and calculate three ratios, then compare them with what the dataset shows.
| Benchmark | What to measure in your plan | What ClearPoint data shows | Where the top tier sits |
|---|---|---|---|
| Completion rate | Initiatives completed ÷ initiatives due in the last 12 months | Owned initiatives complete at 2.5× the rate (21.5% vs. 8.7%) | 33%+ (1 in 3 finished) |
| Owner rate | Objectives with a named owner ÷ total objectives | Owned objectives are more likely on track (23.6% vs. 10.6%) | 75%+ owned (utility-tier discipline) |
| Freshness | Measures updated this period ÷ total measures | ClearPoint flags every stale measure | 70%+ current |
Run those three numbers before your next council update. If your completion rate is low, the first step is naming the gap instead of hiding it behind green dashboard indicators. If your owner rate is under 25%, that is almost certainly your highest-return fix. It moves on-track rates and costs nothing but a decision.
Ted Jackson’s Take: Why Benchmarking Fails In City Hall
I have spent more than 25 years helping organizations, a lot of them governments, actually execute the plans they spend months writing. I co-founded ClearPoint after years inside the Balanced Scorecard world, and the pattern I have watched repeat in city after city is the same one this data confirms.
Cities do not have a measurement problem. They have a maintenance problem. I have sat in budget rooms where a department proudly walked through forty KPIs, and when I asked who owned the third one and when it was last updated, the room went quiet. That silence is what a missing owner sounds like.
The cities that break out of the pack are boring to watch, in the best way. They do not track more than their peers. They track the same things with more discipline. Every objective has a name on it. Every measure has a date by which it must be current. And the quarterly review asks three plain questions about each initiative: what did it cost, how long did it take, and did it have the impact we wanted? When I see a city doing that, I can predict its completion rate will sit in the top tier long before I ever look at the dashboard. The benchmark that matters was never the size of the library. It was whether anyone was on the hook.
What Top-Tier Cities Do Differently
Washington State Department of Licensing. Serving 6 million residents, the agency had accumulated 150+ measures, the classic government sprawl. Rather than add more, its team narrowed to a critical few and reframed performance around the people behind the numbers: who is underserved, and who is un-served altogether. They used ClearPoint to visualize performance by groups of residents and quoted customers directly in leadership reports. The lesson for any city: the win came from subtraction and ownership, not from a longer KPI list.
Public dashboard leaders like Sugar Land and Fort Worth ran their strategic progress in the open, on community dashboards residents could read. Publishing forces a discipline that internal-only plans never feel: you cannot leave a measure stale for two years when taxpayers are watching the trendline. Transparency is one of the most effective freshness mechanisms a city has.
What To Do This Week
- Calculate your completion rate. Count initiatives due in the last 12 months and how many actually closed. Then split them by whether they had a named owner.
- Assign an owner to every objective. This is the lever that moves on-track rates. If your owner rate is under 25%, fixing it will do more for execution than any new metric you could add.
- Find your stale measures and set update dates. The fastest credibility win is getting your existing numbers current before your next review, and ClearPoint shows which ones are out of date.
- Pick three benchmark numbers, not forty. Track completion rate, owner rate, and freshness at the citywide level. Report them every quarter. They will tell you more than a 140-KPI scorecard.
- Publish what you can. A public dashboard, even a small one, converts internal good intentions into external accountability, and accountability is what keeps measures fresh.
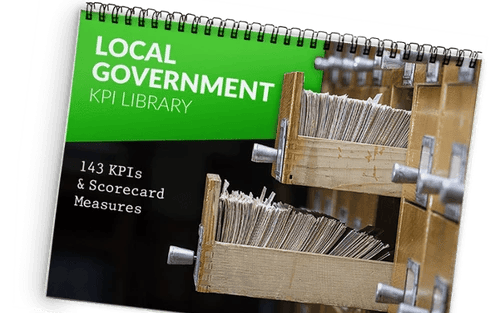
Ready to see where your city stands against these benchmarks? Book a ClearPoint demo to map your completion, ownership, and freshness rates against local-government peers — or download the 143-measure Local Government KPI Library below to build a plan worth benchmarking.
Methodology: Benchmarks are drawn from anonymized, aggregated ClearPoint Strategy platform data. The local-government cut covers 156 cities and counties (median 18 plans / 136 projects per organization, 55,000+ projects total). Ownership and assessment effects are calculated across 52,247 objectives from 324 organizations spanning municipal, state, healthcare, education, financial services, and energy sectors.
See how ClearPoint runs your government's strategic plan — book a demo
Common questions
What is the average number of KPIs a city government tracks?
The average city government tracks 820 KPIs (performance measures) in its strategic plan, according to ClearPoint platform data from 225 local government organizations. In addition to KPIs, the typical city manages 154 objectives, 416 initiatives, and 390 milestones — totaling over 1,900 strategic elements. The most commonly tracked KPI categories are Parks & Programs (6.8%), Financial Metrics (4.9%), and Citizen Satisfaction Surveys (4.1%).
What is the initiative completion rate for local governments?
ClearPoint platform data shows that cities are the best-executing government tier, ahead of state and federal agencies. Results vary widely by city, and ownership makes a difference: initiatives with a named owner are completed 2.5x as often (21.5% vs. 8.7%).
What departments should a city include in its strategic plan?
Based on analysis of 225 local government strategic plans on ClearPoint, the five most universally tracked departments are Human Resources (57 cities), Police Department (51), Fire Department (47), Public Works (42), and Finance (41). These departments form the operational core that nearly every city tracks at the strategic level. Additional departments like IT (23 cities), Parks and Recreation (23), and Economic Development (19) are added based on strategic priorities.
What are the top strategic priorities for city governments?
Analysis of 18,362 objectives across 225 local government plans on ClearPoint reveals that Economic Development is the dominant strategic priority at 16.3% of all city objectives. Workforce & HR (9.2%), Community Engagement (8.5%), Infrastructure (6.7%), and Public Safety (6.6%) round out the top five. Emerging priorities include Sustainability & Environment (2.3%) and Equity & Inclusion (0.8%), both growing rapidly in newer plans.