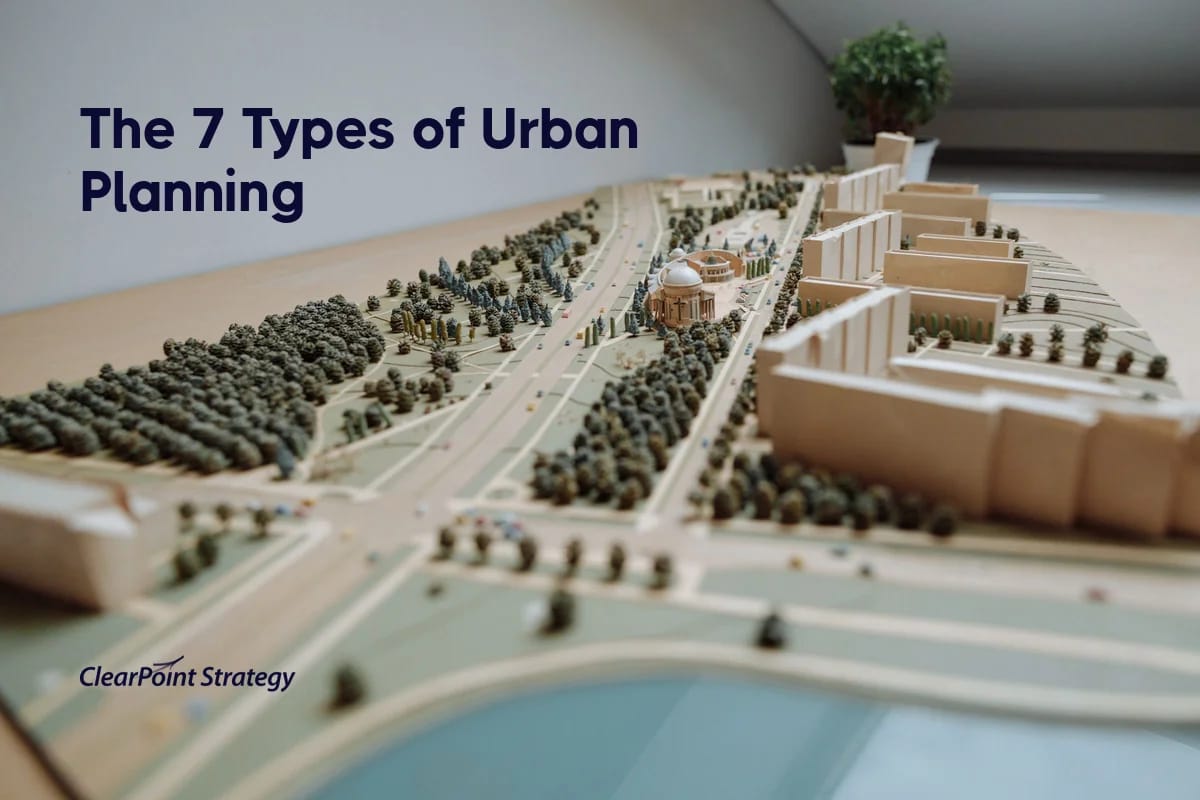
The 7 types of urban planning, ranked by what our data on 119 local governments shows actually gets built — and why the most visionary plans finish least.
- Break visionary goals into owned, funded, dated projects. Economic development projects finished at 3.2% versus 45.5% for parks and recreation.
- Give every measure an owner who keeps it current. In these cities, 64% of performance measures hadn't been updated in over a year.
- Tie projects to a dedicated funding stream where you can. Work tied to a utility, permit or fee survives budget season; general-fund work often loses.
- Add 3-year funded steps to any long-range master plan. Without them, a 20-year plan becomes "a wish list of unfunded needs" (GFOA).
- Compare your city with the free city benchmark. It takes three minutes and needs no signup.
Every city runs two kinds of plans.
The first kind you can stand on. A repaved road. A new fire station. A trail through the park that opens on a Saturday, with a ribbon and a mayor and a pair of oversized scissors.
The second kind lives in a binder. A “comprehensive economic vitality framework.” A twenty-year vision, adopted by unanimous vote, celebrated in a press release, and opened maybe twice after that.
Both are urban planning. Only one tends to get built.
We wanted to know how often the second kind gets done, so we looked at our own data: the live performance plans of 119 local governments running on ClearPoint. That covers nearly 50,000 active projects and more than 90,000 performance measures from real cities, tracked year over year.
We found a gap most planning textbooks skip. The type of planning a city does is the single best predictor of whether it ever gets finished, and the most ambitious types finish least.
How we measured this. We analyzed anonymized, aggregate project and measure data from local-government accounts on the ClearPoint platform. We excluded demo, training, and sample scorecards (the practice cities every software has). “Finished” means a project was marked complete in the platform. To judge completion fairly, we tracked every project that was due in 2024 and checked it more than a year later, in early 2026. No cherry-picking by city. The finding is the relative gap between planning types, and those gaps are large.
The headline number
Of roughly 6,500 projects that local governments had on the calendar for 2024, ClearPoint shows which ones were marked finished. The more concrete and owned the work, the more of it got done.
This is not a survey or a consultant’s slide. It is the actual project lists of 79 cities and counties, checked a year and a half later. The data shows which commitments are done, which are late, and which need an owner.
Completion isn’t evenly spread. It clusters by the kind of planning. Below are the seven types, from the ones that get built to the ones that don’t, with what the data says about each.
The seven types of urban planning, ranked by what gets done
Urban planning is a chain, not one discipline. A long-range vision sets direction. Strategic and land-use planning translate it into priorities and rules. Capital and infrastructure planning fund the concrete work. The American Planning Association’s Sustaining Places standard frames the comprehensive plan as the spine that holds it together. Here is how each link performs.
1. Infrastructure planning — the work that gets built
What it is: the systems a city runs on, such as roads, water, transit, public buildings, fleet, facilities.
This is the concrete end of the spectrum. Public works projects in our data finished at 34.7%, and the parks-and-recreation slice, the most tangible work a city does, finished at 45.5%, the highest of any category we measured.
The reason is simple. An infrastructure project has an address, a budget line, and an engineer whose name is on it. You can photograph it. You can drive on it. When something is that concrete, somebody owns it, and owned things get done.
2. Environmental planning — funded, mostly finished
What it is: stormwater, utilities, waste, air and water quality, climate resilience, habitat and flood management.
Environmental work landed at 29.3% finished, not far behind infrastructure. The reason is the same: most of it is tied to a utility, a permit, or a fee. When a project has its own funding stream, it survives the budget season. When it depends on the general fund, it competes and often loses.
3. Land-use planning — the rules that mostly hold
What it is: zoning, development codes, ordinances, and permitting, the legal machinery that decides what gets built where.
Land-use projects finished at 26.2%. That is solid, because regulation has teeth and deadlines; a code update has a hearing date. It still sits below the physical work. The further a plan moves from a shovel toward a policy, the more it slips.
4. Master planning — the long horizon
What it is: the build-out blueprint, often for greenfield land or a district, a 10-to-20-year picture of streets, density, and infrastructure.
Master plans are hard to score by design: their horizon outlasts the budgets meant to deliver them. That is the point, and also the trap. A 20-year plan with no 3-year funded steps becomes what the Government Finance Officers Association bluntly calls “a wish list of unfunded needs.” The vision is real, but the execution becomes optional, and optional work waits.
5. Strategic urban planning — the umbrella that needs an owner
What it is: the citywide goals (quality of life, safety, mobility, prosperity) that everything else is supposed to ladder up to.
This is the layer where most cities start, and the layer that drifts fastest. A strategic goal like “a more vibrant downtown” has no address and no scissors. It only gets done if it’s broken into owned, funded, dated projects that are then tracked. Skip that step, and the strategy becomes scenery.
6. Urban revitalization — where the gap opens up
What it is: rebuilding areas in decline, such as blighted corridors, aging downtowns, distressed neighborhoods.
Here the floor drops out. Revitalization projects finished at just 9.6%. The reason is structural: revitalization depends on forces a city doesn’t control, such as private developers, market timing, and grant cycles. Five agencies share the work, so nobody owns it. The plan is sincere, but the execution is somebody else’s job, which means it’s no one’s.
7. Economic development — the most visionary, the least finished
What it is: attracting employers, growing the tax base, creating jobs.
This is the bottom of the gradient: 3.2% finished. Against parks’ 45.5%, that’s a 14× gap between the most concrete planning a city does and the most aspirational.
Economic development carries the grandest language and the loosest accountability. A goal like “Position the city as a regional center” names no target, no owner, and no due date. The outcomes depend on companies that don’t report to city hall. So the projects sit open: earnest, important, and unfinished.
Why the gradient exists
Three forces decide whether a plan gets built. Every type above sits somewhere on each one.
Concreteness. A trail has a shape. “Economic vitality” doesn’t. The more abstract the goal, the easier it is to nod at and walk past.
Funding. Work tied to a dedicated dollar survives. Work that competes for the general fund every spring eventually loses. The GFOA has said it for years: a plan without funded steps is a wish list.
Ownership. This is the quiet one, and it’s the biggest. In ClearPoint data, initiatives with a named owner complete at 2.5× the rate (21.5% vs. 8.7%), and ClearPoint shows which measures haven’t been touched in over a year.
These are the metrics cities chose to watch. A measure nobody updates is a fossil, and a plan built on fossils doesn’t move.
The types that finish (parks, roads, utilities) are the types where ownership is obvious. The types that fail are the ones where everyone agrees the goal is important and no one’s name is on the line.
The myth of the magic number
An older version of this article claimed nine measures was the “optimal” number for an urban planning project. It’s a tidy idea, and it’s not true.
We checked. Across these cities, the median plan tracks 10 to 11 measures, but the spread matters more. Nearly a third of plans track five or fewer. Another third track twenty-one or more. One tracked 1,450.
There is no magic number, because the number was never the lever. A plan with five owned, updated measures beats a plan with fifty fossils. What matters is whether anyone is still looking, not how many. (Corporate strategy research agrees on the focus instinct: MIT Sloan found 78% of large companies publish only three to five priorities. The count is the symptom; ownership is the cause.)
What the cities that finish do differently
Across 119 governments, the cities near the top of the gradient share one habit: they make the work visible, and they give every piece an owner.

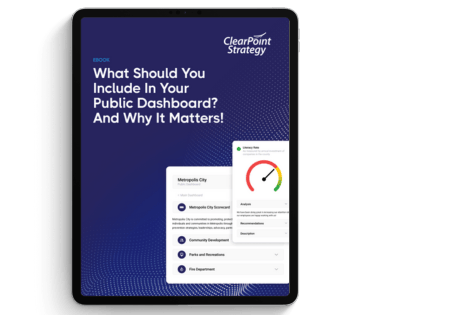
A public performance scorecard in ClearPoint. Every objective carries a status and an owner. (Illustrative; “Metropolis” is our sample city.)
Germantown, Tennessee ran its 15-year plan, “Germantown Forward 2030,” in the open: tracked, reported, and reviewed. In 2019 it won the Malcolm Baldrige National Quality Award, the highest performance honor a U.S. organization can earn. Very few local governments ever have.
You hear the same thing from the cities that make it work. “Prior to ClearPoint, we never had the data in a way individuals could value,” Octavius M., Assistant to the City Manager in Goldsboro, North Carolina, told us. Bartlett, Tennessee’s chief administrator put it another way: “We had everybody doing these great things, but in their own separate entities. What ClearPoint helped us do is bring all that together. We’re not working in silos.” Both cities made the same move: pull the work into one place, give it an owner, and let people see it.
None of this is exotic. Take the visionary plan, break it into owned and dated projects, put the status where people can see it, and keep it current. That’s the difference between the 45% and the 3%: follow-through, not ambition.
The hard part was never the plan
Cities are good at planning. They hold the workshops, run the surveys, hire the consultants, and pass the resolution. The binder is real, and often it’s excellent.
The hard part comes after the vote, when the consultant leaves, the scissors are back in the drawer, and on an ordinary Tuesday the plan needs someone to open it, update it, and move it one project forward. That’s the work local governments rarely staff and software rarely shows.
A strategic plan is a promise a city makes to itself, and keeping it is harder than writing it.
Common questions
Why do so many urban plans fail to get implemented?
Not for lack of strategy. They fail in the hand-off from plan to owned, funded, tracked project. Across these 119 governments, 64% of the performance measures they set hadn’t been updated in over a year. A plan nobody maintains doesn’t move, so give every measure an owner and an update date.
How many performance measures should an urban plan have?
There’s no magic number. The median local-government plan tracks 10 to 11 measures, but the range runs from a handful to dozens. What matters isn’t the count — it’s whether each measure has an owner who keeps it current. Five owned, updated measures beat fifty that nobody touches.
How can a city make economic development projects more likely to finish?
Break each aspirational goal into projects with a location, a budget line, a named owner and a due date, then track them where leaders see status. Economic development is the bottom of the gradient at 3.2% finished, largely because outcomes depend on employers outside city hall. Tie each project to something the city controls.
How do you turn a 20-year master plan into work that gets funded?
Cut the long horizon into funded steps of about three years and place each step in the capital improvement plan and annual budget. Give every project a named owner and a completion date. A 20-year plan without funded near-term steps becomes what the GFOA calls “a wish list of unfunded needs.”