Balanced Scorecard: The Comprehensive Guide
.webp)
By the end of this article, you’ll be a Balanced Scorecard expert. Really.
The Balanced Scorecard (BSC), in my humble opinion, is one of the best management reporting frameworks available. I’ve worked with countless clients to integrate the BSC, and know it like the back of my hand.
But if you’ve landed on this page, I’m guessing you aren’t looking for a simple, detail-less, contrite description of what a scorecard is and how to use it. You can find those all over the internet. You are probably wanting less of a simple definition, and more of an easy-to-digest, full and comprehensive example.
So I’ve created one. (Actually, I created seven.) I’m going to break down what a Balanced Scorecard is—from strategy mapping, to initiatives—and describe its intricacies in detail. Let's dive in.
What Is A Balanced Scorecard (BSC)?
A Balanced Scorecard—often abbreviated as “BSC”— is a strategy management framework that includes four perspectives of your strategy: Financial, Customer, Internal Process, and Learning and Growth. We'll dive deeper into examples of each perspective below.

Definition Cheat Sheet
.webp)
If you’re just starting to learn about the Balanced Scorecard, you’re going to see the words “objective,” “measure,” and “initiative” used regularly. You’ve probably heard them used before, but here’s a quick refresher course on what they mean.
- Objectives are high-level organizational goals. When you create an objective, you should focus on what your organization is trying to accomplish strategically. A very general example would be: “Become an internationally-recognized brand.” The typical BSC has 10-15 strategic objectives.
- Measures help you understand if you’re accomplishing your objectives strategically. They force you to question things like, “How do I know that I’m becoming an internationally-recognized brand?” (Hint: Your measures might change, but your objectives will remain the same.) You might have 1-2 measures per objective, so you are aiming to come up with 15-25 measures at the enterprise level of your strategy.
- Initiatives are key action programs developed to achieve your objectives. You’ll see initiatives referred to as “projects,” “actions,” or “activities outside of the Balanced Scorecard.” Most organizations will have 0-2 initiatives underway for every objective (with a total of 5-15 strategic initiatives).
- Action items typically arise from review meetings, and are tasks typically delegated to one person or a small team. They are technically not part of the BSC framework, but they are part of the management process as a whole; they help to achieve key initiatives in a timely and organized fashion.
In Summary
You have a high-level goal in mind, which is your objective. The measures say, “How will I know that I’m achieving the objective?” (In other words, they allow you to see if you’re meeting your goals.) Then, the initiatives are put in place to answer the question, “What actions am I taking to accomplish the objective?”
And finally, action items help delegate out small jobs that will allow you to complete your initiatives. Keep in mind, you may have multiple initiatives focused on improving your measures and achieving your objective. And, if your projects are not helping you improve in these areas, you may need to rethink your overall strategy.
Why Build A Balanced Scorecard?
At its core, the Balanced Scorecard is, of course, well-known for being an effective performance measurement model. Goals tend to be a little fuzzy (“Yeah, it feels like we’re accomplishing that….”), and it’s difficult to actually achieve high-level objectives unless they’re broken down. The Balanced Scorecard enables you to break goals into measures, measures into projects, and projects into action items. Measures should always tie back to goals, giving you direct feedback around how you’re doing. By aligning actions with strategy—and measuring the outcome of those actions—you gain directly relevant insights on strategic performance.
But the Balanced Scorecard is more than just a measurement system. Recently, I was interviewing a client at a North American unit of a large international organization as part of a project to help align this unit with the Balanced Scorecard of its corporate parent, when the client shared an interesting comment with me.
“I’ve been spending most of the past year working on the behavioral aspect of alignment within my sphere of control in the organization,” he said. “So the timing of your work is good, we should start measuring now.”
While this person, an executive vice president at the organization, was trying to be positive and encouraging about my project, I seized the opportunity to get on my “soap box” a little regarding the BSC.
“I like your thinking,” I said. “However, I’d argue—and I hope you will start to see—that the BSC is more than just a measurement system. It actually should provide ample support for and reinforce any behavior-based activities you are implementing."
“By defining and communicating strategic objectives and measures, the BSC sends everyone in your organization a signal about what behavior you are trying to promote,” I continued. “Measuring your organization’s performance is only part of it. Driving the desired performance is also key.”
He responded that he hadn’t really thought of it like that, but he saw my point. In fact, I think it helped him provide more effective answers to my interview questions as he thought about not only the strategic vision for his organization for the next three to five years, but also the objectives and measures that would best help to drive strategy execution across the organization.
It’s true: Using the Balanced Scorecard as an approach to performance management offers other benefits beyond simply measuring performance. Comparing it to other frameworks (even the new, trendy ones), the Balanced Scorecard remains a compelling choice after all these years because:
It allows you to look both backward and forward.
Your team must be able to prove they are delivering certain promised results. To do that, they must be able to explain how you performed this past month, quarter, and year, and how you’re going to perform in the upcoming month, quarter, and year.
This requires using a management system that combines backward and forward-looking measures (with lagging and leading indicators). The system gives you the ability to know today’s performance and predict tomorrow’s performance, as well as demonstrate how your spending on strategic projects today will help improve your impact in the future. The Balanced Scorecard is the closest management tool to a crystal ball as you will find.

It offers a holistic view of your business.
The Balanced Scorecard is notable for its deviation from using just short-term financial measures to predict performance; its four perspectives give leaders a balanced, big-picture view of all the elements that impact success. It forces you to think about your organization from a financial perspective, as well as that of your customers, operations, and staff. Some of these factors can be ignored with other approaches.
Nothing about the OKR framework, for example, forces you to take a balanced view of strategy. Your OKRs could all be tied to finances or operations. Having the Balanced Scorecard’s mixture of performance metrics helps managers and decision-makers understand the trade-offs they’re making as part of long-term, strategic decisions.
It’s (likely) familiar to your people.
Having been around for more than 30 years, the Balanced Scorecard is familiar to most high-level business executives. Lots of people have experience with it and understand its concepts. Plus, there are an abundance of helpful resources available should you need them, whether you’re looking for examples of how other organizations have used the Balanced Scorecard or further explanation around its practical applications.
It’s adaptable to your organization.
The BSC has been adapted in many different ways over the years, with organizations putting their own personal twist on it. One recent development we’ve seen among our customers is the addition of a goals layer.
Goals are more tactical in nature than objectives. For example, an objective to increase profitability could be accomplished by setting two goals: one, to drive revenue from new markets; and two, to minimize ongoing expenses through technology investments. This additional detail doesn’t affect the overarching themes of the Balanced Scorecard, yet it gives an organization greater flexibility when executing and reporting on strategy.
It gives structure to your tracking and reporting.
Organizations often have an overwhelming amount of data to sift through, but if you’ve built your scorecard correctly, you have a more focused way of gathering, collecting, and reporting on the data that’s most important to your strategy. The scorecard framework clarifies your areas of focus, and it becomes easier to track and share the results of your scorecard monthly or quarterly.
It helps align employees’ work with organizational goals.
The Balanced Scorecard helps with this in two ways:
One, a Balanced Scorecard strategy map (see the next section) helps communicate the long-term plan so everyone understands what you’re trying to achieve and how. Employees will also know how they contribute to the strategy—each department and individual should be able to see how what they do impacts the various initiatives, measures, and goals that are being reported at the top level.
Two, the system becomes even more effective when you cascade the top level of the scorecard down so departments’ and even employees’ goals feed into the overarching organizational scorecard. As a result, every level of the company is in alignment, supporting the organization’s mission and vision. This capability for alignment is one of the key reasons for choosing the scorecard system.
You can reap all the benefits above, but not without some degree of effort. Having a strategy inevitably requires tracking and reporting on measures and projects. If those activities aren’t done the right way, strategy execution can be tedious and get in the way of actually doing work. Think of it like this: There will always be an infinite amount of work, but having a strategy ensures people are doing the right work.
When you go into this process, consider how you’ll simplify data collecting and reporting. With more and more data becoming available, it’s easy to drown in it. Done right, the BSC makes you choose the set of metrics that are important to your business, as opposed to collecting everything. ClearPoint Strategy was designed to relieve the burdens associated with Balanced Scorecard management, including data collection—our tool connects with your various repositories to receive data from them automatically. (See the last part of this article, Understanding Your Scorecard, for more information on how ClearPoint makes strategy reporting clear and simple!) With the right tool, you can combat reporting fatigue—and are more likely to stay the course for the duration of your strategic plan.
Balanced Scorecard + More Data = Better Strategy
The Balanced Scorecard is always evolving. In the future, we believe data analytics will play an even greater role in the scorecard system, hopefully encouraging organizations to reevaluate their objectives more frequently than the five-year period that currently prevails.
Most companies have a tendency to create a three- to five-year strategic plan and evaluate projects and measures—but not objectives—yearly. However, depending on how quickly your industry changes (technology vs. manufacturing industries, for instance), some of the objectives may also need an overhaul annually.
We get it—creating the plan to begin with is a lot of work! But there are many more tools available today—including ClearPoint—that provide access to data quickly, which can be used to reevaluate your strategy at its highest level more frequently. If performance in one year is disappointing, is that because you have a good strategy you’re not executing well? Or is the strategy itself flawed? It’s becoming increasingly simple to tap into the necessary data and use it to assess your scorecard in its entirety, rather than just its individual pieces.
A Full & Exhaustive Example: Upward Airlines
Let’s dive into the nitty-gritty of Balanced Scorecards, starting with strategy maps.
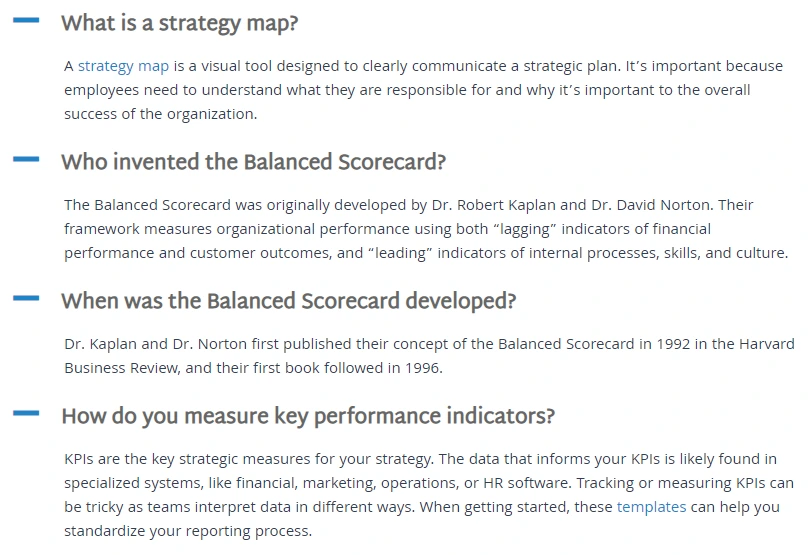
What is A Strategy Map?
One of the more powerful elements in the Balanced Scorecard framework, a strategy map, clearly visualizes your strategy for everyone to see. A strategy map is a one-page graphic that lays out your strategic objectives for you to easily communicate vision to your team.
Reading A Strategy Map
A Balanced Scorecard is more than just a strategy map, but the strategy map is an important element. Essentially, mapping allows you to put your strategy on one page, in a “language” that everyone can understand.
For this example, we’re going to look at Upward Airlines, a hypothetical airline loosely based on Southwest Airlines’ strategy in the early 2000s. I like to use Upward Airlines as a teaching example, because most people have flown on an airplane (and thus understand the objectives listed in the map).
.webp)
Want to see some sample strategy maps? Download this free eBook with 5 examples
Reading a strategy map isn’t at all complicated, but if you haven’t done it before, it’s good to know where to start and what you’re looking at!
First, notice the vertical text on the left side of the strategy map. These are the four perspectives of the Balanced Scorecard: Financial, Customer, Internal, and L&G (Learning & Growth). These perspectives make the BSC unique, because traditional reporting frameworks typically only look at the financial perspective.
The 15 bubbles you’re looking at are Upward Airlines’ objectives—they are all filed under one of the four aforementioned perspectives. Strategy maps are read from top to bottom. The objectives are listed in order of importance. So, you’ll notice that the top goal of Upward is its financial goal, which is Increase Shareholder Value.
Beneath the financial perspective is the customer perspective. This is because Upward leaders believe that the way they’re going to meet their number one goal of increasing shareholder value is by making their customers happy. So what makes the customers happy? Well, Very Low Ticket Prices and Frequent Reliable Departures certainly do. And, the cost and experience need to be Comparable To Other Travel, like cars, trains, or buses.
They also know that to meet financial goals and make customers happy, they need to focus on Innovation by offering Fast Ground Turnaround, Good Locations that better serve their customers, and Direct Routes to big cities. They’ll foster good relationships by creating Fun Experiences where everyone is treated well, and emphasize No Elites, because they believe all of their passengers are equals.
Finally, they’ll focus on Cost Effectiveness strategies such as No Frills, Standard Fleet, and High Utilization. By not offering fancy upgrades, keeping the planes simple, and filling the flights completely, they’re able to offer affordable flights. In order to execute all of this, Upward looks at its final perspective, which is Learning and Growth. They believe in offering High Compensation, Flexible Union Contracts, and want to achieve High Employee Ownership of the company.
So as you can see, each of these perspectives directly relates to the next, offering a ground-up approach to strategy management.
7 Balanced Scorecard Strategy Map Templates
Now that you know how to interpret a strategy map, let’s take a look at a few examples. Reviewing strategy maps from both inside and outside your sector is critical, as it will give you a good idea of what other organizations are doing to ensure their success. The seven strategy maps below are hypothetical and for educational purposes only—but they can serve as a kind of scorecard template as you work on building your own.
In studying them and reading more about what makes each unique, you’ll have a better idea of how to make your strategy map the cornerstone of your strategic execution.
1. Bank Balanced Scorecard
.webp)
Naturally, any for-profit financial institution scorecard will list financial objective statements at the top of its strategy map. As you can tell from this map, this bank wants to be certain it can both support its clients and grow the business simultaneously. It’s worth noting that even though the departments, divisions, and territories of financial institutions may have different strategies, they should all tie to one common organizational strategy. Some organizations have one map for all departments and divisions and others have a separate map for each.
2. Manufacturing Balanced Scorecard

Manufacturing companies are primarily concerned with operational efficiency—both increasing their output and decreasing production costs. Some of the ways they can achieve these goals are by creating correctly-priced goods, ensuring their products can be easily obtained by customers, and manufacturing the right assortment of goods, among other things.
Manufacturers also typically place a large emphasis on safety, and so implement many related goals and metrics. Innovation is fairly common in manufacturing strategy maps today, but it is not included in the example above.
3. Software Balanced Scorecard
.webp)
In the software example above, the customer and internal perspectives are combined. This highlights what the customer is looking for and how the company is responding. There are three areas focused around the customer relationship, market leadership and operational excellence. The company also split their “Learning and Growth” perspective into two sections: Industry Expertise and Talent.
This is a nice example strategy map because it shows that you don’t have to have a perfect Norton Kaplan scorecard; you can be flexible with a map as long as it lays out your organization’s strategy in a clear way.
4. Local Government Balanced Scorecard
.webp)
You’ll notice how this municipal strategy map has five internal process categories. Some city officials refer to these as “key areas of focus” or “pillars of excellence.” Whatever you call them, these groupings of objectives are based on the areas deemed critical for the city, and should tie back into how your city officials relate to your citizens. For example, this strategy emphasizes safety, a strong economy, and a creative culture, among other things.
If you’re in municipal government, figure out which areas of focus are critical to your city through citizen and leadership input, and then group your objectives beneath those categories.
5. Hospital Balanced Scorecard
.webp)
Unlike the other examples above, this strategy map begins with a purpose statement. Not all organizations do this, but this may be helpful for healthcare organizations who need to place additional emphasis on what is most critical to them and what they’re trying to achieve. Additionally, note that this scorecard positions customer (i.e. patient) and financial goals together at the top of the strategy map.
This is because hospitals (and nonprofits) need steady financing to operate. Remember, this is another good example of how you can structure a strategy map to tell your story. The map is a flexible framework and can be built to meet your needs.
6. Nonprofit Balanced Scorecard

Mission-driven organizations often restate their mission above their strategy map to stay focused on their goal. Many nonprofits have trouble connecting their daily activities with their mission, so putting their objectives on the same map as their mission statement is a great way to make that connection.
With all nonprofits, understand there are situations they have direct control over and situations they have very little control over. (For example, providing job placement services is challenging during an economic meltdown.) Therefore, those in this industry have to do their best to determine realistic measures, initiatives, and goals that will help you make an impact where you can.
7. Education Balanced Scorecard
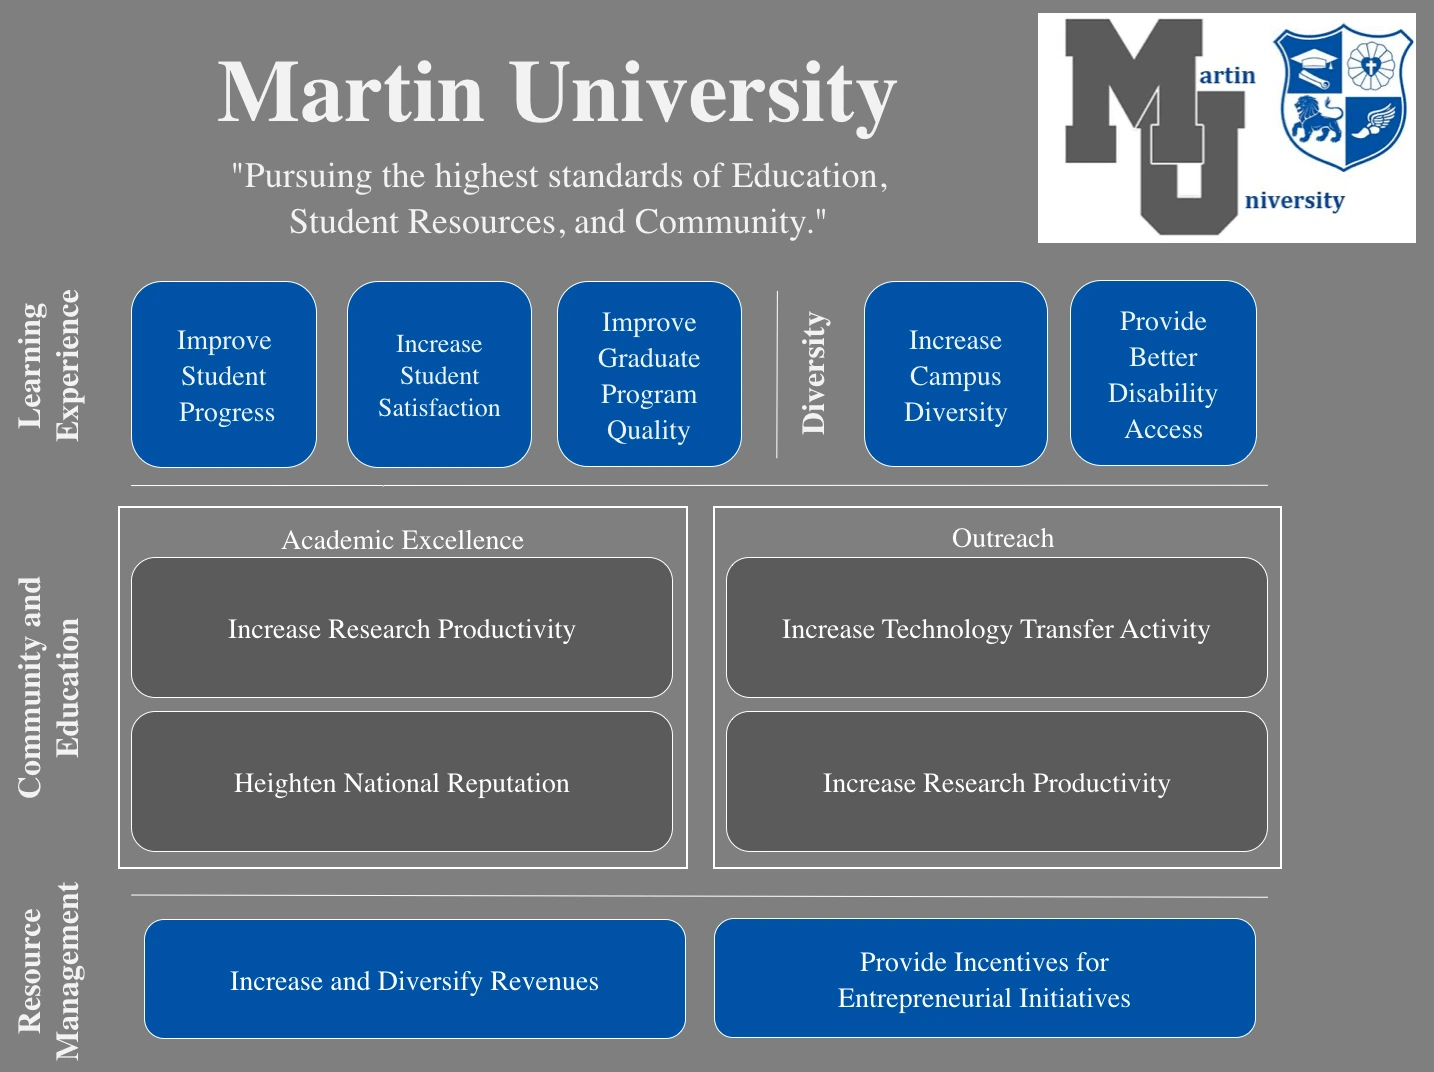
Higher education institutions typically emphasize student and faculty concerns in an attempt to improve the learning experience, which is a primary performance measure. This particular strategy map includes objectives such as creating more distinctive programs, increasing learning delivery formats, improving student satisfaction, and retaining qualified faculty and staff.
Note that not every school chooses to put financial objective statements at the top; others use different perspectives and place them differently on the map. Some, for example, prefer to create objectives for things like academic excellence, diversity, outreach, engagement, and other areas.
Understanding Your Scorecard
At this point, it’s important to note that there are several ways you can put together a BSC; you can use a program like Excel (more information here), Google Sheets, or PowerPoint, or you can use reporting software. For the sake of example, we’re going to show you a BSC in ClearPoint:
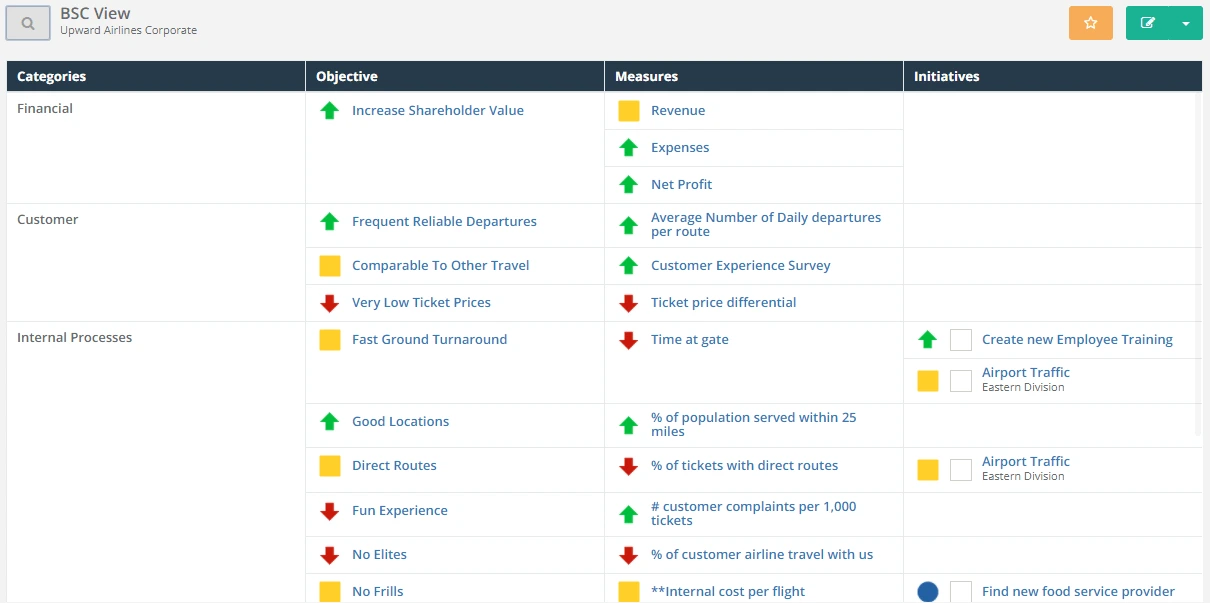
What you’re seeing in the image above is what you’d call a “scorecard view.” It is less visual than the strategy map, but provides more detail into the measures and initiatives that are tied to each objective.
Notice that in the scorecard view and in the strategy map, there’s either a red, yellow, and green indicator next to the objective, measure, or initiative. Green typically indicates that everything is going as planned, while yellow and red indicate that there are various degrees of trouble with whatever is being looked at.
Now that you know how to decode a strategy map, this scorecard view requires little explanation. Now, we’re going to break down the details of an objective, measure, and initiative.
Objectives
As previously mentioned, objectives are high-level organizational goals. That is why they are listed on the scorecard. They are typically the 10-15 strategic goals that your company would like to see achieved.
When you click on an objective in Balanced Scorecard software—say you’re looking at High Compensations in the L&G section—this is what you’ll find:

Here are a few of the elements you’re looking at:
- Owner: You’ll notice that Lawrence Zito is the “owner” of this objective, and is thus responsible for it.
- Description: This is the company-specific description of how Upward Airlines plans to achieve the objective.
- Average Wage: This is a way to measure progress of how Upward Air is doing. This chart helps you understand what the company is trying to achieve, and what they’re actually achieving. (If you click on the chart, you’re able to drill down into the details of the measure.)
- Divisions: Here we can see how the divisions (or child scorecards) align to this objective. This is a common approach for bigger organizations that have scorecards in their divisions and departments.
Measures
Measures help you understand if you’re accomplishing your objectives strategically. The measure tied to High Compensation is Average Wage. Here’s a look at the measure-view in ClearPoint:

You’ll notice some similar fields and some that are different. Once again, you have an “owner” and a chart analyzing the target and actual numbers for average wage to better understand whether goals are being met.
Here, you’ll also see a section for “Measure Data.” This is important because without data, an organization’s measures can’t be, well, measured. (Note: If you’re creating a BSC using a reporting software, it will likely harvest data both automatically and manually, saving you time and effort in the long run.)
Remember to measure what matters: what gets measured gets done. Choosing the right strategic measures drives performance and provides direction, but how do we determine what to measure? There are two key things I think about when selecting Balanced Scorecard measures.
- Have several indicators – to paint a picture and allow you to understand the relationships and determine what is actually affecting the outcome you want to achieve. There may be assumptions at the table that something drives progress, when in fact it’s something else entirely.
- Have a mix of output and outcome indicators – output indicators give you something to manage to. They help you look at what you’re doing on a day to day basis. You have to look at where you are and be able to predict where you’re going in addition to where you’ve been. Outcome indicators show you where you’ve been – what your past actions resulted in. Outcome indicators are drivers – they give you direction and help you figure out what it is you actually want to accomplish and if you are accomplishing it.
“See” Your Measures In ClearPoint
It’s no secret that charts are the best way to visualize quantitative data; that’s why any management reporting software worth its salt should have a variety of chart types you can use to show the status of a measure. But even though data often works with different charts, sometimes the standard types—status pie charts, target and threshold charts, status gauges, line and bar charts, etc.—don’t truly capture the essence of a particular measure. ClearPoint has all the standard chart types as well as three additional chart features that organizations often find helpful to tell the story of their strategy execution efforts:
- Year-over-year trend charting—ClearPoint makes it easy to compare last year’s data to the current period without having to create an additional series. An organization might use this chart to understand how the data is trending over time and note changes from one year to the next.
- Plot bands—Plot bands allow you to highlight certain regions in the background of charted data to show the upper and lower limits associated with specific criteria. For example, your criteria could be the green, yellow, and red colors associated with statuses, giving you a quick and easy way to see if your current data shows that you are on target (green), within 80–90% of target (yellow), or well below target (red).
- Trendlines—In ClearPoint you can add a trendline to show the direction of a data set. Depending on the type of data you have, you can choose a linear, exponential, logarithmic, power, or polynomial trendline.
Once you’ve created a chart, you can embed it into your website, a PDF report, or anywhere else with ClearPoint embed codes. Whenever you update your numbers inside ClearPoint, you can update every chart, everywhere it appears, with just one click. Choosing the perfect chart type for your data makes the numbers more meaningful, which means you can move toward your objectives with greater confidence.
Initiatives
Initiatives, as I mentioned earlier, are key action programs developed to achieve your objectives. They are often referred to as projects outside of BSC circles. One of the initiatives tied to the Average Wage measure and High Compensation objective is “Redesign Employee Satisfaction Survey”:


Aside from some of the fields you’ve already been familiarized with, there are several additions here:
- Description, Analysis, & Recommendation: This offers more insight into why the initiative is important, what it’s examining, and how it should be accomplished.
- Start & End Date: These are specific to an initiative, and must be noted.
- Milestones: This helps measure the progress toward achieving this initiative.
- Milestone Gantt Chart: This is a visual way to understand Upward Air’s progress in achieving its milestones.
Track Your Initiatives and Projects In ClearPoint
ClearPoint includes a Project Evaluation tool that allows you to track quantitative data specific to project-based elements such as milestones or action items. It enables you to:
- Link projects directly to your strategy (so you know they’re contributing to your organization’s larger goals);
- Track progress with regard to budget, percent complete, and quality.
- Evaluate project status automatically based on your predetermined indicators, such as budget targets, percent complete, start/end dates, etc.
- Include qualitative details and attachments to help explain the project’s status or progress, such as background information and relevant documents.
ClearPoint’s project management features help track and report on your most important projects—the ones that impact your strategy!
Getting (& Seeing!) Results
This process has now come full circle. You can see how every objective listed on the strategy map above is only going to be met when measures, initiatives, and action items are delivered correctly and accurately.
The Balanced Scorecard is only useful if you report on it.
What I mean is, simply having a scorecard doesn’t help you execute your strategy—you have to actually put it to work. This requires gathering data regularly, considering leadership feedback, reporting on a consistent basis, and making adjustments as needed. When you integrate the scorecard throughout your entire organization, you’ll see great things happen.
Simplify Balanced Scorecard Management
The advantages of a Balanced Scorecard are many, but only if it’s properly managed. Gathering data and reporting manually takes time, which is one of the main challenges with taking this approach. ClearPoint was built explicitly to save teams time and effort with regard to scorecard management.
• Our Data Loader saves hours of time typically spent on data entry by pulling data (both quantitative and qualitative) from other sources automatically. This automatic adding and updating also ensures your data is consistent and accurate as it moves from one place to the next.
• Our Interactive Data Grid/Summary Report features make it easy for all users to edit and update the strategic elements and related fields they are responsible for right from a personalized home page, removing the need to navigate through the tool to make updates.
• ClearPoint Sync lets you seamlessly move data from Excel files (ERP, sales, HR, or other systems) into ClearPoint, automatically synchronizing information with measures you already have in the software. This helps management continue to generate stunning reports for leadership without adding an extra layer of training for new individuals in a software they may not be familiar with.
Automatic, easy, and accurate—these are the reasons why so many organizations use ClearPoint to reach their strategic goals.
How To Make The Most Of The Balanced Scorecard
Just by virtue of creating a Balanced Scorecard means your strategic planning process is underway, and that’s good news—planning where you want to go is the first step to getting there. And while the BSC is an excellent framework for pursuing your organization’s main priorities, its usefulness doesn’t have to stop there. The Balanced Scorecard is an incredibly flexible tool that can provide guidance in other areas as well.
Think of the Balanced Scorecard as a kind of “North Star,” setting the direction your company wants to go. From there, you can use it to:
- Guide your resource usage. Linking budget to strategy allows you to use your resources as efficiently as possible in pursuit of specific goals. You decide which strategic projects are necessary to achieve the priorities or outcomes outlined on your Balanced Scorecard, allocate the appropriate funding to them, and track spending and progress. This type of budgeting approach helps translate high-level strategy down into actionable operational plans.
- Effectively evaluate potential projects. To decide whether to take on certain projects, measure them against your Balanced Scorecard. Will a particular project impact your key goals? If not, it warrants a conversation around whether it makes sense to devote resources to this new undertaking, or, since it’s not part of the strategy, to abandon the effort.
- Create departmental business plans. Extend the strategic planning process beyond the organizational level and down to the department level by having departments create their own Balanced Scorecards. Department business plans outline a specific department’s goals (which tie into the organization’s overall goals), the steps or initiatives the department will undertake to achieve those goals, and the timeline during which the department should achieve these goals.
- Manage employee performance. Cascade strategy down even further by using the Balanced Scorecard to set employee goals. Your people can then work toward accomplishing those objectives on a daily basis, using their skills and time to carry out the necessary tasks that will advance your plan. Connecting employee goals to organizational goals both creates accountability and also helps motivate employees to perform at their best.
The Balanced Scorecard is extremely versatile; it can be used at any level and in any type of organization. By applying it in all the above scenarios, you create a strategy-focused organization that is well-positioned to achieve its stated objectives.
Where Should I Go From Here?
There are three options at this point:
- If you don’t have a clearly defined organizational strategy, define one.
- If you already have a strategy and you’re looking for reporting software options, read 8 Things To Demand From Your Reporting Software Vendor to help focus your research process.
- If you’ve already defined your strategy and are ready to try some proven Balanced Scorecard software risk-free, schedule a call with our team for a quick tour of ClearPoint.
Balanced Scorecard FAQs


.webp)